Abstract
Statement of Problem
Although many efforts have been continually made to estimate long term prognosis of removable partial dentures, the complication of removable partial dentures was still found because of inaccurate fabrication procedure and improper maintenance care.
Purpose
The purpose of this study was to evaluate the clinical status of removable partial dentures.
Material and methods
A total of 112 individuals with 153 removable partial dentures (35 - 87 years, 64 women and 48 men) were examined by intra-oral examination, diagnostic cast and radiographic examination.
Results and conclusion
The results of this study were as follows: 1. Length of service of removable partial dentures was 5.3 ± 4.3 years (mean), 4.0 years (median). 2. A total of 45 removable partial dentures were considered failures. The loss of 18 abutments of 369 was founded. 3. Type of arch, Kennedy classification and type of opposite dentition were found to have no influence on longevity and success rate of removable partial dentures (P > .05). 4. Most common major connector was the palatal plate in maxilla and the number of lingual bar and linguoplate designed in mandible were similar. 5. The circumferential type retainer was the most commonly used retainer. 6. Sixty-three percent of the class I and II removable partial dentures incorporated indirect retention into the design. 7. Approximately 81% of the removable partial dentures had at least one defect. Excessive wear of posterior teeth (27.9%), lack of integrity (23.2%), lack of stability (22.6%) were frequent defects of removable partial dentures. (J Korean Acad Prosthodont 2009;47:320-7)
Go to : 
REFERENCES
1.Christensen GJ. Making better removable partial dentures. J Am Dent Assoc. 1995. 126:1041–4.
2.Academy of Prosthodontics. Principles, concepts, and practices in prosthodontics. J Prosthet Dent. 1995. 73:73–94.
3.Vanzeveren C., D'Hoore W., Bercy P., Leloup G. Treatment with removable partial dentures: a longitudinal study. Part I. J Oral Rehabil. 2003. 30:447–58.

4.Vanzeveren C., D'Hoore W., Bercy P., Leloup G. Treatment with removable partial dentures: a longitudinal study. Part II. J Oral Rehabil. 2003. 30:459–69.

5.Vermeulen AH., Keltjens HM., van't Hof MA., Kayser AF. Ten-year evaluation of removable partial dentures: survival rates based on retreatment, not wearing and replacement. J Prosthet Dent. 1996. 76:267–72.

6.Kapur KK., Deupree R., Dent RJ., Hasse AL. A randomized clinical trial of two basic removable partial denture designs. Part I: Comparisons of five-year success rates and periodontal health. J Prosthet Dent. 1994. 72:268–82.
7.Redford M., Drury TF., Kingman A., Brown LJ. Denture use and the technical quality of dental prostheses among persons 18-74 years of age: United States, 1988-1991. J Dent Res. 1996. 75:714–25.

8.Hummel SK., Wilson MA., Marker VA., Nunn ME. Quality of removable partial dentures worn by the adult U.S. population. J Prosthet Dent. 2002. 88:37–43.

9.Frank RP., Brudvik JS., Leroux B., Milgrom P., Hawkins N. Relationship between the standards of removable partial denture construction, clinical acceptability, and patient satisfaction. J Prosthet Dent. 2000. 83:521–7.

10.Kim JC., Han SB. Periodontal and prosthetic findings in patients treated with removable partial dentures or distally extending cantilever bridges. J Korean Acad Periodontol. 1993. 23:635–45.
11.Ban YS., Song KB., Jeong SH., Jo KH. Analysis of satisfaction with removable dental prosthesis among patents in private dental clinics. J Korean Acad Dent Health. 2001. 25:79–94.
12.Leempoel PJ., Van't Hof MA., de Haan AF. Survival studies of dental restorations: criteria, methods and analyses. J Oral Rehabil. 1989. 16:387–94.

13.Kratochvil FJ., Davidson PN., Guijt J. Five-year survey of treatment with removable partial dentures. Part I. J Prosthet Dent. 1982. 48:237–44.

14.Chandler JA., Brudvik JS. Clinical evaluation of patients eight to nine years after placement of removable partial dentures. J Prosthet Dent. 1984. 51:736–43.

15.Bergman B., Hugoson A., Olsson CO. Caries, periodontal and prosthetic findings in patients with removable partial dentures: a ten-year longitudinal study. J Prosthet Dent. 1982. 48:506–14.

16.Schwalm CA., Smith DE., Erickson JD. A clinical study of patients 1 to 2 years after placement of removable partial dentures. J Prosthet Dent. 1977. 38:380–91.

17.Curtis DA., Curtis TA., Wagnild GW., Finzen FC. ncidence of various classes of removable partial dentures. J Prosthet Dent. 1992. 67:664–7.
18.Owall BE., Taylor RL. A survey of dentitions and removable partial dentures constructed for patients in North America. J Prosthet Dent. 1989. 61:465–70.
Go to : 
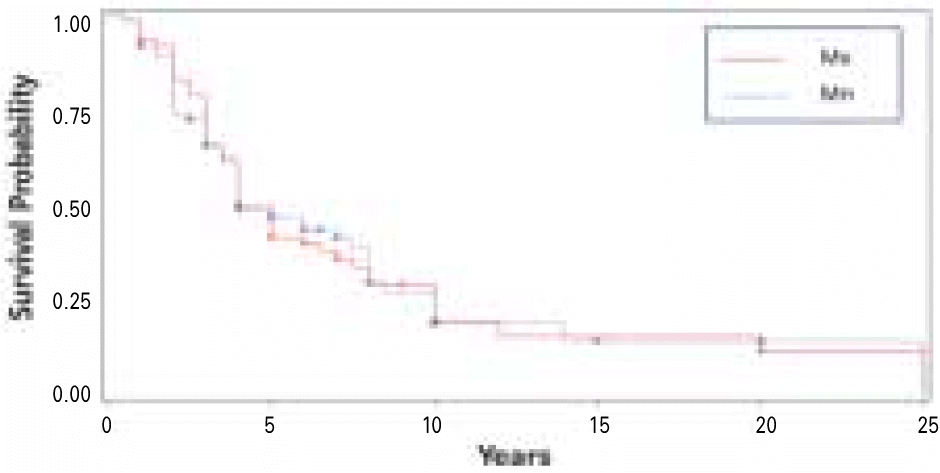
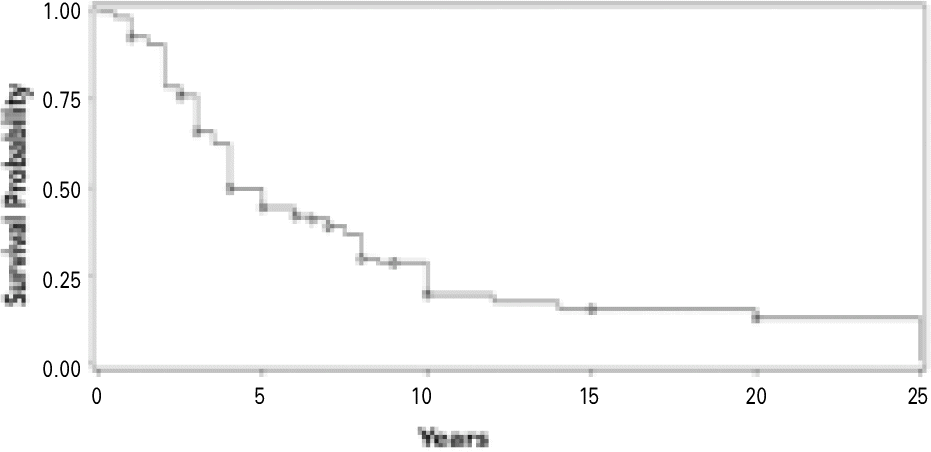
 | Fig. 2.Kaplan-Meier survival curve of removable partial dentures in the maxilla and the mandible. |
Table I.
Distribution of age group and gender
Table II.
List of examination and evaluation criteria
Table III.
Type and distribution of major connectors
| Maxilla | n | Mandible | n |
|---|---|---|---|
| Palatal strap | 11 | Lingual bar | 34 |
| Ant-post strap | 19 | Linguoplate | 39 |
| Palatal plate | 43 | No metal framework | 2 |
| U-shaped palatal connector | 2 | ||
| Unilateral design | 3 | ||
| Total | 78 | 75 |
Table IV.
Type and distribution of direct retainer
| Type of clasp | n | Type - other | n |
|---|---|---|---|
| Circumferential clasp | 271 | ERA | 5 |
| RPI | 45 | Magnet attachment | 4 |
| Other Roach | 10 | Telescopic crown | 29 |
| Ring clasp | 1 | Other type | 4 |
| Total | 327 | Total | 42 |
Table V.
Incidence of indirect retainer according to type of arch and Kennedy classification
| Arch | Class I | Class II | Class III | Class VI | ||||
|---|---|---|---|---|---|---|---|---|
| n | % | n | % | n | % | n | % | |
| Maxilla | 23 | 15 | 19 | 12.4 | 3 | 2 | 2 | 1.3 |
| Mandible | 29 | 19 | 18 | 11.8 | 4 | 2.6 | 0 | 0 |
| Total | 52 | 34 | 37 | 24.2 | 7 | 4.6 | 2 | 1.3 |
Table VI.
Distribution of removable partial dentures a for treatment failure according to criter
| Mode of failure | n | % |
|---|---|---|
| Loss of an abutment tooth | 12 | 26.7 |
| Abutment tooth with a mobility score of 3 or more | 5 | 11.1 |
| Rejection by the patient | 23 | 51.1 |
| Nonuse for mastication | 5 | 11.1 |
| Total | 45 | 100.0 |
Table VII.
Distribution of abutment loss according to type of retainer and Kennedy classification
| Retainer type | Abutment loss | Total | ||||
|---|---|---|---|---|---|---|
| Class I | Class II | Class III | Class IV | n | % | |
| Circumferential | 7 | 6 | 0 | 0 | 13 | 72.2 |
| Bar | 4 | 0 | 0 | 0 | 4 | 22.2 |
| Others | 1 | 0 | 0 | 0 | 1 | 5.6 |
| Total | 12 | 6 | 0 | 0 | 18 | 100.0 |
Table VIII.
Distribution of removable partial dentures in success and failure according to type of arch and Kennedy classification
Table IX.
Distribution of removable partial dentures in success and failure according to type of opposing dentition
| Opposing dentition | Success | Failure | Total | |||
|---|---|---|---|---|---|---|
| n | % | n | % | n | % | |
| Natural | 32 | 69.6 | 14 | 30.4 | 46 | 100 |
| CD | 15 | 62.5 | 9 | 37.5 | 24 | 100 |
| RPD | 61 | 73.5 | 22 | 26.5 | 83 | 100 |
| Total | 108 | 70.6 | 45 | 29.4 | 153 | 100 |
Table X.
Distribution of removable partial dentures in success and failure according to years in service
| Year | Success | Failure | Total | |||
|---|---|---|---|---|---|---|
| n | % | n | % | n | % | |
| 0 - 5 | 81 | 81.8 | 18 | 18.2 | 99 | 100.0 |
| 6 - 10 | 22 | 48.9 | 23 | 51.1 | 45 | 100.0 |
| 11 - 15 | 2 | 66.7 | 1 | 33.3 | 3 | 100.0 |
| 16 - 25 | 3 | 50.0 | 3 | 50.0 | 6 | 100.0 |
| Total | 108 | 70.6 | 45 | 29.4 | 153 | 100.0 |
Table XI.
Defect of removable partial dentures by Kennedy classification


 PDF
PDF ePub
ePub Citation
 Print
Print


 XML Download