

 PDF
PDF ePub
ePub Citation
 Print
Print


Abstract
Statement of problem & Purpose
To study the effect of different fluoridation methods after in-office bleaching on the color of teeth during severe staining with coffee.
Material and methods
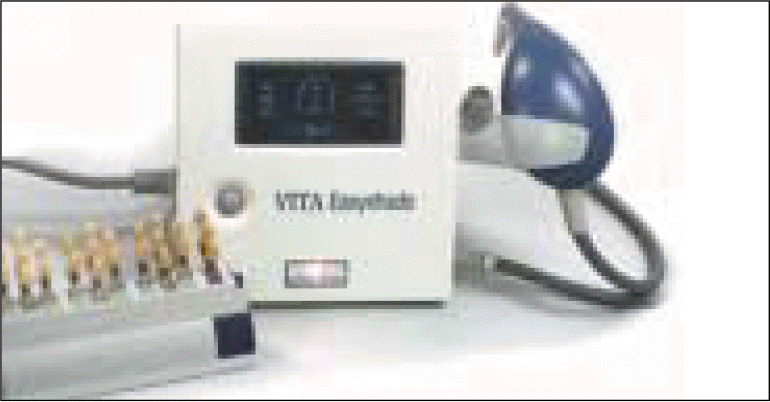
44 specimens were randomly divided into four groups. Group 1 (no bleaching, no fluoride, coffee) was served as control for the influence of coffee on the color of untreated teeth. Group 2, 3 and 4 were undergone bleaching with 35% H2O2 for 30 minutes a day on 3 consecutive days. Group 2 was remained without fluoridation. Group 3 and 4 were fluoridated for 1 hour with either Cavity shield® or pH 7 Gel®. All of groups were immersed in coffee solution for 7 days. Color determination was accomplished using the spectrophotometer (VITA Easyshade®).
Results
△L and △h increased, whereas △C decreased in the bleached groups. Pairwise comparisons with Tukey's HSD showed that there were statistically significant differences for △L and △h between the bleached groups and the non-bleached group (P < .05). △L and △h decreased continuously, while △C showed an increase after a decrease in all of groups during immersion in coffee solution. After immersion in coffee solution for 7 days there were no statistically significant differences for △L, △C and △h between the groups (P > .05). Also there were no statistically significant differences for △L, △C and △h between the group 3 treated with Cavity shield® and the group 4 treated with pH 7 Gel® (P > .05).
Go to : 
REFERENCES
1.Spasser HF. The walking bleach: 35 years later. Dent Today. 1996. 15:114–7.
2.Haywood VB., Heymann HO. Nightguard vital bleaching. Quintessence Int. 1989. 20:173–6.
3.Haywood VB. History, safety, and effectiveness of current bleaching techniques and applications of the nightguard vital bleaching technique. Quintessence Int. 1992. 23:471–88.
4.Dostalova T., Jelinkova H., Housova D., Sulc J., Nemec M., Miyagi M., Brugnera Junior A., Zanin F. Diode laser-activated bleaching. Braz Dent J. 2004. 15:Spec No: SI3-8.
5.Luk K., Tam L., Hubert M. Effect of light energy on peroxide tooth bleaching. J Am Dent Assoc. 2004. 135:194–201.

6.Tavares M., Stultz J., Newman M., Smith V., Kent R., Carpino E., Goodson JM. Light augments tooth whitening with peroxide. J Am Dent Assoc. 2003. 134:167–75.
7.Buchalla W., Attin T. External bleaching therapy with activation by heat, light or laser—a systematic review. Dent Mater. 2007. 23:586–96.
8.Fasanaro TS. Bleaching teeth: history, chemicals, and methods used for common tooth discolorations. J Esthet Dent. 1992. 4:71–8.
9.Sulieman M., MacDonald E., Rees JS., Newcombe RG., Addy M. Tooth bleaching by different concentrations of carbamide peroxide and hydrogen peroxide whitening strips: an in vitro study. J Esthet Restor Dent. 2006. 18:93–100.
10.Braun A., Jepsen S., Krause F. Spectrophotometric and visual evaluation of vital tooth bleaching employing different carbamide peroxide concentrations. Dent Mater. 2007. 23:165–9.
11.Leonard RH Jr., Smith LR., Garland GE., Tiwana KK., Zaidel LA., Pugh G Jr., Lin NC. Evaluation of side effects and patients' perceptions during tooth bleaching. J Esthet Restor Dent. 2007. 19:355–64.
12.Tredwin CJ., Naik S., Lewis NJ., Scully C. Hydrogen peroxide tooth-whitening (bleaching) products: review of adverse effects and safety issues. Br Dent J. 2006. 200:371–6.
13.Basting RT., Rodrigues AL Jr., Serra MC. The effects of seven carbamide peroxide bleaching agents on enamel microhardness over time. J Am Dent Assoc. 2003. 134:1335–42.
14.Cavalli V., Arrais CA., Giannini M., Ambrosano GM. High-concentrated carbamide peroxide bleaching agents effects on enamel surface. J Oral Rehabil. 2004. 31:155–9.
15.Zantner C., Beheim-Schwarzbach N., Neumann K., Kielbassa AM. Surface microhardness of enamel after different home bleaching procedures. Dent Mater. 2007. 23:243–50.
16.Lopes GC., Bonissoni L., Baratieri LN., Vieira LC., Monteiro S Jr. Effect of bleaching agents on the hardness and morphology of enamel. J Esthet Restor Dent. 2002. 14:24–30.
17.Pinto CF., Oliveira R., Cavalli V., Giannini M. Peroxide bleaching agent effects on enamel surface microhardness, roughness and morphology. Braz Oral Res. 2004. 18:306–11.
18.Schiavoni RJ., Turssi CP., Rodrigues AL Jr., Serra MC., Pe 、cora JD., Fro ¨ner IC. Effect of bleaching agents on enamel permeability. Am J Dent. 2006. 19:313–6.
19.Efeoglu N., Wood DJ., Efeoglu C. Thirty-five percent carbamide peroxide application causes in vitro demineralization of enamel. Dent Mater. 2007. 23:900–4.
20.Chng HK., Ramli HN., Yap AU., Lim CT. Effect of hydrogen peroxide on intertubular dentine. J Dent. 2005. 33:363–9.
21.Hairul Nizam BR., Lim CT., Chng HK., Yap AU. Nanoindentation study of human premolars subjected to bleaching agent. J Biomech. 2005. 38:2204–11.
22.Bistey T., Nagy IP., Simo 、A., Hegedus C. In vitro FT-IR study of the effects of hydrogen peroxide on superficial tooth enamel. J Dent. 2007. 35:325–30.
23.Browning WD., Blalock JS., Frazier KB., Downey MC., Myers ML. Duration and timing of sensitivity related to bleaching. J Esthet Restor Dent. 2007. 19:256–64.
24.Ghavamnasiri M., Bidar M., Rad AH., Namazikhah MS. The effect of 16 percent carbamide peroxide on enamel staining susceptibility. J Calif Dent Assoc. 2006. 34:873–6.
25.Arme∧nio RV., Fitarelli F., Arme ∧nio MF., Demarco FF., Reis A., Loguercio AD. The effect of fluoride gel use on bleaching sensitivity: a double-blind randomized controlled clinical trial. J Am Dent Assoc. 2008. 139:592–7.
26.Leonard RH Jr., Smith LR., Garland GE., Caplan DJ. Desensitizing agent efficacy during whitening in an at-risk population. J Esthet Restor Dent. 2004. 16:49–55.
27.Attin T., Kielbassa AM., Schwanenberg M., Hellwig E. Effect of fluoride treatment on remineralization of bleached enamel. J Oral Rehabil. 1997. 24:282–6.
28.Bizhang M., Seemann R., Duve G., Ro ¨mhild G., Altenburger JM., Jahn KR., Zimmer S. Demineralization effects of 2 bleaching procedures on enamel surfaces with and without post-treatment fluoride application. Oper Dent. 2006. 31:705–9.
29.Lewinstein I., Fuhrer N., Churaru N., Cardash H. Effect of different peroxide bleaching regimens and subsequent fluoridation on the hardness of human enamel and dentin. J Prosthet Dent. 2004. 92:337–42.
30.Buchalla W., Attin T., Schulte-Mo ¨nting J., Hellwig E. Fluoride uptake, retention, and remineralization efficacy of a highly concentrated fluoride solution on enamel lesions in situ. J Dent Res. 2002. 81:329–33.
31.Hassel AJ., Grossmann AC., Schmitter M., Balke Z., Buzello AM. Interexaminer reliability in clinical measurement of L∗C∗h∗ values of anterior teeth using a spectrophotometer. Int J Prosthodont. 2007. 20:79–84.
Go to :
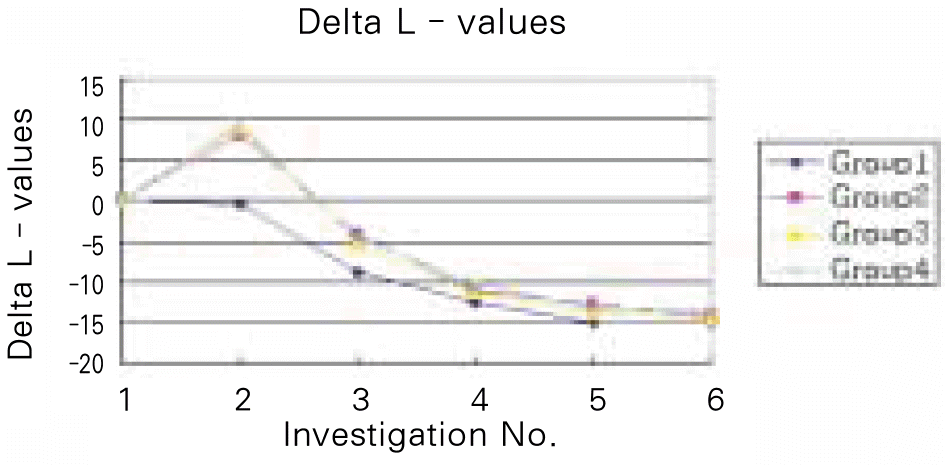 | Fig. 2.△L-values during the experiment. Investigation No.1; Baseline, No.2; After bleaching, No.3; Coffee immersion for 1 day, No.4; Coffee immersion for 3 days, No.5; Coffee immersion for 5 days, No.6; Coffee immersion for 7 days. |
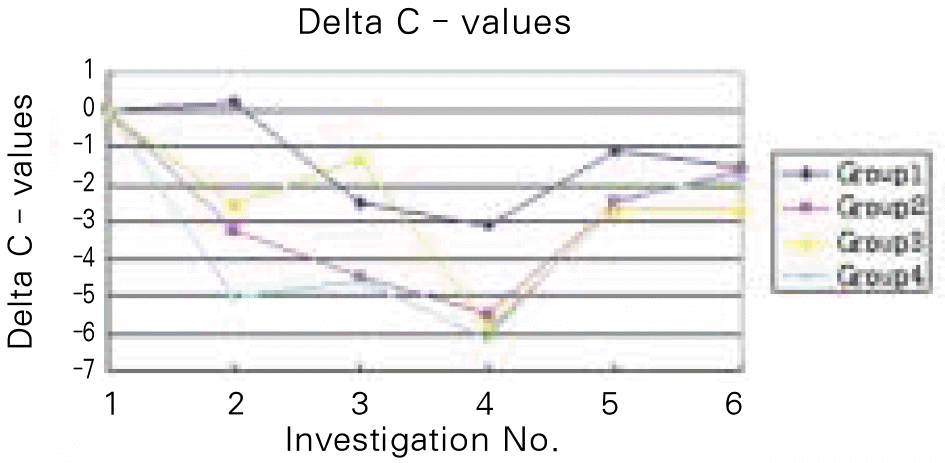 | Fig. 3.△C-values during the experiment. Investigation No.1; Baseline, No.2; After bleaching, No.3; Coffee immersion for 1 day, No.4; Coffee immersion for 3 days, No.5; Coffee immersion for 5 days, No.6; Coffee immersion for 7 days. |
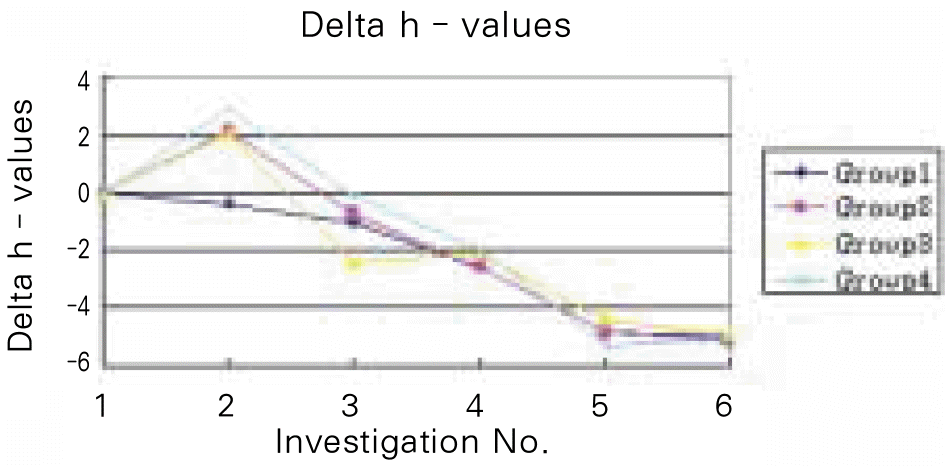 | Fig. 4.△h-values during the experiment. Investigation No.1; Baseline, No.2; After bleaching, No.3; Coffee immersion for 1 day, No.4; Coffee immersion for 3 days, No.5; Coffee immersion for 5 days, No.6; Coffee immersion for 7 days. |
Table I.
Experimental grouping (N = 44)
Table II.
Difference of lightness (△L) during the experiment
Table III.
Difference of Chroma (△C) during the experiment
Table IV.
Difference of hue (△h) during the experiment
Table V.
Repeated Measures ANOVA of △L
Table VI.
Repeated Measures ANOVA of △C
Table VII.
Repeated Measures ANOVA of △h
Table VIII.
One-way ANOVA table for △L, △C, △h after bleaching
Table IX.
Tukey's HSD for pairwise comparison between groups; After bleaching, Numbers represent P-values
 XML Download