Abstract
Statement of problem
Volume stability, microstructure reproducibility and fluidity along with compatibility with dental stone must be in consideration in order to use tissue conditioner as a material for functional impression. There are few studies concerning the influence of time factor in oral condition on surface roughness of the stone and optimal retention period in the oral cavity considering such changes in surface roughness.
Purpose
The purpose of this study was to find out the influence of various kinds of tissue conditioner, its powder/liquid ratio and immersion time on surface roughness of the stone.
Material and methods
Materials used in this study were the three kinds of tissue conditioners (Coe-Comfort, Visco-Gel, Soft-Liner) and were grouped into three: group R - mixed with standard powder/liquid ratio that was recommended by the manufacturers, group M - mixed with 20% more powder, group L - mixed with 20% less powder. Specimens were made with the size of 20 mm diameter and 2 mm width. Each tissue conditioner specimens were subdivided into 5 groups according to the immersion time (0 hour, 1 day, 3 days, 5 days, 7 days), completely immersed into artificial saliva and were stored under 37° C. Specimens of which the given immersion time elapsed were taken out and were poured with improved stone, making the stone specimens. Surface roughness of the stone specimens was measured by a profilometer.
Results
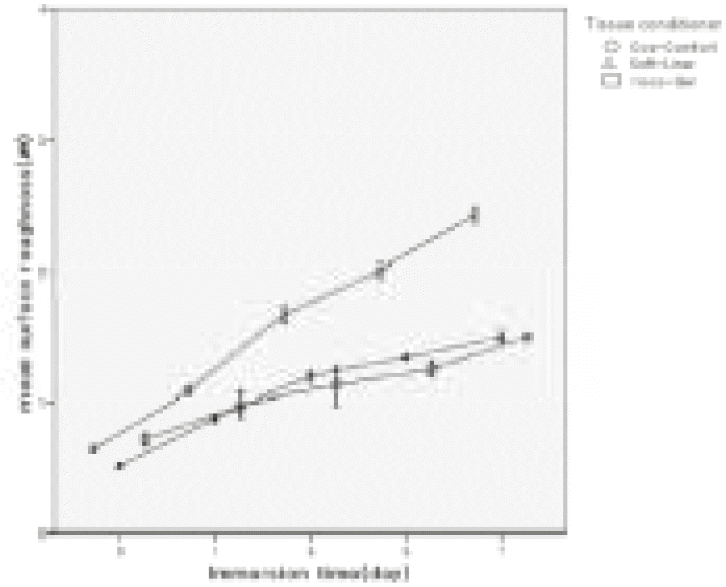
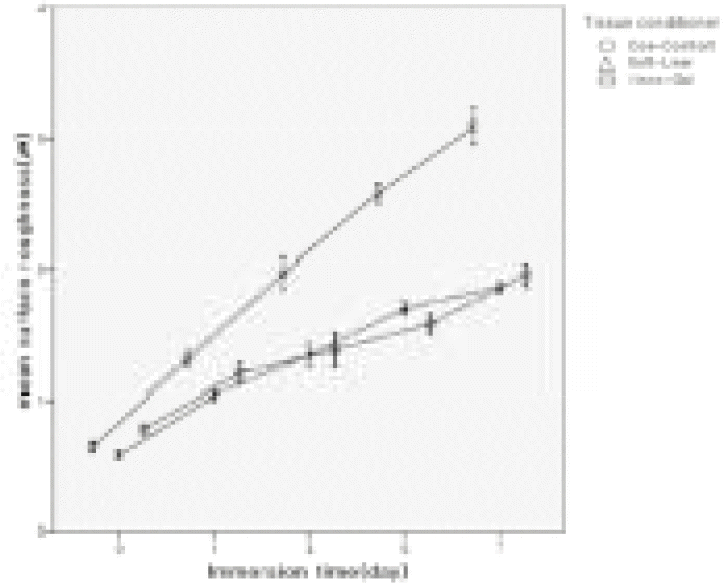
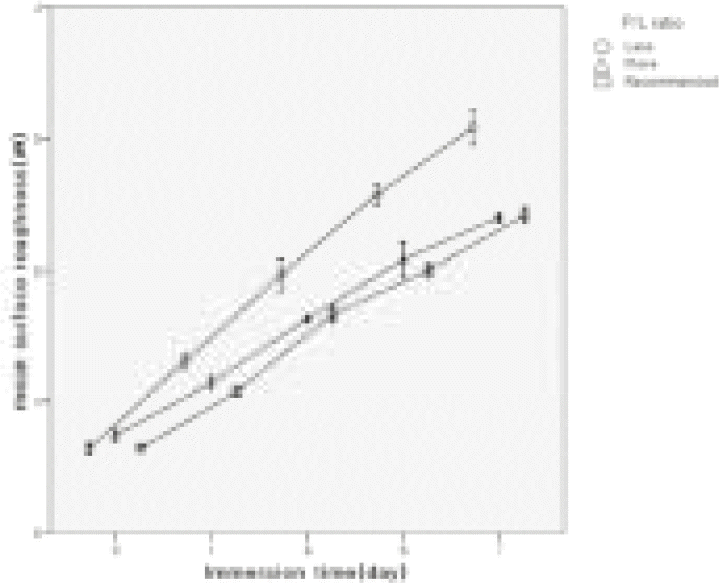
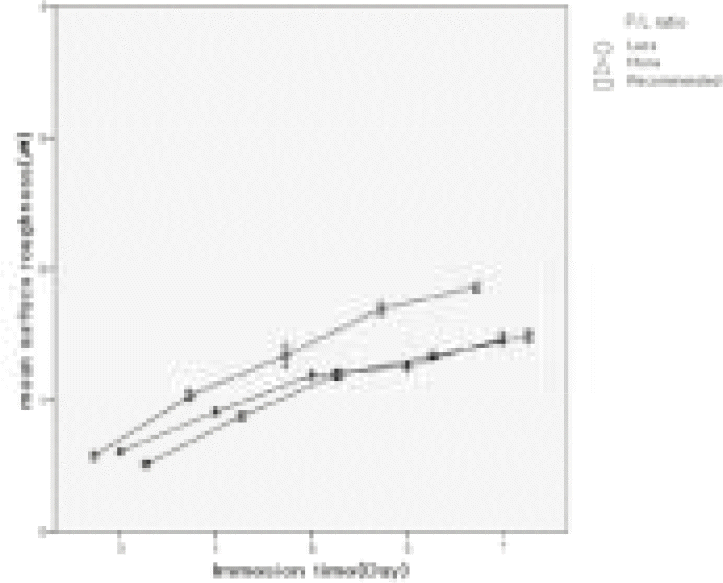
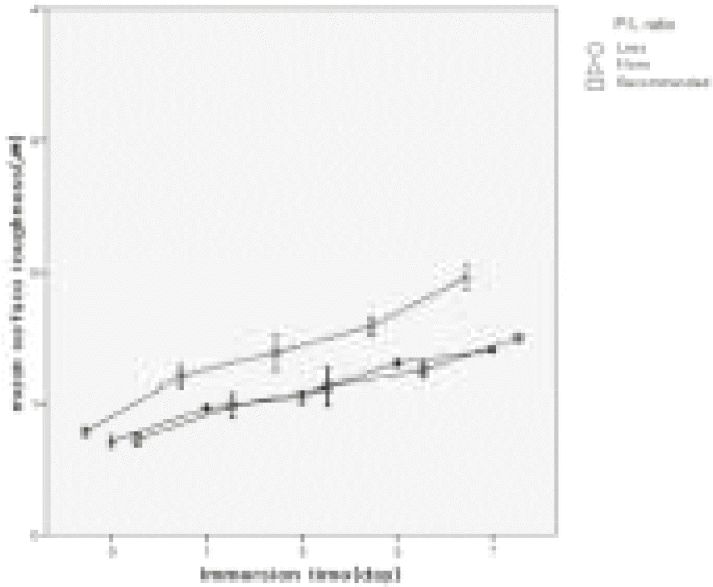
Within the limitation of this study, the following results were drawn. 1. Major influencing factor on surface roughness of the stone model made from tissue conditioner was the retention period (contribution ratio (ρ) = 62.86%, P < .05) of the tissue conditioner in oral cavity to make functional impression. 2. In case of Coe-Comfort, higher mean surface roughness value of the stone model with statistical significance was observed compared to that of Soft-Liner and Visco-Gel as immersion time changes (P < .05). 3. In case of group L (less), higher mean surface roughness value of the stone model with statistical significance was observed compared to that of R (recommended) and M (more) group as immersion time changes (P < .05).
Conclusion
We may conclude that as the retention period of time in oral cavity influences surface roughness of the stone model the most and as the kind of tissue conditioner and its P/L ratio may influence also, clinician should well understand the optimal retention period in oral cavity and choose the right tissue conditioner for the functional impression, thus making the functional impression with tissue conditioner usefully.
Go to : 
REFERENCES
1.Bergman B., Carlsson GE. Clinical long-term study of complete denture wearers. J Prosthet Dent. 1985. 53:56–61.

2.Lamine GA. The retention of complete dentures. J Am Dent Assoc. 1957. 55:502–8.
3.Zarb GA.., Bolender CL. Prosthodontic treatment for edentulous patients. 12th.Mosby;2004. p. 471–480.
5.Chase WW. Tissue conditioning utilizing dynamic adaptive stress. J Prosthet Dent. 1961. 11:804–15.

7.McCarthy JA., Moser JB. Tissue conditioners as functional impression materials. J Oral Rehabil. 1978. 5:357–64.

8.McCarthy JA., Moser JB. Tissue conditioning and functional impression materials and techniques. Dent Clin North Am. 1984. 28:239–51.
9.Jones DW., Hall GC., Sutow EJ., Langman MF., Robertson KN. Chemical and molecular weight analyses of prostho-dontic soft polymers. J Dent Res. 1991. 70:874–9.

10.Jones DW., Sutow EJ., Hall GC., Tobin WM., Graham BS. Dental soft polymers: plasticizer composite and leachabili-ty. Dent Mater. 1988. 4:1–7.
12.Wilson J. In vitro loss of alcohol from tissue conditioners. Int J Prosthodont. 1992. 5:17–21.
13.Murata H., Kawamura M., Hamada T., Saleh S., Kresnoadi U., Toki K. Dimensional stability and weight changes of tissue conditioners. J Oral Rehabil. 2001. 28:918–23.

14.Graham BS., Jones DW., Sutow EJ. Clinical implications of resilient denture lining material research. Part I: Flexibility and elasticity. J Prosthet Dent. 1989. 62:421–8.

15.Murata H., Hamada T., Djulaeha E., Nikawa H. Rheology of tissue conditioners. J Prosthet Dent. 1998. 79:188–99.

16.Jepson NJ., McCabe JF., Storer R. Age changes in the viscoelasticity of a temporary soft lining material. J Dent. 1993. 21:244–7.
17.Murata H., McCabe JF., Jepson NJ., Hamada T. The influence of immersion solutions on the viscoelasticity of temporary soft lining materials. Dent Mater. 1996. 12:19–24.

18.Pissiotis A., Panagiotouni E., Sofou A., Diakoyanni I., Kaloyannides A. Dimensional stability and reproduction of surface detail of tissue conditioning materials. Eur J Prosthodont Restor Dent. 1994. 3:55–9.
19.Malmstro ¨m HS., Mehta N., Sanchez R., Moss ME. The effect of two different coatings on the surface integrity and softness of a tissue conditioner. J Prosthet Dent. 2002. 87:153–7.
20.Keuter FM., Davidson CL. Surface roughness of dental stone casts from alginate impressions. J Dent. 1986. 14:23–8.

21.Gerrow JD., Schneider RL. A comparison of the compatibility of elastomeric impression materials, type IV dental stones, and liquid media. J Prosthet Dent. 1987. 57:292–8.

22.Reisbick MH., Johnston WM., Rashid RG. Irreversible hydrocolloid and gypsum interactions. Int J Prosthodont. 1997. 10:7–13.
23.Johnson GH., Chellis KD., Gordon GE., Lepe X. Dimensional stability and detail reproduction of irreversible hydrocolloid and elastomeric impressions disinfected by immersion. J Prosthet Dent. 1998. 79:446–53.

24.Jung CM. Atlas of Chairside Relining Technique. Shinhung International, Inc.;2001. p. 49–56.
25.Murata H., Hong G., Li YA., Hamada T. Compatibility of tissue conditioners and dental stones: effect on surface roughness. J Prosthet Dent. 2005. 93:274–81.

26.Wilson HJ., Tomlin HR., Osborne J. The assessment of temporary soft materials used in prosthetics. Br Dent J. 1969. 126:303–6.
27.Murata H., Hamada T., Taguchi N., Shigeto N., Nikawa H. Viscoelastic properties of tissue conditioners—influence of molecular weight of polymer powders and powder/liquid ratio and the clinical implications. J Oral Rehabil. 1998. 25:621–9.
28.Casey DM., Scheer EC. Surface treatment of a temporary soft liner for increased longevity. J Prosthet Dent. 1993. 69:318–24.

29.Gardner LK., Parr GR. Extending the longevity of temporary soft liners with a mono-poly coating. J Prosthet Dent. 1988. 59:71–2.

30.Dominguez NE., Thomas CJ., Gerzina TM. Tissue conditioners protected by a poly(methyl methacrylate) coating. Int J Prosthodont. 1996. 9:137–41.
31.Gronet PM., Driscoll CF., Hondrum SO. Resiliency of surface-sealed temporary soft denture liners. J Prosthet Dent. 1997. 77:370–4.

32.Corwin JO., Saunders TR. Temporary soft liners: a modified curing technique to extend liner longevity. J Prosthet Dent. 1992. 68:714–5.

33.Gerrard WA., Winter PJ. Evaluation of toothpastes by their ability to assist rehardening of enamel in vitro. Caries Res. 1986. 20:209–16.
Go to : 
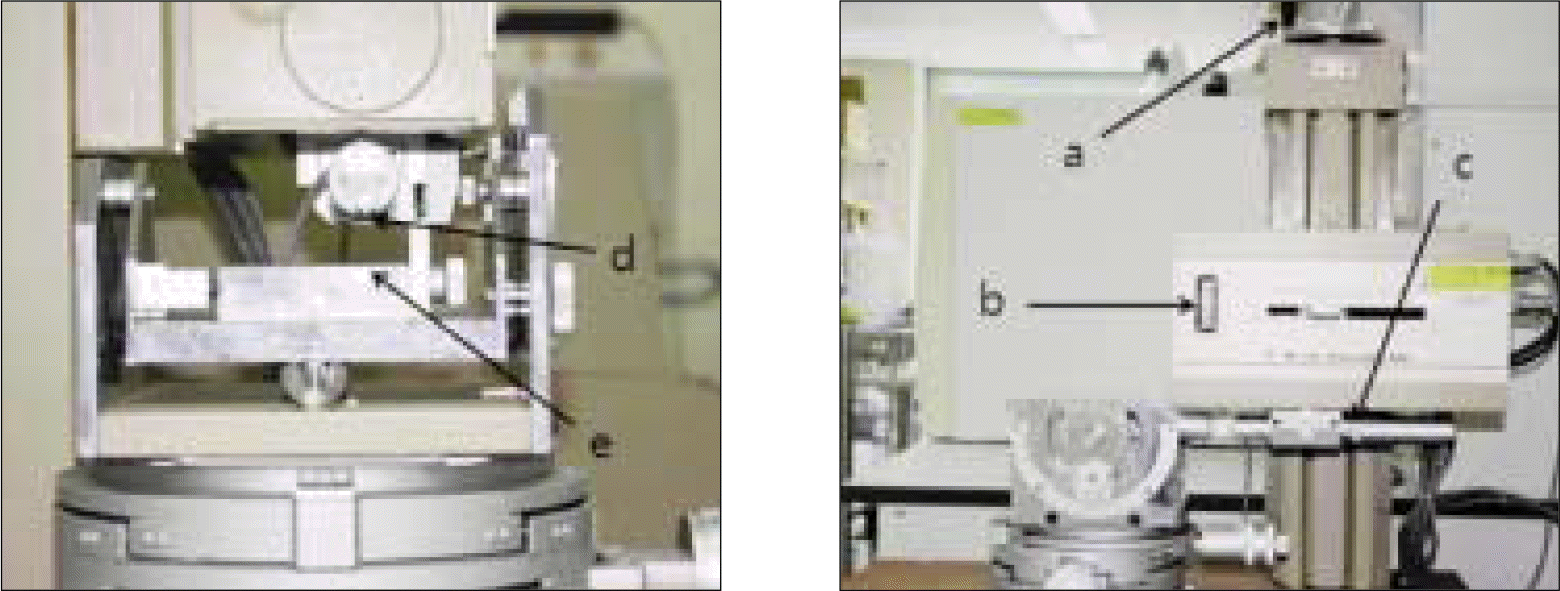 | Fig. 1.Profilometer (a. vertical movement handle, b. set meter, c. rolling leg, d. stylus, e. fixation jig) |
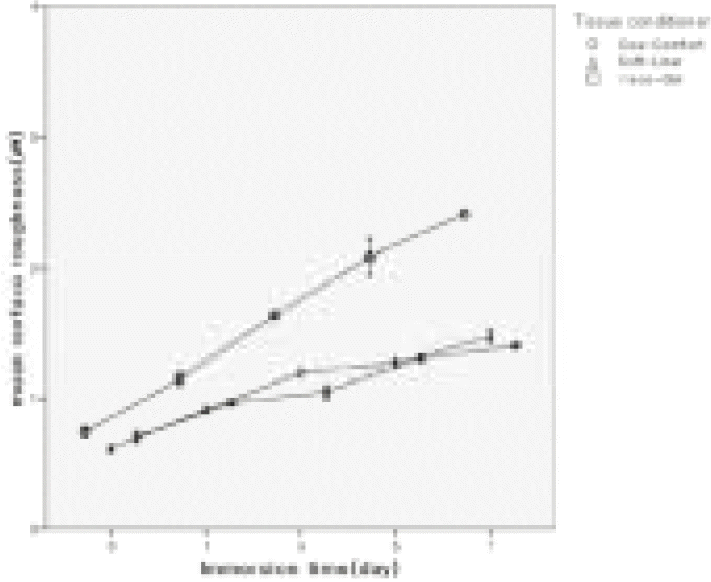 | Fig. 2.Comparison of mean surface roughness by tissue conditioner types at recommended P/L ratio. |
Table I.
Tissue conditioners in this study
Table II.
Composition of artificial saliva
| Distilled water | 2000 ml |
|---|---|
| Gastric mucin | 4.4 g |
| NaCl | 0.762 g |
| CaCl2∙2H2O | 0.426 g |
| KH2PO4 | 1.476 g |
| KCl | 2.228 g |
| pH | 6.8 |
Table III.
Powder/liquid ratio of the experiment group
Table VI.
Results of three-way ANOVA for surface roughness (Ra) of dental stone casts made from tissue conditioners
Table VII.
Results of analysis through Bonferroni method at the α = 0.05 for mean surface roughness by tissue conditioner types at Recommended P/L ratio
| COE-COMFORTTM | Visco-Gel | SOFT-LINER | |
|---|---|---|---|
| COE-COMFORTTM | ∙ | + | + |
| Visco-Gel | + | ∙ | - |
| SOFT-LINER | + | - | ∙ |
Table VIII.
Results of analysis through Bonferroni method at the α = 0.05 for mean surface roughness by tissue conditioner types at More P/L ratio
| COE-COMFORTTM | Visco-Gel | SOFT-LINER | |
|---|---|---|---|
| COE-COMFORTTM | ∙ | + | + |
| Visco-Gel | + | ∙ | - |
| SOFT-LINER | + | - | ∙ |
Table IX.
Results of analysis through Bonferroni method at the α = 0.05 for mean surface roughness by tissue conditioner types at Less P/L ratio
| COE-COMFORTTM | Visco-Gel | SOFT-LINER | |
|---|---|---|---|
| COE-COMFORTTM | ∙ | + | + |
| Visco-Gel | + | ∙ | - |
| SOFT-LINER | + | - | ∙ |
Table X.
Results of analysis through Bonferroni method at the α = 0.05 for mean surface roughness by P/L ratios at Coe-Comfort
| M | R | L | |
|---|---|---|---|
| M | ∙ | - | + |
| R | - | ∙ | + |
| L | + | + | ∙ |


 PDF
PDF ePub
ePub Citation
 Print
Print


 XML Download