Journal List > J Korean Acad Prosthodont > v.47(1) > 1034565

Lee, Lee, and Shin: Evaluation of shade guide using digital shade analysis system

Abstract

Statement of problem

There are two methods of color choice for the esthetic restoration. One is visual shade matching which draws a comparison between shade guide and teeth in dentist's own eye and the other is using a digital shade analysis system recently introduced. Although the visual shade matching has a lot of problems, decision of color by this visual shade matching and the ways of expression for the decided color are still applicable to clinical dentistry.

Purpose

This study is designed to investigate shade guides used in the dental clinics and laboratories have the same value using ShadeEye-NCC® dental chroma meter (Shofu Inc., Kyoto, Japan) using shade guide are evaluated.

Material and methods

At the first experiment, eight Vita Lumin Vacuum shade guides (Vident Inc., California, USA) were collected from the dental clinics. A1 and B1 shade tabs are chosen and the colors are analyzed five times each in both tooth and porcelain modes by digital shade analysis system, ShadeEye-NCC®. In the second experiment, twelve Vita shade guides using practically in the dental clinics and laboratories were collected and also A1 and B1 shade tabs are chosen and the colors of A1 and B1 are analyzed one time each in both tooth and porcelain modes by ShadeEye-NCC®.

Results and conclusion

There were significant differences among eight shade guides in terms of shade (chroma), value and hue in both of A1 and B1 (P < .05). Shade guides using in present both dental clinics and laboratories did not show significant differences, except A1 in the porcelain mode, it showed significant differences (P < .05) in the shade even though the shade tab has the same name. (J Korean Acad Prosthodont 2009;47:1-11)

REFERENCES

1.Miller L. Organizing color in dentistry. J Am Dent Assoc. 1987. 26E–40E.
crossref
2.Ryu SY., Lim JH., Cho IH. A study on the color stability of porcelain for porcelain fused to metal crown. J Korean Acad Prosthodont. 2000. 38:73–84.
3.van der Burgt TP., ten Bosch JJ., Borsboom PC., Kortsmit WJ. A comparison of new and conventional methods for quantification of tooth color. J Prosthet Dent. 1990. 63:155–62.
crossref
4.McPhee ER. Light and color in dentistry. Part I-Nature and perception. J Mich Dent Assoc. 1978. 60:565–72.
5.Miller LL. Shade selection. J Esthet Dent. 1994. 6:47–60.
6.Kim HE., Cho IH., Lim JH. Shade analysis of anterior teeth using digtal shade analysis system. J Korean Acad Prosthodont. 2003. 41:565–81.
7.Hasegawa A., Ikeda I., Kawaguchi S. Color and translucency of in vivo natural central incisors. J Prosthet Dent. 2000. 83:418–23.
crossref
8.Preston JD. Current status of shade selection and color matching. Quintessence Int. 1985. 16:47–58.
9.Sproull RC. Color matching in dentistry. II. Practical applications of the organization of color. J Prosthet Dent. 1973. 29:556–66.
10.Judd DB., Wyszecki G. Color in business science and industry. 3rd ed.New York: John Wiley;1975. p. 5–90.
11.Brodbelt RH., O'Brien WJ., Fan PL., Frazer-Dib JG., Yu R. Translucency of human dental enamel. J Dent Res. 1981. 60:1749–53.
crossref
12.Hunter RS. The measurement of appearance. New York: John Wiley;1975. p. 3–74.
crossref
13.Johnston WM., O'Brien WJ. Color analysis of dental modifying porcelains. J Dent Res. 1982. 61:484–8.
crossref
14.Wyszecki G., Stiles WS. Color science: concepts and methods, quantitative data and formulae. New York: John Wiley;1975. p. 83–173.
15.Preston JD., Bergen SF. Color science and dental art. St. Louis: Mosby;1980. p. 3.
16.Sproull RC. Color matching in dentistry. I. The three-dimensional nature of color. J Prosthet Dent. 1973. 29:416–24.
17.Jorgenson MW., Goodkind RJ. Spectrophotometric study of five porcelain shades relative to the dimensions of color, porcelain thickness, and repeated firings. J Prosthet Dent. 1979. 42:96–105.
crossref
18.Seghi RR., Johnston WM., O'Brien WJ. Spectrophotometric analysis of color differences between porcelain systems. J Prosthet Dent. 1986. 56:35–40.
crossref
19.Knispel G. Factors affecting the process of color matching restorative materials to natural teeth. Quintessence Int. 1991. 22:525–31.
20.Barghi N. Goldberg. Porcelain shade stability after repeated firing. J Prosthet Dent. 1977. 37:173–5.
21.Sorensen JA., Torres TJ. Improved color matching of metal-ceramic restorations. Part I: A systematic method for shade determination. J Prosthet Dent. 1987. 58:133–9.
crossref
22.Sproull RC. Color matching in dentistry. 3. Color control. J Prosthet Dent. 1974. 31:146–54.
23.Hall NR. Tooth colour selection: the application of colour science to dental colour matching. Aust Prosthodont J. 1991. 5:41–6.
24.Marcucci B. A shade selection technique. J Prosthet Dent. 2003. 89:518–21.
crossref
25.Muia PJ. "customized tooth color guide", cited from Preston JD: Perspecives ion dental ceramics,. Quintessence Publishing Co., Inc.;1988.
26.Preston JD., Bergen SF. Color science and dental art. St. Louis: Mosby;1980. p. 6.
27.Barghi N., Richardson JT. A study of various factors influencing shade of bonded porcelain. J Prosthet Dent. 1978. 39:282–4.
crossref
28.Barghi N., Pedrero JA., Bosch RR. Effects of batch variation on shade of dental porcelain. J Prosthet Dent. 1985. 54:625–7.
29.Cernavin I. Effects of chlorine-containing disinfecting compounds on shade guides made of acrylic resin. J Prosthet Dent. 1996. 75:574.
crossref
30.Sykora O. Fabrication of a posterior shade guide for removable partial dentures. J Prosthet Dent. 1983. 50:287–8.
crossref
31.Bell AM., Kurzeja R., Gamberg MG. Ceramometal crowns and bridges. Focus on failures. Dent Clin North Am. 1985. 29:763–78.
32.O'Brien WJ., Boenke KM., Groh CL. Coverage errors of two shade guides. Int J Prosthodont. 1991. 4:45–50.
33.Miller LL. Shade matching. J Esthet Dent. 1993. 5:143–53.
crossref
34.Chu SJ. Color. In: Gurel G (ed). The Science and Art of Porcelain Laminate Veneers. Chicago: Quintessence;2003. p. 158–206.
35.Chu SJ., Devigus A., Mieleszko A. Fundamentals of color: shade matching and communication in esthetic dentistry. Quintessence. 2004. 78–9.
36.Asano S., Yamamoto M. Optimal tooth shade verification technique. Quintessence Int. 2002. 5:30–57.
37.Kim LK., Cho IH., Shin SY. The reproductibity of various porcelain color selection systems using spectrophotometry. J Korean Acad Prosthodont. 2004. 42:544–55.

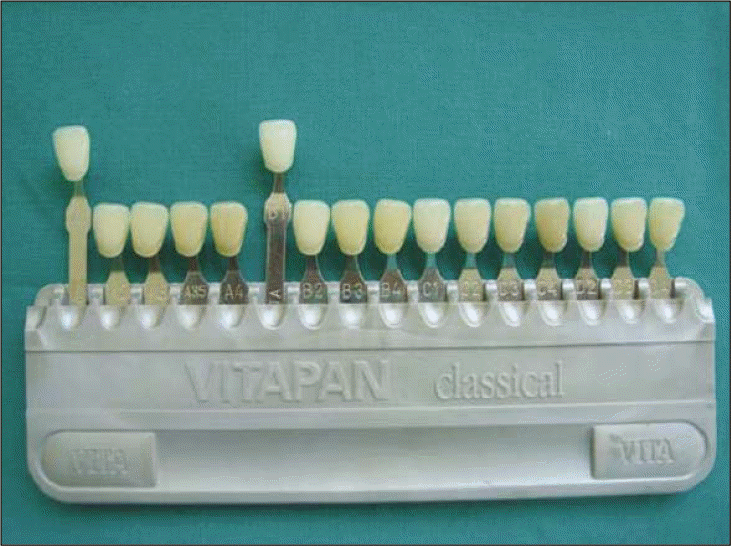
Fig. 1.
A1 and B1 shade tabs of Vita Lumin vacuum shade guide (Vident Inc., California, USA).
jkap-47-1f1.tif
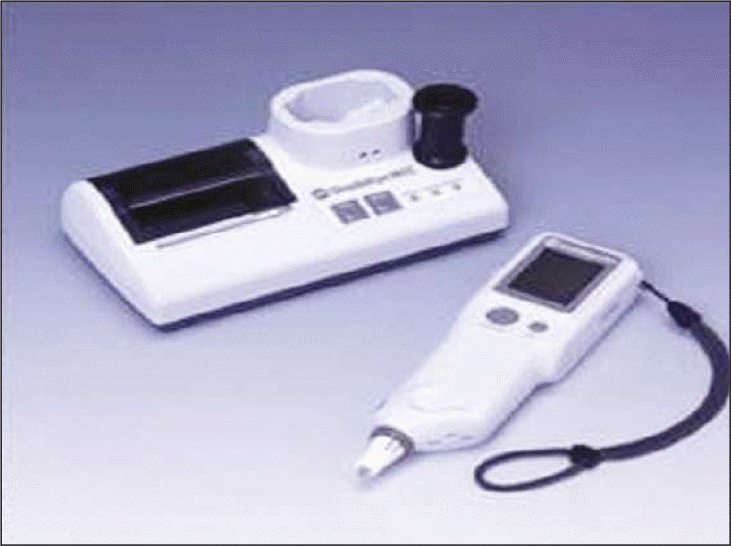
Fig. 2.
ShadeEye-NCC® dental chroma meter (Shofu Inc., Koyto, Japan).
jkap-47-1f2.tif
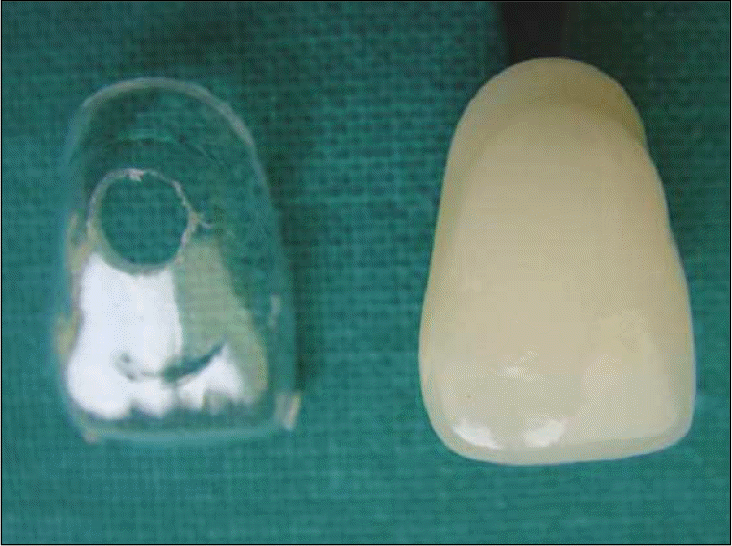
Fig. 3.
Plastic cap and shade tab.
jkap-47-1f3.tif
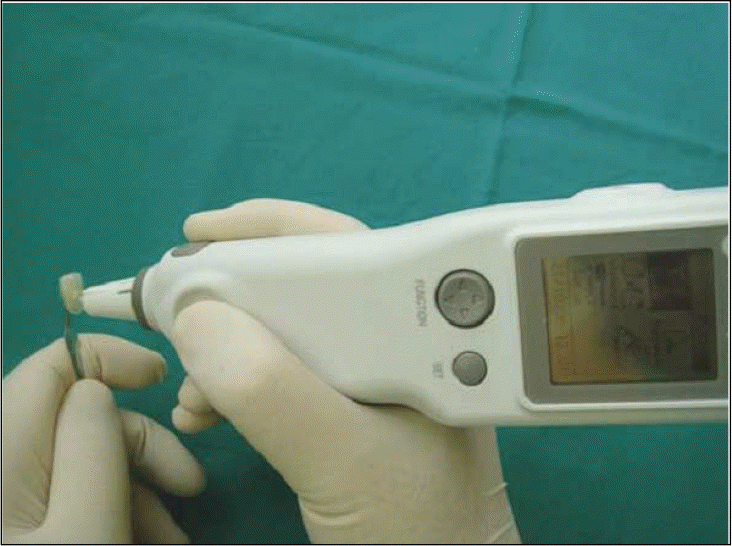
Fig. 4.
Measuring process.
jkap-47-1f4.tif
Table I.
Results of shade analysis on Experiment 1
vita shade mode source time
1 2 3 4 5
S V H S V H S V H S V H S V H
A1 tooth 1 1.5 ± 0 R2 1.5 ± 0 R2 1.5 ± 0 R2 1.5 ± ± 0 R2 1.5 ± ± 0 R2
2 1.5 ± 0 R2 1.5 ± 0 R2 1.5 ± 0 R2 1.5 ± ± 0 R2 1.5 ± ± 0 R2
3 1.5 1 R2 1.5 1 R2 1.5 1 R2 1.5 1 R2 1.5 1 R2
4 2 ± 0 R2 2 ± 0 R2 2 ± 0 R2 2 ± ± 0 R2 2 ± ± 0 R2
5 1.5 1 R1 1.5 1 R1 1.5 1 R1 1.5 1 R1 1.5 1 R1
6 1.5 ± 0 R1 1.5 1 R2 2 ± 0 STD 2 -1 R1 1.5 ± ± 0 R1
7 1.5 1 R1 1 ± 0 R1 1.5 1 R1 1.5 ± ± 0 R1 1.5 ± ± 0 R1
8 2 -1 R2 2 -1 R3 2 -1 R3 2 -1 R3 2 -1 R3
porcelain 1 1.5 -1 R2 1.5 -1 R2 1.5 -1 R2 1.5 -1 R2 1.5 -1 R2
2 1.5 -1 R2 1.5 -1 R2 1.5 -1 R2 1.5 -1 R2 1.5 -1 R2
3 1.5 -2 R1 1.5 -2 R1 1.5 -2 R1 1.5 -2 R1 1.5 -2 R1
4 1.5 -1 R1 1.5 -1 R1 1.5 -1 R1 1.5 -1 R1 1.5 -1 R1
5 1 -1 Y1 1.5 -1 Y1 1.5 -1 Y1 1 -1 Y1 1 -1 Y1
6 1.5 -1 STD 1.5 -1 Y1 1.5 -1 Y1 1.5 -1 Y1 1.5 -1 Y1
7 1 -1 STD 1 -1 STD 1 -1 STD 1 -1 STD 1 -1 STD
8 1.5 -2 R2 1.5 -2 R3 1.5 -2 R3 1.5 -2 R3 1.5 -2 R3
B1 tooth 1 1.5 ± 0 R2 1.5 ±0 R2 1.5 ± 0 R2 1.5 ± ± 0 R2 1.5 ± ± 0 R2
2 1.5 ± 0 R2 1.5 ± 0 R2 1.5 ± 0 R2 1.5 ± ± 0 R2 1.5 ± ± 0 R2
3 1.5 1 R2 1.5 1 R2 1.5 1 R2 1.5 1 R2 1.5 1 R2
4 2 ± 0 R2 2 ± 0 R2 2 ± 0 R2 2 ± ± 0 R2 2 ± ± 0 R3
5 1.5 1 R1 1.5 1 R1 1.5 1 R1 1.5 1 R1 1.5 1 R1
6 1.5 ± 0 R1 1.5 1 R2 2 ± 0 STD 2 -1 R1 1.5 ± ± 0 R1
7 1.5 1 R1 1 ± 0 R1 1.5 1 R1 1.5 ± ± 0 R1 1.5 ± ± 0 R1
8 2 -1 R2 2 -1 R3 2 -1 R3 2 -1 R3 2 -1 R3
porcelain 1 1.5 -1 R2 1.5 -1 R2 1.5 -1 R2 1.5 -1 R2 1.5 -1 R2
2 1.5 -1 R2 1.5 -1 R2 1.5 -1 R2 1.5 -1 R2 1.5 -1 R2
3 1.5 -2 R1 1.5 -2 R1 1.5 -2 R1 1.5 -2 R1 1.5 -2 R1
4 1.5 -1 R1 1.5 -1 R1 1.5 -1 R1 1.5 -1 R1 1.5 -1 R1
5 1 -1 Y1 1.5 -1 Y1 1.5 -1 Y1 1 -1 Y1 1 -1 Y1
6 1.5 -1 STD 1.5 -2 Y1 1.5 -2 Y1 1.5 -2 Y1 1.5 -2 Y1
7 1 -1 STD 1 -1 STD 1 -1 STD 1 -1 STD 1 -1 STD
8 1.5 -2 R2 1.5 -2 R3 1.5 -2 R3 1.5 -2 R3 1.5 -2 R3

S = shade, V = value, H = hue

Table II.
Results of shade analysis on Experiment 2
A1 source tooth mode porcelain mode B1 source tooth mode porcelain mode
S V H S V H S V H S V H
1 1.5 ± 0 R2 1 -2 R1 1 1.5 -1 R2 1 -2 R2
2 1.5 ± 0 R2 1.5 -2 R1 2 1.5 ± 0 R1 1 -2 STD
3 1 ± 0 R1 1 -1 STD 3 1.5 -1 R2 1.5 -2 R2
4 1.5 ± 0 R2 1 -1 R1 4 1.5 ± 0 R2 1 -2 R1
5 1.5 ± 0 R1 1 -1 R1 5 1.5 -1 R2 1 -2 R1
6 1.5 ± 0 R2 1 -1 R1 6 1.5 -1 R3 1.5 -2 R2
7 1.5 ± 0 R2 1 -2 R1 7 1.5 -1 R2 1 -2 R2
8 1.5 ± 0 R1 1 -2 STD 8 1.5 -2 R2 1 -3 R2
9 2 -1 R2 1.5 -2 R2 9 1.5 -2 R2 1.5 -3 R2
10 1.5 1 R1 1 -1 Y1 10 1.5 -1 R3 1 -2 R2
11 2 -1 R2 1.5 -2 R2 11 2 -2 R2 1.5 -2 R2
12 1.5 2 R2 1 -1 R2 12 1.5 -2 R2 1 -2 R2
13 1.5 1 R2 1 -2 STD 13 1.5 -1 R2 1 -2 R3
14 1.5 -1 R1 1.5 -2 STD 14 1.5 -1 R1 1 -2 R1
15 1.5 ± 0 R2 1.5 -1 R2 15 1.5 -1 R2 1.5 -2 R2
16 1.5 ± 0 R2 1 -1 R1 16 1.5 -1 R3 1 -2 R2
17 1.5 ± 0 R2 1.5 -2 STD 17 1.5 -1 R2 1 -2 R1
18 2 ± 0 R2 1.5 -2 R1 18 2 -1 R2 1.5 -2 R1
19 2 -1 R2 1.5 -2 R1 19 1.5 -1 R2 1.5 -2 R2
20 2 ± 0 R2 1.5 -2 R2 20 2 -1 R3 1.5 -2 R2
21 1.5 ± 0 R1 1.5 -1 Y1 21 1.5 -1 R2 1 -2 R2
22 1.5 -1 R1 1.5 -2 R1 22 1.5 -1 R2 1 -2 R1
23 2 -1 R2 1.5 -2 R2 23 1.5 -1 R2 1 -2 R1
24 1 ± 0 R1 1 -1 STD 24 1.5 ± 0 R1 1 -2 STD

S = shade, V = value, H = hue source 1 - 12 = dental clinic, 13 - 24= dental lab.

Table III.
Results of Chi-Square Tests for shade
Shade guide number Mode Value df Asymp.Sig.(2-sided)
A1 Tooth mode Pearson Chi-Square 66.94 21 .00
Likelihood Ratio 64.95 21 .00
Linear-by-Linear .77 1 .38
Association N of Valid Cases 40
Porcelain mode Pearson Chi-Square 140.20 28 .00
Likelihood Ratio 114.16 28 .00
Linear-by-Linear 2.36 1 .12
Association N of Valid Cases 40
B1 Tooth mode Pearson Chi-Square 57.46 14 .00
Likelihood Ratio 62.59 14 .00
Linear-by-Linear 1.02 1 .31
Association N of Valid Cases 40
Porcelain mode Pearson Chi-Square 103.67 21 .00
Likelihood Ratio 93.83 21 .00
Linear-by-Linear 2.15 1 .14
Association N of Valid Cases 40
Table IV.
Results of Chi-Square Tests for value
Shade guide number Mode   Value df Asymp. Sig. (2-sided)
A1 Tooth mode Pearson Chi-Square 63.94 14 .00
Likelihood Ratio 62.82 14 .00
Linear-by-Linear 3.20 1 .07
Association N of Valid Cases 40    
Pearson Chi-Square 36.48 7 .00
Porcelain mode Likelihood Ratio 46.79 7 .00
Linear-by-Linear 5.22 1 .02
Association N of Valid Cases 40    
B1 Tooth mode Pearson Chi-Square 80 14 .00
Likelihood Ratio 77.95 14 .00
Linear-by-Linear .27 1 .61
Association N of Valid Cases 40    
Pearson Chi-Square 18.06 14 .01
Porcelain mode Likelihood Ratio 16.68 14 .02
Linear-by-Linear 1.79 1 .18
Association N of Valid Cases 40    
Table V.
Results of Chi-Square Tests for hue
Shade guide number Mode   Value df Asymp. Sig. (2-sided)
A1 Tooth mode Pearson Chi-Square 41.04 14 .00
Likelihood Ratio 45.76 14 .00
Linear-by-Linear 4.47 1 .03
Association N of Valid Cases 40    
Pearson Chi-Square 32.50 7 .00
Porcelain mode Likelihood Ratio 33.30 7 .00
Linear-by-Linear 5.69 1 .02
Association N of Valid Cases 40    
B1 Tooth mode Pearson Chi-Square 66.07 14 .00
Likelihood Ratio 56.49 14 .00
Linear-by-Linear 1.35 1 .25
Association N of Valid Cases 40    
Pearson Chi-Square 40.00 14 .00
Porcelain mode Likelihood Ratio 52.93 14 .00
Linear-by-Linear 3.10 1 .08
Association N of Valid Cases 40    
Table VI.
Results of Mann-Whitney U test
Shade guide number Mode   Shade Value Hue
A1 Tooth mode Mann-Whitney U 61.00 56.50 72.00
Wilcoxon W 139.00 134.50 150.00
Z -.77 -1.04 .00
Asymp.Sig. (2-tailed) .44 .30 1.00
Exact Sig. [2∗(1-tailed Sig.)] .55 .38 1.00
Porcelain mode Mann-Whitney U 36.00 60.00 59.50
Wilcoxon W 114.00 138.00 137.50
Z -2.40 -.81 -.77
Asymp.Sig. (2-tailed) .016 .42 .44
Exact Sig. .04 .51 .48
[2∗(1-tailed Sig.)]      
B1 Tooth mode Mann-Whitney U 66.00 56.00 67.00
Wilcoxon W 144.00 134.00 145.00
Z -.60 -1.16 -.36
Asymp.Sig. (2-tailed) .55 .25 .72
Exact Sig. [2∗(1-tailed Sig.)] .76 .38 .80
Porcelain mode Mann-Whitney U 72.00 60.00 60.00
Wilcoxon W 150.00 138.00 138.00
Z .00 -1.15 -.79
Asymp.Sig. (2-tailed) 1.00 .15 .43
Exact Sig. 1.00 .51 .51
[2∗(1-tailed Sig.)]      
Table VII.
Results of Wilcoxon Signed Ranks Test for two mode
  shade value hue
Z -5.92 -6.20 -4.90
Asymp. Sig. (2-tailed) .00 .00 .00
TOOLS
Similar articles