

 PDF
PDF ePub
ePub Citation
 Print
Print


Abstract
STATEMENT OF PROBLEM
The application of a simple, clinically applicable noninvasive test to assess implant stability are considered highly desirable. So far there is still a controversy about correlation of various tests and implant stability.
PURPOSE
In order to assess implant stability, the development of a new method is critical. It's possible to assess implant stability by calculating energy and angular momentum during implant installation. The purpose of this study is to evaluate the correlation of energy and implant stability.
MATERIAL AND METHODS
Twenty three implants were installed in two different types of pig bone. Type I bone was retrieved from the distal aspect of the rib, with more cortical bone. Type II bone came from a more proximal region with less cortical components and a higher content of bone marrow and spongeous trabeculae. Insertion torque, removal torque, ISQ values and angular momentum and energy were measured. Pearson Correlation test was done to analyze the relation between RFA, maximum insertion torque, mean insertion torque, bone type, energy and removal torque.
Go to : 
REFERENCES
1.Adell R., Lekholm U., Rockler B., Bra ° nemark PI. A 15-year study of osseointegtated implants in the treatment of the edentulous saw. Int J Oral Surg. 1981. 10:387–416.
2.Albrektsson T., Bra ° nemark PI., Hansson HA., Lindstro ¨m J. Osseointegrated titanium implants: requirements for ensuring a long-lasting, direct bone to implant anchorage in man. Acta Orthop Scand. 1981. 52:155–70.
3.Meredith N. Assessment of implant stability as a prognostic determinanat. Int J Prosthodont. 1998. 11:491–501.
4.Friberg B., Sennerby L., Linden B., Gro ¨ ndahl K., Lekholm U. Stability measurements of one-stage Bra ° nemark implants during healing in mandibles. A clinical resonance frequency analysis study. Int J Oral Maxillofac Surg. 1999. 28:266–72.
5.Meredith N. A review of nondestructive test methods and their application to measure the stability and osseiontegration of bone anchored endosseous implants. Crit Rev Biomed Eng. 1998. 26:275–91.
6.Friberg B. Sennerby L. Meredith N. Lekholm U. A comparison between cutting torque and resonance frequency measurement of maxillary implants: A 20-month clinical study. Int J Oral Maxillofac Surg. 1999. 28:297–303.
7.Meredith N., Book K., Friberg B., Jemt T., Sennerby L. Resonance frequency measurements of implant stability in vivo. A cross-sectional and longitudinal study of resonance frequency measurements on implants in the edentulous and partially dentate maxilla. Clin Oral Implants Res. 1997. 8:226–33.
8.Meredith N., Alleyne D., Cawley P. Quantitative determination of the stability of the implant-tissue interface using resonance frequency analysis. Clin Oral Implants Res. 1996. 7:261–7.

9.Barewal RM., Oates TW., Meredith N., Cochran DL. Resonance frequency analysis of implant stability in vivo on implants with a sandblasted and acid-etched surfaces. Int J Oral Maxillofac Implants. 2003. 18:641–51.
10.O' Sullivan D., Sennerby L., Meredith N. Measurements comparing the initial stability of five designs of dental implant: a human cadaver study. Clin Implant Dent Relat Res. 2000. 2:85–92.
11.da Cunha HA., Francischone CE., Filho HN., de Oliveira RC. A comparison between cutting torque and resonance frequency in the assessment of primary stability and final torque capacity of standard and tiunite single-tooth implants under immediate loading. Int Oral Maxillofac Implants. 2004. 19:578–85.
12.Kim SK., Kwon JY., Heo SJ., Koak JY., Lee JH. Software for measurement of load developed with implant installation. Intellectual property rights 2007-01-199-004156,. 2007.
13.Kim SK., Kwon JY., Heo SJ., Koak JY., Lee JH. Software for measurement of energy absorbed by bone. Intellectual property rights 2007-01-199-004155,. 2007.
14.Sennerby L., Thomsen P., Ericson LE. A morphometric and biomechanic comparison of titanium implants inserted in rabbit cortical and cancellous bone. Int J Oral Maxillofac Implants. 1992. 7:62–71.
15.O' sullivan D., Sennerby L., Meredith N. Influence of implant taper on the primary and second stability of osseointe-grated titanium implants. Clin Oral Impl Res. 2004. 15:474–80.
16.O ¨stman PO., Hellman M., Wendelhag I., Sennerby L. Resonance Frequency Analysis Measurements of Implants at Placement Surgery. Int J Prosthodont. 2006. 19:77–83.
17.Lim SA., Cha JY., Hwang CJ. Insertion torque of orthodontic miniscrews according to changes in shape, diameter, and length. Angle Orthod. 2008. 78:234–40.
18.Walker J. Applied mechanics. London: Hodder and Stoughton;1972. p. 41–2.
19.O' Sullivan D., Sennerby L., Jagger D., Meredith N. A comparison of two methods of enhancing implant primary stability. Clin Implant Dent Relat Res. 2004. 6:48–57.
Go to :
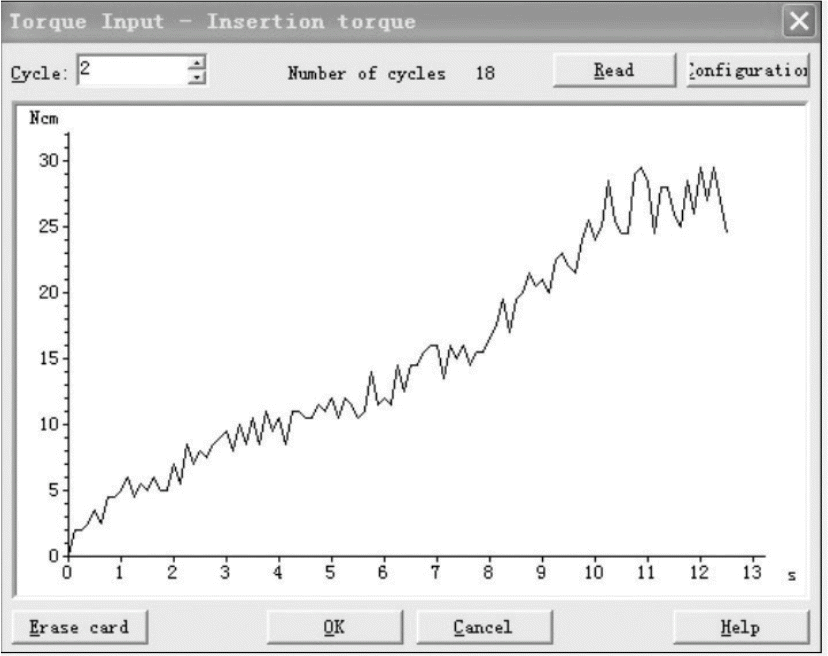
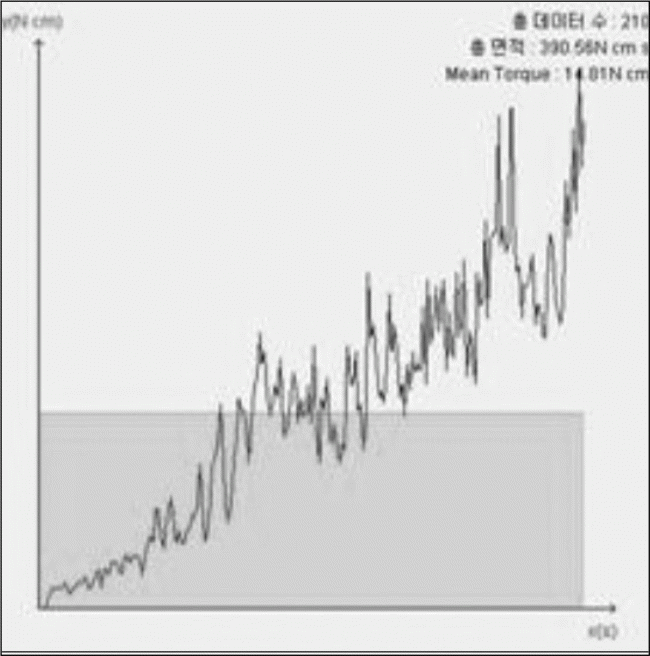
Table I.
Measurement values and definition used in this study
Table II.
Relationship between the removal torque and types of bone
| Type of bone | N | Mean removal torque | Standard deviation |
|---|---|---|---|
| I | 11 | 8.5 | 2.7839 |
| II | 12 | 4.208 | 1.9824 |
Table III.
Correlations between variables
| RFA | Max. IT | Mean IT | Energy | ||
|---|---|---|---|---|---|
| RFA | Pearson Correlation | 1 | .783∗∗ | .795∗∗ | .789∗∗ |
| Sig. (2-tailed) | .000 | .000 | .000 | ||
| N | 23 | 23 | 23 | 23 | |
| Max.IT | Pearson Correlation | .783∗∗ | 1 | .985∗∗ | .986∗∗ |
| Sig. (2-tailed) | .000 | .000 | .000 | ||
| N | 23 | 23 | 23 | 23 | |
| Mean IT | Pearson Correlation | .795∗∗ | .985∗∗ | 1 | .989∗∗ |
| Sig. (2-tailed) | .000 | .000 | .000 | ||
| N | 23 | 23 | 23 | 23 | |
| Energy | Pearson Correlation | .789∗∗ | .986∗∗ | .989∗∗ | 1 |
| Sig. (2-tailed) | .000 | .000 | .000 | ||
| N | 23 | 23 | 23 | 23 |
 XML Download