

 PDF
PDF ePub
ePub Citation
 Print
Print


Abstract
STATEMENT OF PROBLEM
The improvement in oral function and comfort from the dental implant appears to depend on the particular type of implant support used with the denture. The number and positioning of implants have an influence on the force transfer and subsequent stress distribution around implants. Nevertheless, a quantitative comparison has not been made between the types of implant prosthesis used with different materials compared to conventional complete denture.
PURPOSE
The objective of this study is to assess the masticatory performance, bite force and impact of two different type of implant supported prostheses on oral health-related quality of life compared to conventional complete denture with GOHAI, validated oral-specific health status measures, the sieving method, and the Prescale Dental System.
MATERIAL AND METHODS
From the years 1999 to 2006, a total of 30 completely edentulous patients in a single arch were selected from the Yonsei University Dental Hospital, Department of Prosthodontics and Implant Clinic in Seoul, S. Korea. Patients were divided into 3 groups of 10 each. Group HR was restored with fixed-detachable hybrid prostheses with resin teeth. Group FP had fixed dentures with porcelain teeth while Group CD had a complete denture. The masticatory performance was compared between 3 groups.
RESULTS
The results showed a significant improvement in oral health-related quality of life with dental implants compared to a conventional denture in GOHAI comparison. Overall, implant prostheses showed a higher masticatory performance (S50) and maximum bite force compared with conventional dentures (P < .05) but no differences between different implant supported prostheses (P > .05).
Go to : 
REFERENCES
1.Lundqvist S., Carlsson GE. Maxillary fixed prostheses on osseointegrated dental implants. J Prosthet Dent. 1983. 50:262–70.

2.Zarb GA., Symington JM. Osseointegrated dental implants: preliminary report on a replication study. J Prosthet Dent. 1983. 50:271–6.
3.Hobkirk JA., Havthoulas TK. The influence of mandibular deformation, implant numbers, and loading position on detected forces in abutments supporting fixed implant superstructures. J Prosthet Dent. 1998. 80:169–74.
4.Korioth TW., Chew CB., Chung DH. Effect of implant number on transverse bending moments during simulated unilateral loading of mandibular fixed-detachable prostheses. J Oral Implantol. 1998. 24:93–6.
5.Duyck J., Van Oosterwyck H., Vander Sloten J., De Cooman M., Puers R., Naert I. Magnitude and distribution of occlusal forces on oral implants supporting fixed prostheses: an in vivo study. Clin Oral Implants Res. 2000. 11:465–75.
6.Osier JF. Biomechanical load analysis of cantilevered implant systems. J Oral Implantol. 1991. 17:40–7.
7.Skalak R. Biomechanical considerations in osseointegrated prostheses. J Prosthet Dent. 1983. 49:843–8.
8.Zarb GA., Zarb FL. Tissue-integrated prostheses: osseointe-gration in clinical dentistry. Chicago: Quintessence;1985. p. 241–82.
9.Stegaroiu R., Kusakari H., Nishiyama S., Miyakawa O. Influence of prosthesis material on stress distribution in bone and implant: a 3-dimensional finite element analysis. Int J Oral Maxillofac Implants. 1998. 13:781–90.
10.Zarb GA., Schmitt A. The longitudinal clinical effectiveness of osseointegrated dental implants: the Toronto study. Part III: Problems and complications encountered. J Prosthet Dent. 1990. 64:185–94.
11.Walton JN., MacEntee MI. Problems with prostheses on implant; retrospective study. J Prosthet Dent. 1994. 71:283–8.
12.Brunski JB., Puleo DA., Nanci A. Biomaterials and biomechanics of oral and maxillofacial implants: current status and future developments. Int J Oral Maxillofac Implants. 2000. 15:15–46.
13.Kapur KK., Soman S. The effect of denture factors on masticatory performance. II. Influence of the polished surface contour of denture base. J Prosthet Dent. 1965. 15:231–40.
14.Atchison KA., Dolan TA. Development of the Geriatric Oral Health Assessment Index. J Dent Educ. 1990. 54:680–7.
15.van der Bilt A., van der Glas HW., Mowlana F., Heath MR. A comparison between sieving and optical scanning for the determination of particle size distributions obtained by mastication in man. Arch Oral Biol. 1993. 38:159–62.
16.Goll GE. Production of accurately fitting full-arch implant frameworks: Part I-Clinical procedures. J Prosthet Dent. 1991. 66:377–84.
17.Kan JY., Rungcharassaeng K., Bohsali K., Goodacre CJ., Lang BR. Clinical methods for evaluating implant framework fit. J Prosthet Dent. 1999. 81:7–13.
18.Wong MC., Liu JK., Lo EC. Translation and validation of the Chinese version of GOHAI. J Public Health Dent. 2002. 62:78–83.
19.Naito M., Suzukamo Y., Nakayama T., Hamajima N., Fukuhara S. Linguistic adaptation and validation of the General Oral Health Assessment Index (GOHAI) in an elderly Japanese population. J Public Health Dent. 2006. 66:273–5.
20.Tubert-Jeannin S., Riordan PJ., Morel-Papernot A., Porcheray S., Saby-Collet S. Validation of an oral health quality of life index (GOHAI) in France. Community Dent Oral Epidemiol. 2003. 31:275–84.
21.Ha ¨ gglin C., Berggren U., Lundgren J. A Swedish version of the GOHAI index. Psychometric properties and validation. Swed Dent J. 2005. 29:113–24.
22.Edlund J., Lamm CJ. Masticatory efficiency. J Oral Rehabil. 1980. 7:123–30.
23.Lucas PW., Luke DA. Methods for analysing the breakdown of food in human mastication. Arch Oral Biol. 1983. 28:813–9.
24.Olthoff LW., van der Bilt A., Bosman F., Kleizen HH. Distribution of particle sizes in food comminuted by human mastication. Arch Oral Biol. 1984. 29:899–903.
25.Miura H., Watanabe S., Isogai E., Miura K. Comparison of maximum bite force and dentate status between healthy and frail elderly persons. J Oral Rehabil. 2001. 28:592–5.
Go to :
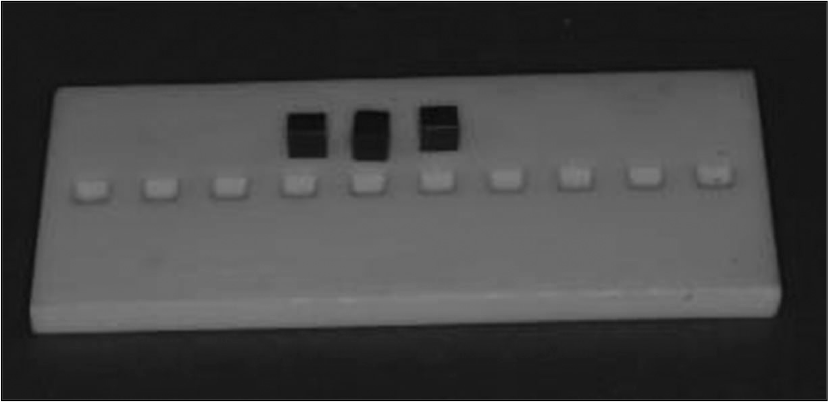
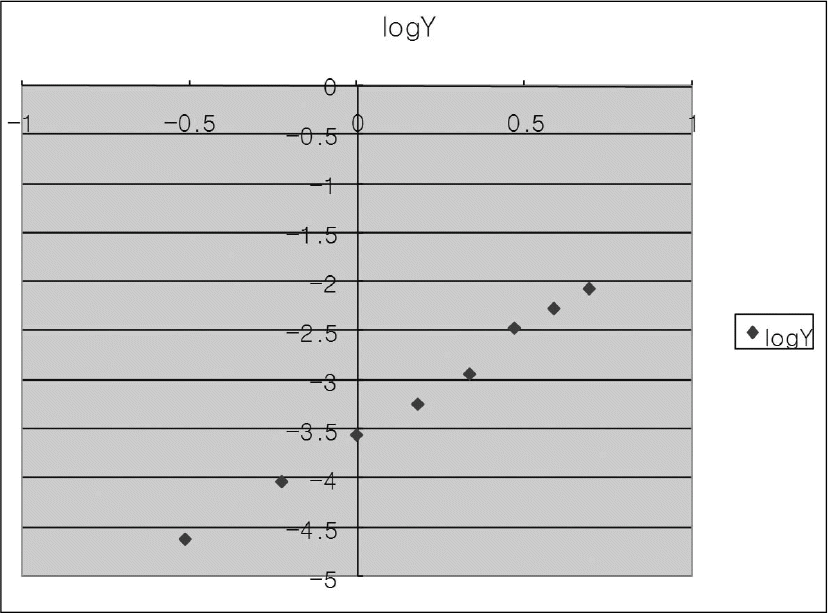
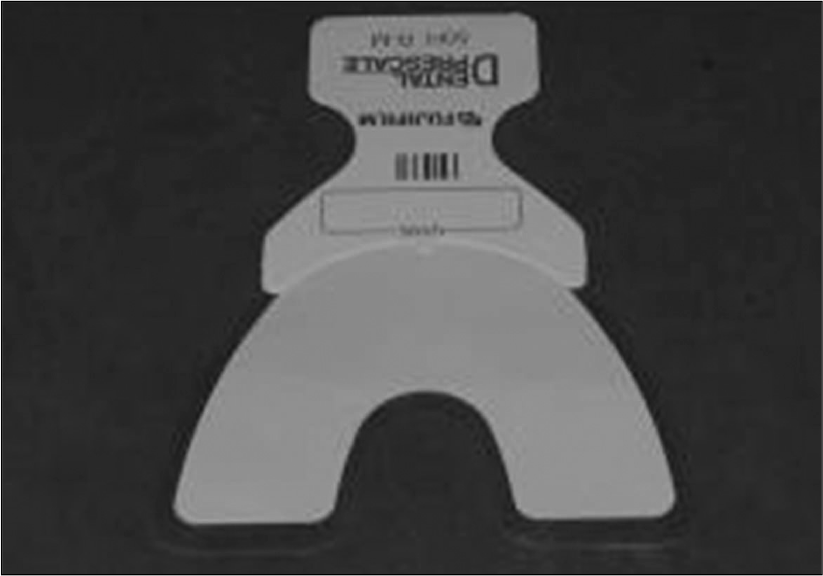
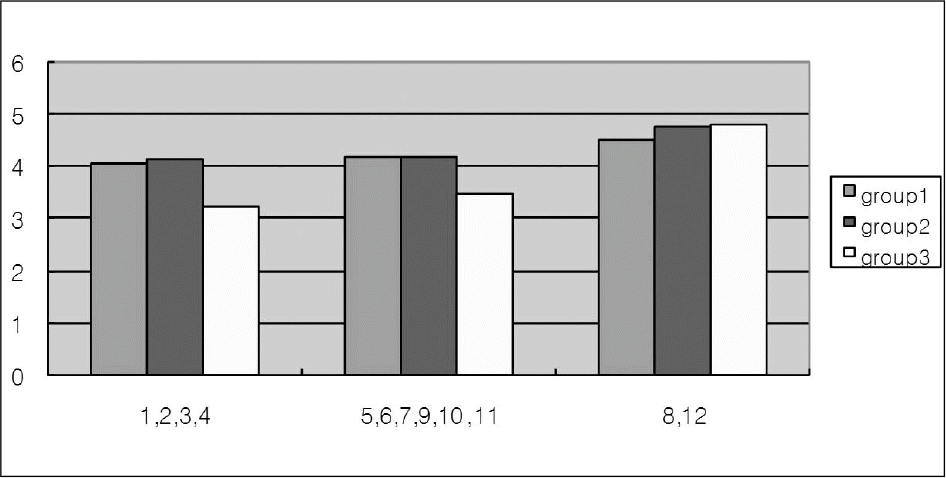
Table I.
Summary of patient data
Table II.
The treatment of data from 1 food sample
Table III.
Comparison of frequency score of individual GOHAI Items
Table IV.
Multiple comparison by LSD method in physical function items (1, 2, 3 and 4)
| Two group comparison | Difference between means | 95% confidence limits |
|---|---|---|
| HR to FP | 0.1000 | (-0.6613, 0.4613) |
| FP to CD | 0.7250 | (0.3637, 1.4863)∗∗∗ |
| HR to CD | 0.6250 | (-0.2637, 1.3863)∗∗∗ |
Table V.
Multiple comparison by LSD method in psychosocial items (5, 6, 7, 9, 10 and 11)
| Two group comparison | Difference between means | 95% confidence limits |
|---|---|---|
| HR to FP | 0.0000 | (-0.4682, 0.4682) |
| FP to CD | 0.7267 | (0.2486, 1.1849)∗∗∗ |
| HR to CD | 0.7267 | (0.2486, 1.1849)∗∗∗ |
Table VI.
Summary statistics of particle size of each subject on s Groups
Table VII.
Summary statistics of maximum bite force of each subject
 XML Download