Abstract
Statement of problems
In the area of dental care, the institutionalized elderly have placed the most vulnerable state, and we cannot find their subjective need of dental treatment because of the physical and mental disabilities, But we have no basic investigation of their oral health conditions.
Purpose
The aims of the current study were to investigate the oral health status of institutionalized elderly patients who are in the least benefited side of dental service, and to analyze their dental treatment needs.
Material and methods
The survey of the oral status was carried out on 758 institutionalized elderly, and 212 elderly who was more than 65 years old from D dental office, and it was based on the Guidelines of Oral Health Research of year 2000 in Republic of Korea.
Results and conclusion
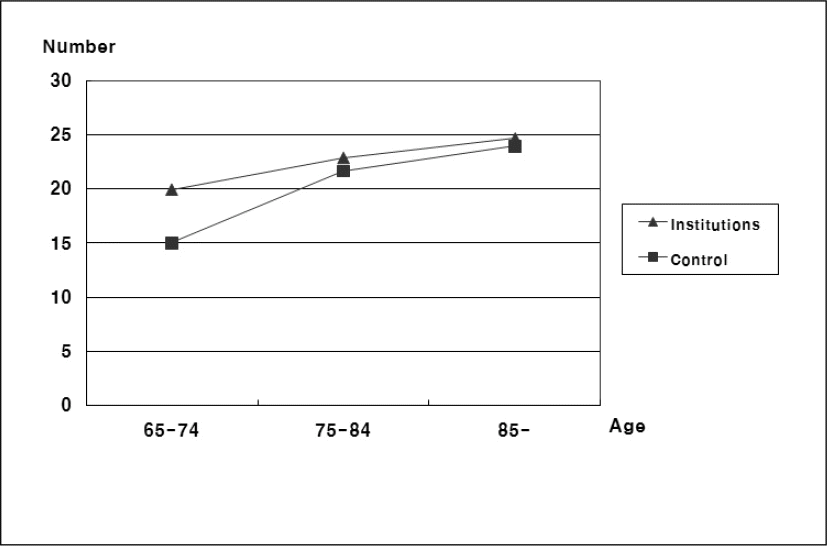
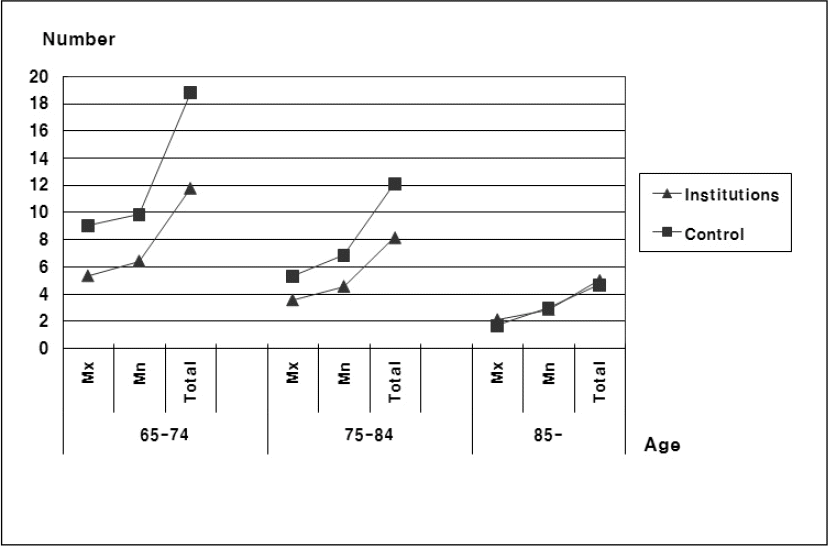
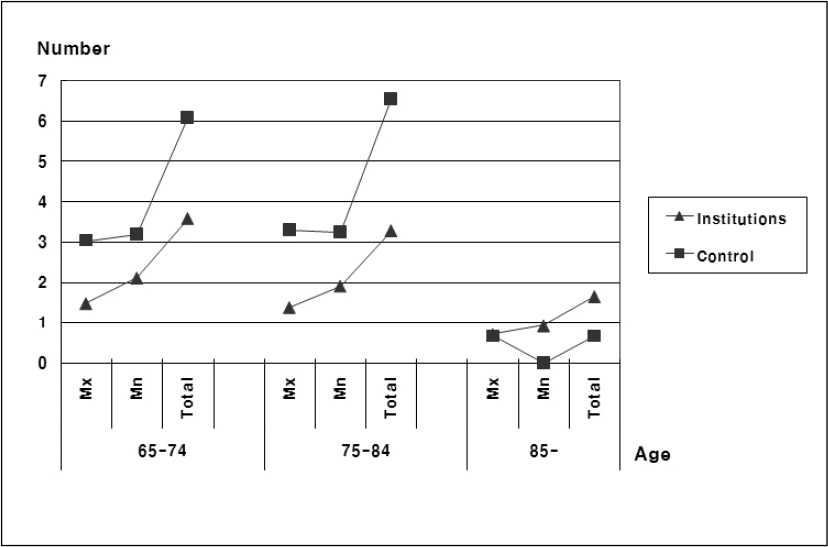
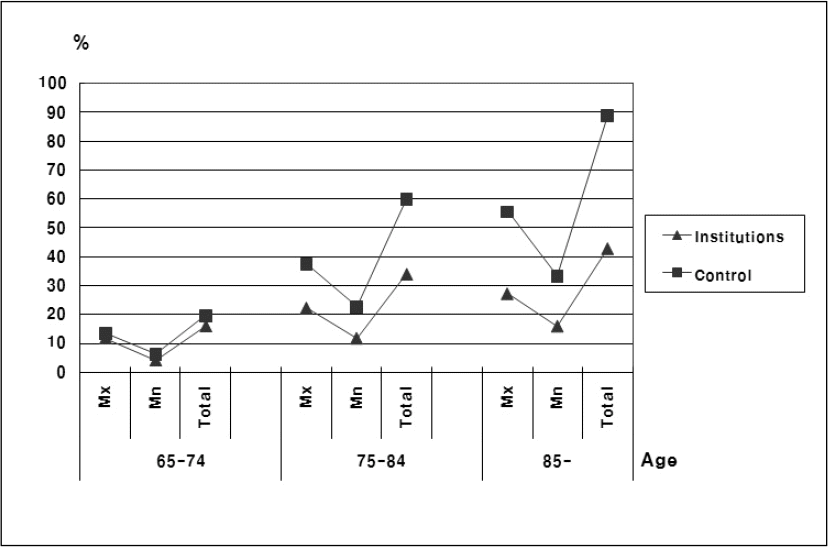
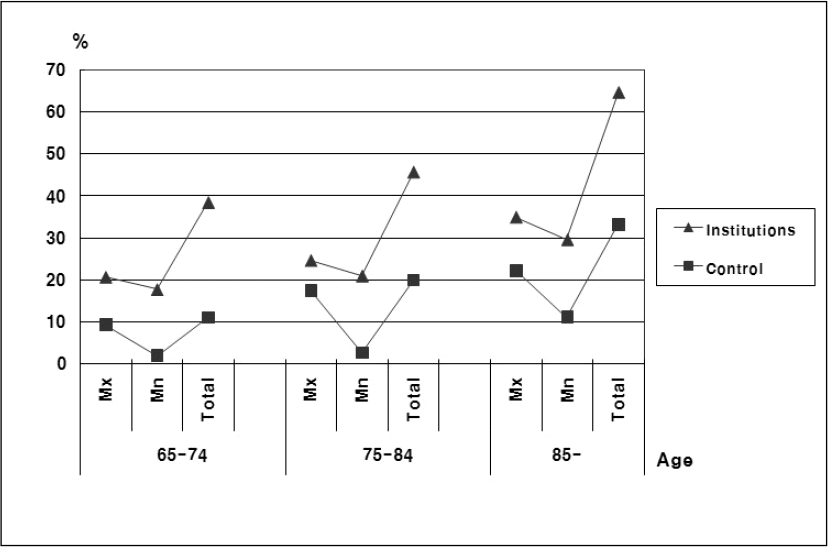
The DMFT index of the institutionalized elderly appeared higher than that of the same ages in control group, and it increased with age. The number of residual teeth of the institutionalized elderly appeared lower than that of the same ages in control group, and it decreased with age (P < .05). The number of fixed partial denture in institutionalized elderly was lower than that of the same ages in control group (P < .05). The percentage wearing removable partial denture was not significant between the elderly in institutions and the control group, and was not different according to age between the two groups. The percentage of institutionalized elderly wearing complete denture appeared lower than that of the same ages in control group, and it increased with age. The percentage of institutionalized elderly needing complete denture was higher than that of control group, and the percentage of elderly needing complete denture on the maxilla was higher than that of the mandible. 16.35% of the institutionalized elderly was living without denture in spite of their fully edentulous state. The need for complete denture increased rapidly with age. The number of valued teeth and dental prostheses in shortened dental arch concept and number of occluding pairs of teeth of institutionalized elderly were lower than that of the control group (P < .05). In institutionalized elderly, the number of residual teeth, the number of fixed partial dentures, and the percentage wearing removable partial dentures were higher in the mandible, and the percentage wearing complete dentures was higher in the maxilla (P < .05). The rate of institutionalized elderly needing prosthodontic treatment appeared to be 67.82%, where the number of occluding pairs of teeth was less than 10. When it is difficult to evaluate the subjective need of dental treatment as with the institutionalized elderly, estimation using the number of occluding pairs of teeth can be a useful indicator that can project treatment needs. For the oral health care of institutionalized elderly, it is essential to increase the awareness of nurses and caregivers who take care of them, about the importance of the oral health. Since the average life span and number of residual teeth are increasing gradually, the welfare policy should be changed to implementing regular dental examinations, preservative treatment forms and oral health control of dentulous patients where the traveling-treatment system and visit system are supplemented. And principles should be set that the present denture project of edentulous patients should be done by specialists who'll also be responsible for postmanagement. Through this research of institutionalized elderly, the oral health status which is worsened by aging could be confirmed. And the interest and positive participation of dental society on the elderly should come first in order to solve the rising treatment needs of the elderly patients. (J Kor Acad Prosthodont 2008;46:455-69).
Go to : 
REFERENCES
1.Korea National Statistical Office. Population estimates by age (1960-2030). p. 31–46. Korea National Statistical Office;Seoul: 2000.
2.Korea National Statistical Office. 2005 Statistics Elderly. p. 1–49. Korea National Statistical Office;Daejeon: 2005.
3.Meyerowitz C. Geriatric dentistry and prevention: research and public policy (reaction paper). Advances in Dental Research. 1991. 5:74.

4.Mulligan R., Navazesh M. Relationship between oral conditions and systemic disease in the elderly. J Dent Res. 1992. 71:31.
5.Scannapicco FA. Role of oral bacteria in respiratory in-fection. J Periodontol. 1999. 70:793–802.
6.Wu T., Trevisan M., Genco RJ., Dorn JP., Falkner KL., Sempos CT. Periodontal disease and risk of cerebrovascular disease: the first national health and nutritional examination survey and its follow-up study. Arch Intern Med. 2000. 160:2749–55.
7.Terpenning MS., Taylor GW., Lopatin DF., Kerr CK., Domingguez BL., Loesche W. Aspiration pneumonia: dental and oral risk factor in an older veteran population. J Am Geriatric Soc. 2001. 49:557–63.
8.Madianos PN., Bobetsis GA., Kinane DF. Is periodontitis with an increased risk of coronary disease and preterm and/or low weight births? J Clin Periodontol. 2002. 29:37–8.
9.Joshipura KJ., Hung HC., Rimm EB., Willett WC., Ascherio A. Periodontal disease, tooth loss, and incidence of ischemic Stroke. Stroke. 2003. 34:47–52.

10.Choi JS., Kang WJ., Chung MK. A Study On The Satisfied Degree of Oral Function in Geriatric Patients with the Shortened Dental Arch. J Kor Acad Prosthodont. 1992. 30:191–202.
11.Lee CY., Chang HJ., Chung MK. Oral stratus of geriatric patients, and their demand and satisfaction in prosthodontic treatment. J Kor Acad Prosthodont. 2001. 39:323–35.
12.Kim HW., Kim CW., Kim YS. A Clinical Study on the satisfaction of complete denture patients. J Kor Acad Prosthodont. 1995. 33:440–52.
13.Park JH., Kwon HK., Kim BI., Choi CH., Choi YH. A survey on the oral health condition of institutionalized elderly people resident in free asylum. J Kor Acad Dent Health. 2002. 26:555–66.
14.Yoon JA. Oral health condition of the low socioeconomic elderly people. p. 32–34. Dissertations Graduate school, Yonsei university;Seoul: 2001.
15.Kwon HK., Kim YN., Kim BI., Yoo JH. The oral health status of low socioeconomic elderly people in Korea. J Kor Acad Dent Health. 2004. 28:87–96.
16.Kwon HG. The baseline study of the denture treatment program of low socioeconomic old aged population. p. 59–63. Dept. of Preventive Dentistry & Public Oral Health College of Dentistry Yonsei University;Seoul: 2001.
17.Kim JB., Paik DI., Moon HS., Kim JB. A Study on the oral health status of Korean people (January-December 1991). p. 25–57. National Institutes of oral health;Seoul: 1992.
18.National Institutes of oral health: A Study on the oral health status of Korean people (1995). 53–76. Seoul. 1995.
19.Ministry of Health and Welfare Korea: 2000 Korean National oral health survey. 31–88. Seoul. 2001.
20.Ministry of Health and Welfare Korea: 2003 Korean National oral health survey. 17–98. Gwacheon. 2004.
21.The Korean Academy of Oral Health. Oral Health Promotion Supporting Committee: Guidelines of 2000 National oral health survey. 102–128. Korean Institute of Oral Health Services, Seoul. 2000.
22.Landis JR., Koch GG. The Measurement of observer agreement for categorical data. Biometrics. 1977. 33:159–74.

23.Fleiss JL. Statistical methods for rats and proportions,. 2nd edn.Wisley;New York, NY: 1998. p. 145–6.
24.Kwon HG., Kim YN., Jeong GH., Song GB., Park DY. The financing estimation study for the Korean elderly‘s denture service under the National Health Insurance coverage. J Kor Acad Dent Health. 2003. 27:347–56.
25.Kim JB. The survey of elderly oral health research in Korea (1977). J Kor Dent Assoc. 1977. 15:289–96.
26.The Korean Dental Association: Report on the survey of dental diseases of Korean. 21–74. The Korean Dental Association. Seoul. 1983.
27.The Korean Dental Association: Report on the survey of dental diseases of Korean. 53–75. The Korean Dental Association. Seoul. 1989.
28.Nyman K. Dental status and dental care and its development. Publications of the Social insurance Institution. 1990. 76. Helsinki, Finland.
29.Ainamo J., Murtomaa H. Edentulousness in finland in 1970, 1980 and 1990. Finnish Dental Journal. 38:289. 1991. (in Finnish).
30.Wyatt CLC. Elderly Canadians residing in long-term care hospitals. Part 1: Medical and dental status. J Canadian Dent Assoc. 2002. 68:353–8.
31.Pilot T. Introduction-ART from a global perspective. Community Dentistry and Oral Epidemiology. 1999. 27:421.
32.Bourgeois D., Nihtila A., Mersel A. Prevalance of caries and edentulousness among 65-74-year-olds in Europe. Bulletin of the World Health Organization. 1998. 76:413.
33.Gift HC., Newman JF. How older adults use oral health care services: results of a National Health Interview Survey. J Am Dent Assoc. 1993. 124:89–93.

34.Jette AM., Feldman HA., Douglass C. Oral disease and physical disability in community-dwelling older persons. J Am Geriatric Soc. 1993. 41:1102–8.

35.Knabe C., Kram P. Dental Care for institutionalized geriatric patients in germany. J Oral Rehabil. 1997. 24:909–12.

36.Yang DS., Shin SC., Seo HS. Oral health status on psychiatric patients in Korea. J Kor Acad Dent Health. 2002. 26:313–22.
37.Vigilid M. Denture status and need for prosthodontic treatment among institutionalized elderly in Denmark. Community Dent Oral Epidemiol. 1987. 15:128.
Go to : 
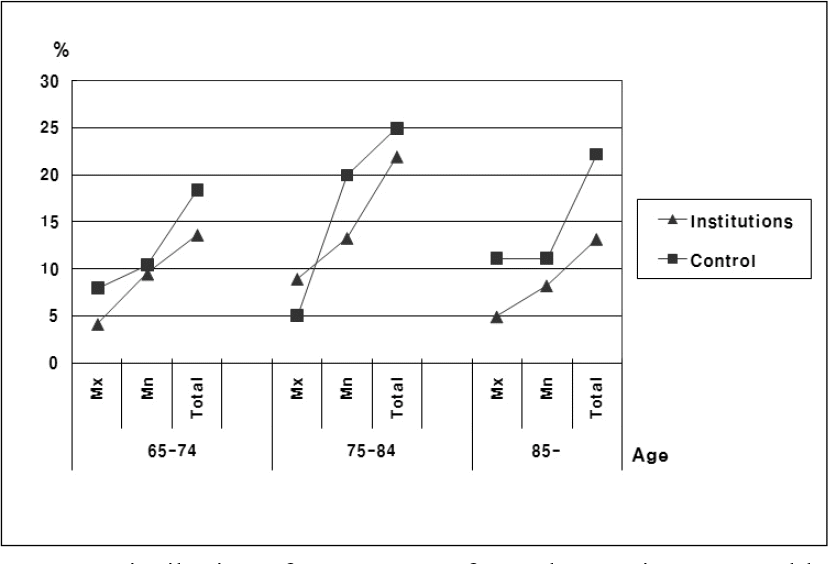 | Fig. 4.Distribution of percentage of people wearing removable partial denture by aged groups. |
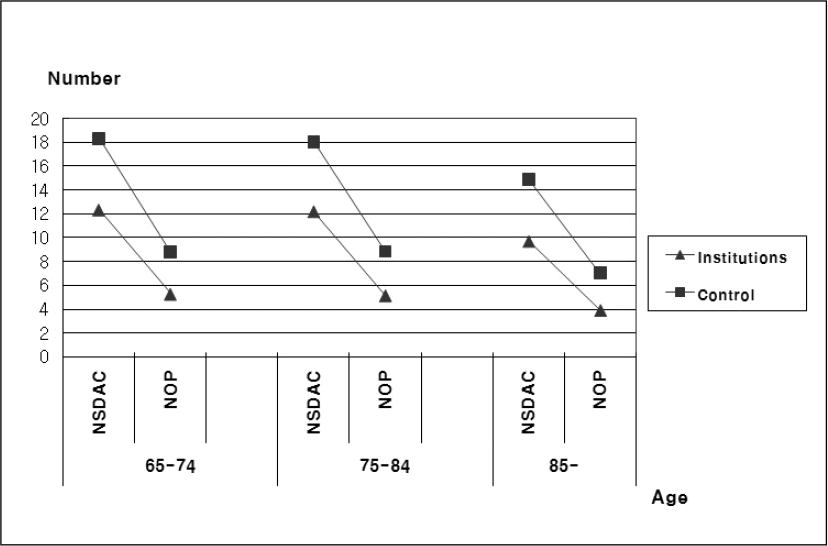 | Fig. 7.Distribution of number of valued teeth and dental prostheses in shortened dental arch concept and number of occluding pairs of teeth by aged groups. |
Table I.
Distribution of the elderly in Experimental group (Institutions) and Control group (D dental clinic) by gender (unit: number)
Table II.
Mean values of DMFT index by aged groups (unit: number)
| Aged groups | Experimental group (Institutions) | Control group (D dental clinic) |
|---|---|---|
| 65≤Age≤74 | 19.93 ± 8.70 | 15.02 ± 9.01 |
| 75≤Age≤84 | 22.90 ± 7.27 | 21.68 ± 8.46 |
| 85≤Age | 24.70 ± 5.74 | 24.00 ± 5.20 |
Table III.
Mean values of number of residual tooth by aged groups (unit: number)
Table IV.
Mean values of number of fixed partial denture by aged groups (unit: number)
Table V.
Percentage of people wearing removable partial denture by aged groups (unit: %)
Table VI.
Percentage of people wearing complete denture by aged groups (unit: %)
Table VII.
Percentage of people needing complete denture by aged groups (unit: %)
Table VIII.
Mean values of number of valued teeth and dental prostheses in shortened dental arch concept and number of occluding pairs of teet by aged groups (unit: number)
Table IX.
Summary of number of valued teeth and dental prostheses in shortened dental arch concept, number of occluding pairs of teeth in relation of professional treatment need (unit: number, %)
| Experimental group (Institutions) | Control group (D dental clinic) | |||||
|---|---|---|---|---|---|---|
| Value = 0 | Mean | Value = max | Value = 0 | Mean | Value = max | |
| NSDAC | 16.35% | 11.5 | 32.58%∗ | 0.94% | 18.13 | 64.60%∗ |
| NOP | 34.56% | 4.84 | 32.18%∗∗ | 2.83% | 8.71 | 64.60%∗∗ |
Table X.
Summary of values in relation of removable prostheses (unit: number, %)
| Experimental group (Institutions) | Control group (D dental clinic) | |||||
|---|---|---|---|---|---|---|
| Maxilla | Mandible | Total | Maxilla | Mandible | Total | |
| Edentulism (%) | 51.90 | 35.60 | 29.50∗ | 21.20 | 12.70 | 9.90∗ |
| NRT>20 (%) | - | - | 14.90 | - | - | 44.33 |
| RPD (%) | 6.46 | 10.68 | 3.03∗∗ | 7.54 | 12.26 | 2.35∗∗ |
| Single RPD (%) | 3.43 | 7.51 | 10.94 | 5.18 | 9.43 | 14.62 |
| CD (%) | 21.10 | 10.81 | 9.23∗∗∗ | 19.81 | 10.37 | 8.96∗∗∗ |
| Single CD (%) | 3.43 | 0.52 | 3.95 | 11.30 | 1.41 | 12.73 |
| Patient without denture in fully edentulism (%) | - | - | 55.35 | - | - | 9.52 |
Table XI.
Data of Oral Health Research of year 2000 in Republic of Korea by aged groups (unit: number, %)
| Aged groups | DMFT index | Number of residual tooth∗ | Percentage of people wearing removable partial denture | Percentage of people wearing complete denture | Percentage of people needing complete denture | |
|---|---|---|---|---|---|---|
| 65<Age<74 | Mx | - | - | 11.68 | 21.73 | 5.07 |
| Mn | - | - | 12.43 | 14.80 | 3.91 | |
| Total | 11.94 | 18.67∗ | - | - | - | |
| 75<Age | Mx | - | - | 10.67 | 33.41 | 16.13 |
| Mn | - | - | 9.97 | 24.74 | 14.31 | |
| Total | 14.91 | 15.53∗ | - | - | - |


 PDF
PDF ePub
ePub Citation
 Print
Print


 XML Download