Abstract
Background
Calcineurin inhibitor-induced nephrotoxicity is the main cause of renal dysfunction after liver transplantation (LT). The aims of this study were to investigate the changes in kidney function after LT and to determine the optimal tacrolimus level in order to minimize nephrotoxicity at various time points after LT.
Methods
We enrolled 37 LT recipients with a preoperative estimated glomerular filtration rate (eGFR) ≥60 mL/min/1.73 m2 and all received immunosuppression including tacrolimus. Renal function was assessed by eGFR. eGFR and tacrolimus level were estimated at 2 weeks, 1, 3, 6, and 12 months after LT. Multivariate regression analysis was applied for determination of mean tacrolimus level minimizing the decrease in eGFR at those time periods. Age, sex, presence of diabetes or hypertension, and use of Simulect were the covariates.
Results
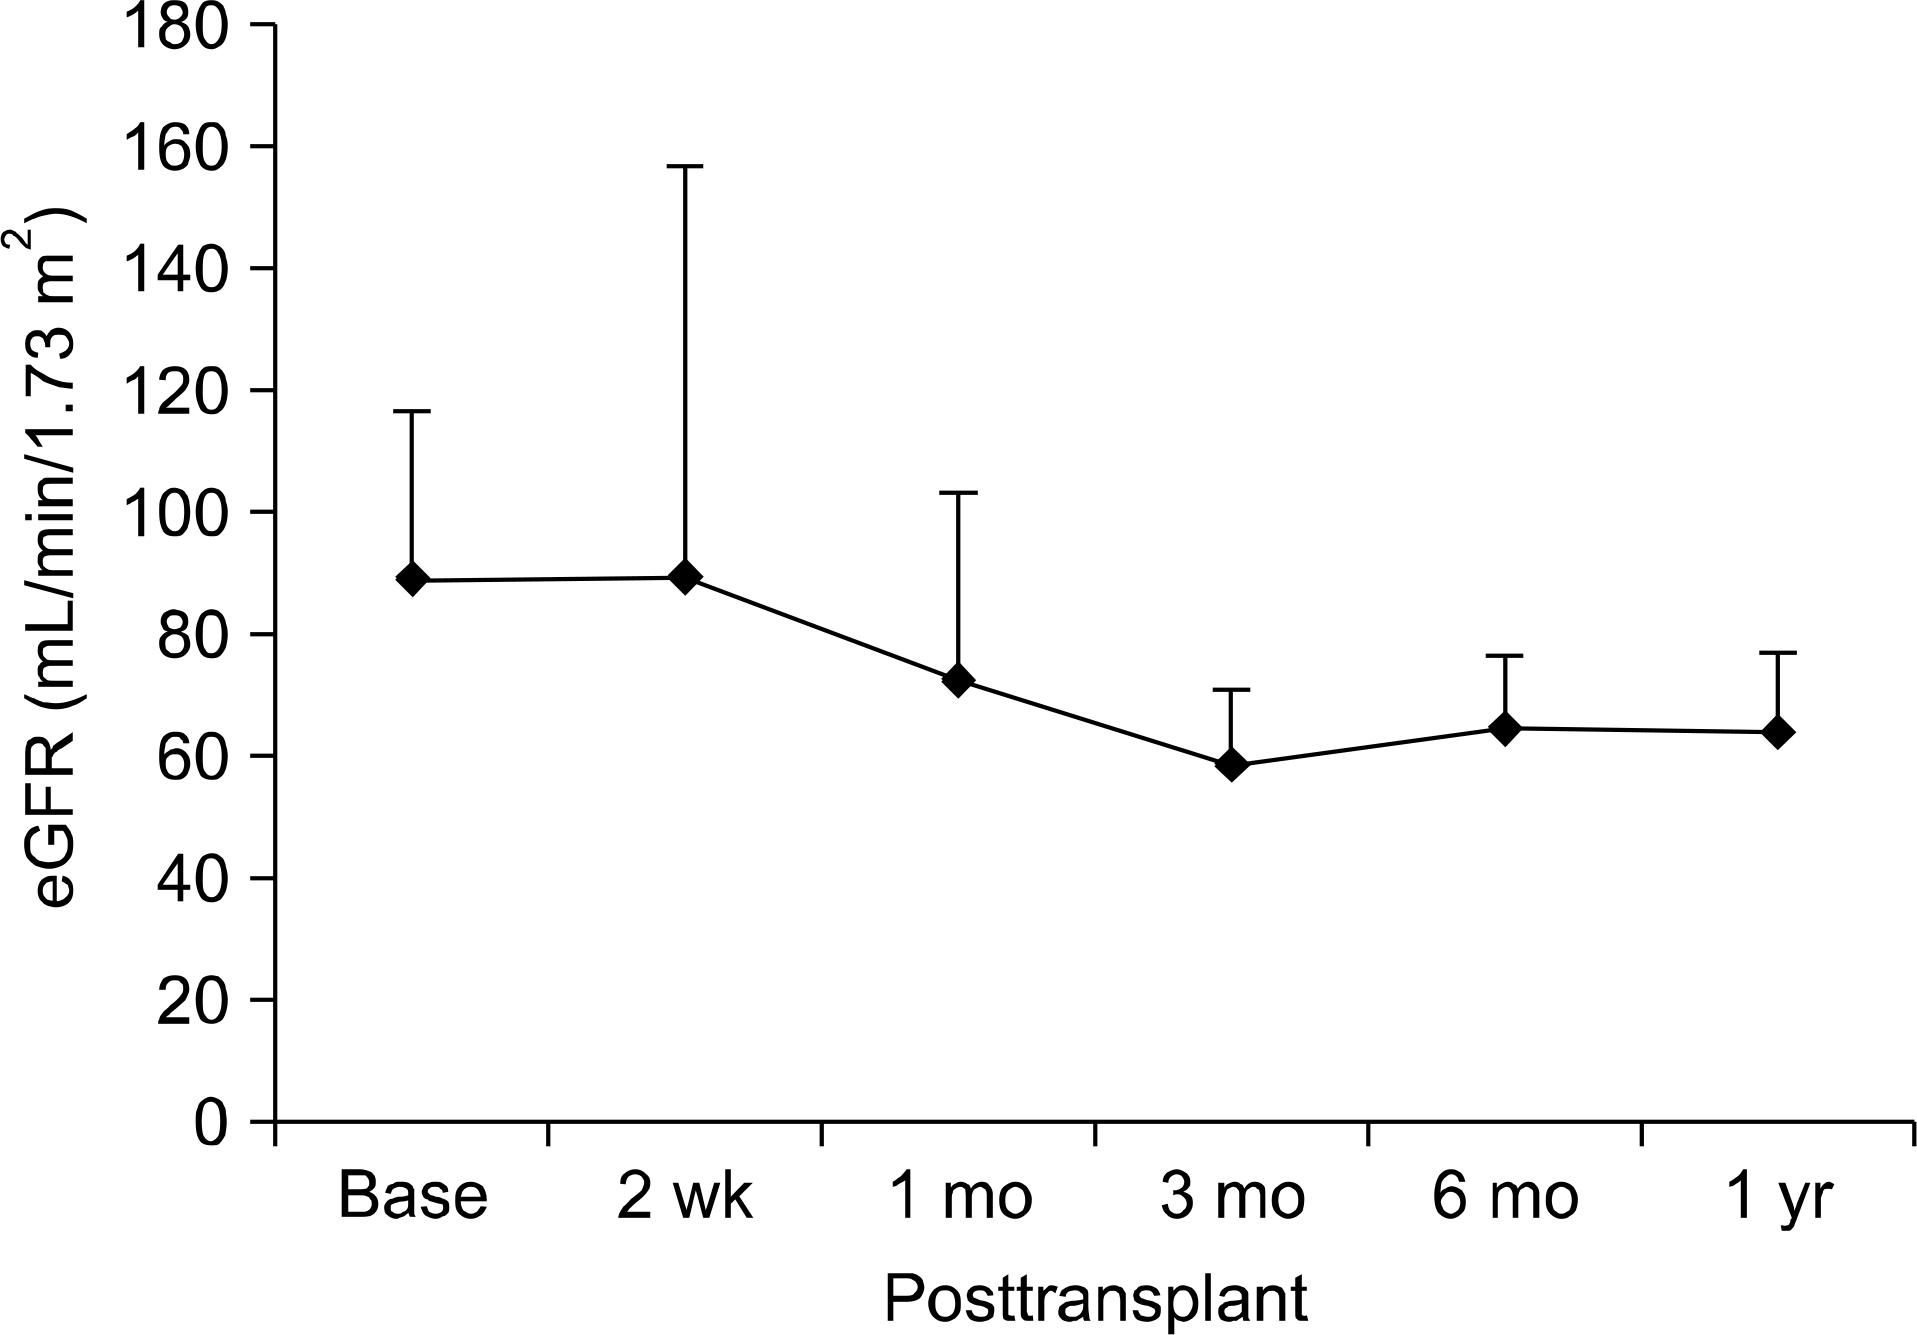
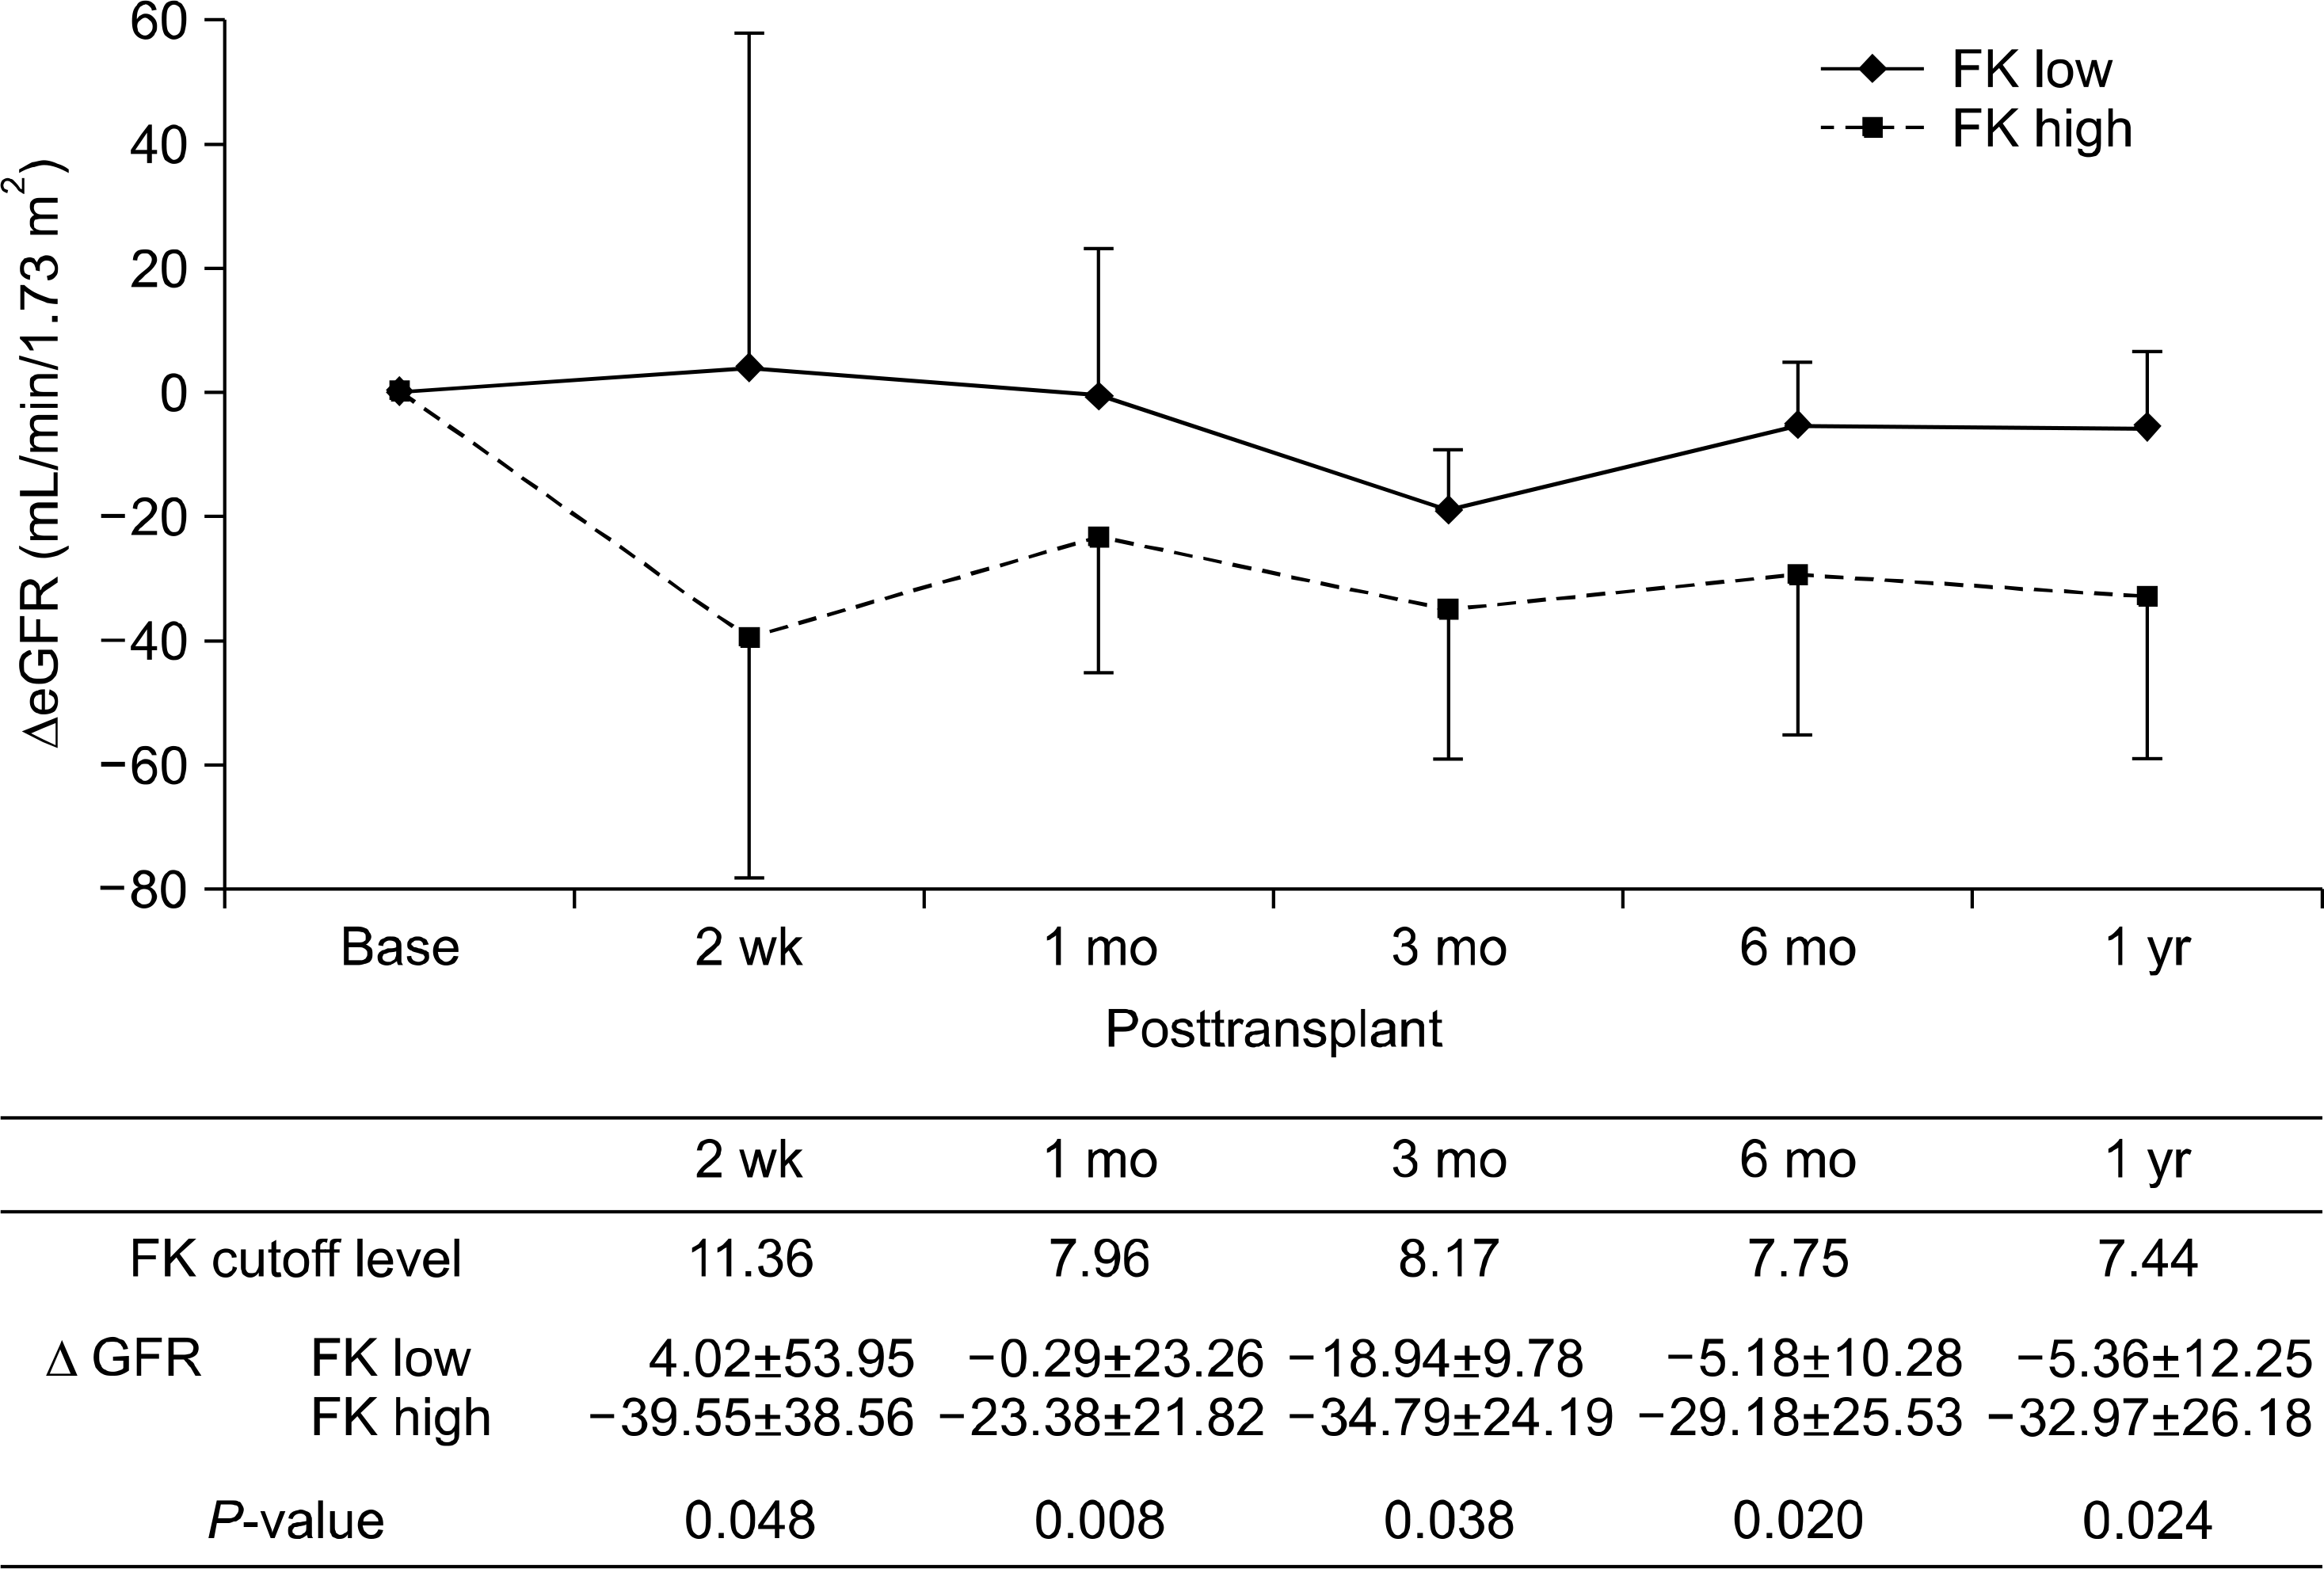
Mean eGFR showed a decrease from 88 to 58 mL/min/1.73 m2 by 3 months after LT. Thereafter, eGFR remained stationary until 1 year. By multivariate regression analysis, mean tacrolimus level minimizing the decrease in eGFR could be obtained. Decrease of eGFR was lower in 12 patients with a mean tacrolimus level below 7.96 ng/mL compared to 25 patients with a mean tacrolimus level above 7.96 ng/mL (0.29 mL/min/1.73 m2 vs. 23.38 mL/min/1.73 m2; P=0.008).
References
1). Nair S, Verma S, Thuluvath PJ. Pretransplant renal function predicts survival in patients undergoing orthotopic liver transplantation. Hepatology. 2002; 35:1179–85.

2). Ojo AO. Renal disease in recipients of nonrenal solid organ transplantation. Semin Nephrol. 2007; 27:498–507.

3). Ojo AO, Held PJ, Port FK, Wolfe RA, Leichtman AB, Young EW, et al. Chronic renal failure after transplantation of a nonrenal organ. N Engl J Med. 2003; 349:931–40.

4). Cabezuelo JB, Ramírez P, Ríos A, Acosta F, Torres D, Sansano T, et al. Risk factors of acute renal failure after liver transplantation. Kidney Int. 2006; 69:1073–80.

5). Hodge EE, Reich DJ, Clavien PA, Kim-Schluger L. Use of mycophenolate mofetil in liver transplant recipients experiencing renal dysfunction on cyclosporine or tacro-limus-randomized, prospective, multicenter study results. Transplant Proc. 2002; 34:1546–7.

6). Farkas SA, Schnitzbauer AA, Kirchner G, Obed A, Banas B, Schlitt HJ. Calcineurin inhibitor minimization protocols in liver transplantation. Transpl Int. 2009; 22:49–60.

7). Levey AS, Coresh J, Balk E, Kausz AT, Levin A, Steffes MW, et al. National Kidney Foundation practice guidelines for chronic kidney disease: evaluation, classification, and stratification. Ann Intern Med. 2003; 139:137–47.

8). Ide K, Tanaka Y, Onoe T, Banshodani M, Tazawa H, Igarashi Y, et al. Evidence for the immunosuppressive potential of calcineurin inhibitor-sparing regimens in liver transplant recipients with impaired renal function. J Transplant. 2011; 2011:483728.

9). de Mattos AM, Olyaei AJ, Bennett WM. Nephrotoxicity of immunosuppressive drugs: longterm consequences and challenges for the future. Am J Kidney Dis. 2000; 35:333–46.

10). McCauley J, Van Thiel DH, Starzl TE, Puschett JB. Acute and chronic renal failure in liver transplantation. Nephron. 1990; 55:121–8.

11). Fisher NC, Nightingale PG, Gunson BK, Lipkin GW, Neuberger JM. Chronic renal failure following liver transplantation: a retrospective analysis. Transplantation. 1998; 66:59–66.
12). Xu X, Ling Q, Wei Q, Wu J, Gao F, He ZL, et al. An effective model for predicting acute kidney injury after liver transplantation. Hepatobiliary Pancreat Dis Int. 2010; 9:259–63.
13). Wilkinson A, Pham PT. Kidney dysfunction in the recipients of liver transplants. Liver Transpl. 2005; (11 Suppl 2):S47–51.

14). Burdmann EA, Andoh TF, Yu L, Bennett WM. Cyclosporine nephrotoxicity. Semin Nephrol. 2003; 23:465–76.

15). Naesens M, Kuypers DR, Sarwal M. Calcineurin inhibitor nephrotoxicity. Clin J Am Soc Nephrol. 2009; 4:481–508.

16). Wiederrecht G, Lam E, Hung S, Martin M, Sigal N. The mechanism of action of FK-506 and cyclosporin A. Ann N Y Acad Sci. 1993; 696:9–19.

17). Meier-Kriesche HU, Li S, Gruessner RW, Fung JJ, Bustami RT, Barr ML, et al. Immunosuppression: evolution in practice and trends, 1994–2004. Am J Transplant. 2006; 6(5 Pt 2):1111–31.

18). Gonwa TA, Mai ML, Melton LB, Hays SR, Goldstein RM, Levy MF, et al. Renal replacement therapy and orthotopic liver transplantation: the role of continuous ve-no-venous hemodialysis. Transplantation. 2001; 71:1424–8.
19). Gonwa TA, Mai ML, Melton LB, Hays SR, Goldstein RM, Levy MF, et al. End-stage renal disease (ESRD) after orthotopic liver transplantation (OLTX) using calcineurin-based immunotherapy: risk of development and treatment. Transplantation. 2001; 72:1934–9.
20). Lake JR. Hot-topic debate on kidney function: renalsparing approaches are ineffective. Liver Transpl. 2011; 17(Suppl 3):S50–3.

21). Kim HJ, Han SH, Kim BS, Kang SW, Choi KH, Lee HY, et al. Risk factors for development of acute renal failure after liver transplantation. J Korean Soc Transplant. 2005; 19:192–7. (김홍정, 한승혁, 김범석, 강신욱, 최규헌, 이호영, 등. 간 이식술 후 발생한 급성 신부전에 대한 위험인자 분석. 대한이식학회지 2005;19: 192–7.).
Fig. 1.
Temporal changes of estimated glomerular filtration rate (eGFR) after liver transplantation.

Fig. 2.
Cumulative tacrolimus level (mean) differentiation ΔeGFR most significantly P-value were calculated using multiple regression model controlling age and sex as covariates. Abbreviations: eGFR, estimated glomerular filtration rate; FK, FK506 (Tacrolimus).

Table 1.
Incidence of acute rejection and infection within post-transplant 1 month by blood trough level of tacrolimus
| Tacrolimus a | P-value | ||
|---|---|---|---|
| Low level (n=12) | High level (n=25) | ||
| Acute rejection | 1 (2) | 6 (16) | 0.399 |
| Infection | 0 | 4 (10) | 0.290 |
| Data are presented as number (%). | |||


 PDF
PDF ePub
ePub Citation
 Print
Print


 XML Download