Abstract
Background:
Tissue microarray analysis (TMA) is a high-throughput method for histologic evaluation, immunohistochemistry, and in situ hybridization using paraffin embedded tissue. Despite its high efficiency as an experimental tool, TMA is limited because it only contains a very small tissue fragment from each case. Therefore, the purpose of this study was to evaluate the validity of TMA in a study of nephrotoxicity caused by immunosuppressants.
Methods:
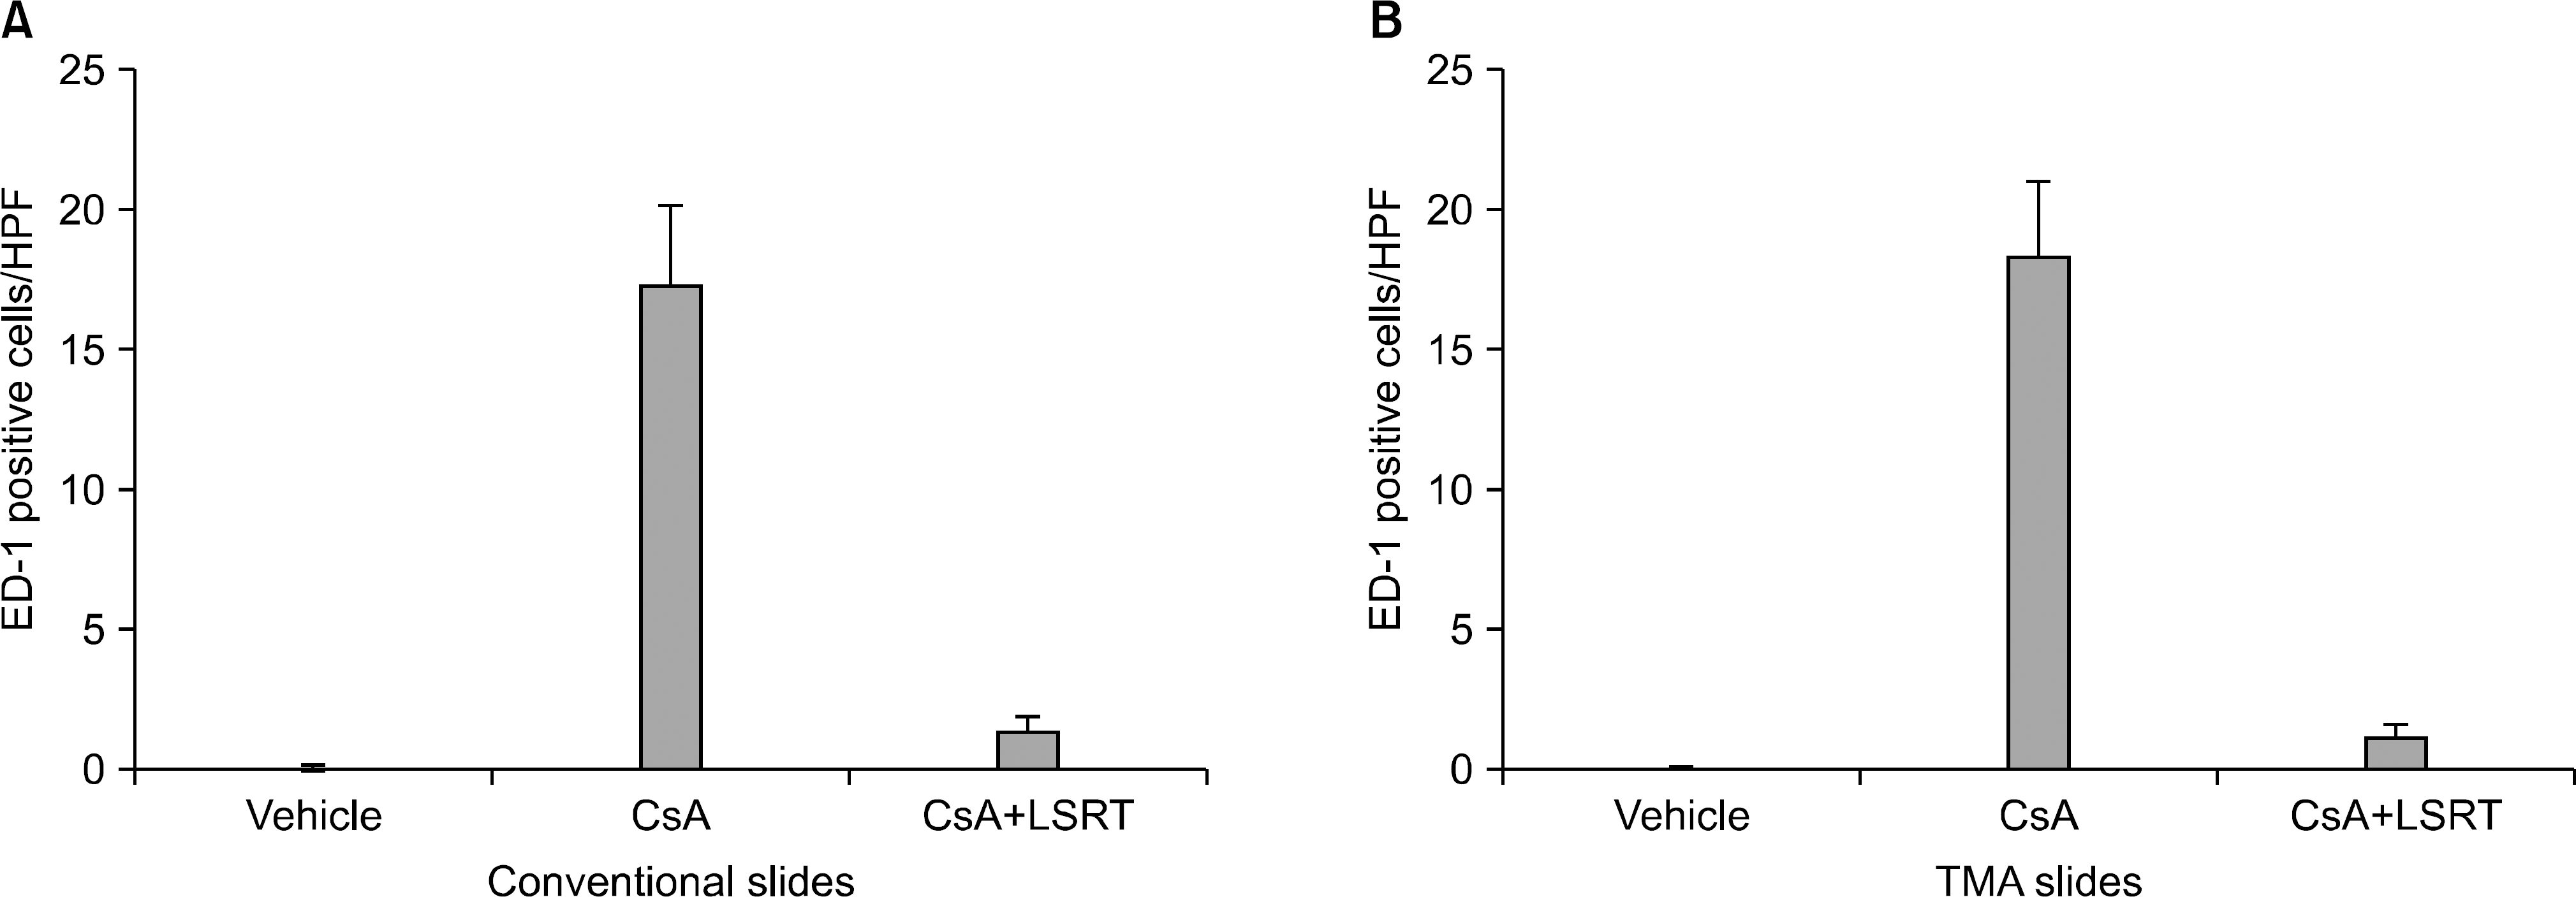
Male Sprague-Dawley rats were treated with vehicle (n=16), cyclosporine (n=23), and cyclosporine plus losartan (n=13) for a maximum of 7 weeks. After animal sacrifice, renal tissues were embedded in paraffin and processed into slides for microscopic examination using conventional methods and the TMA technique. Acute tubular injury, vascular hyaline change, and interstitial fibrosis were scored in both conventional and TMA slides. The number of interstitial macrophages was counted after ED-1 immunohistochemistry and the results also compared between conventional and TMA slides.
Results:
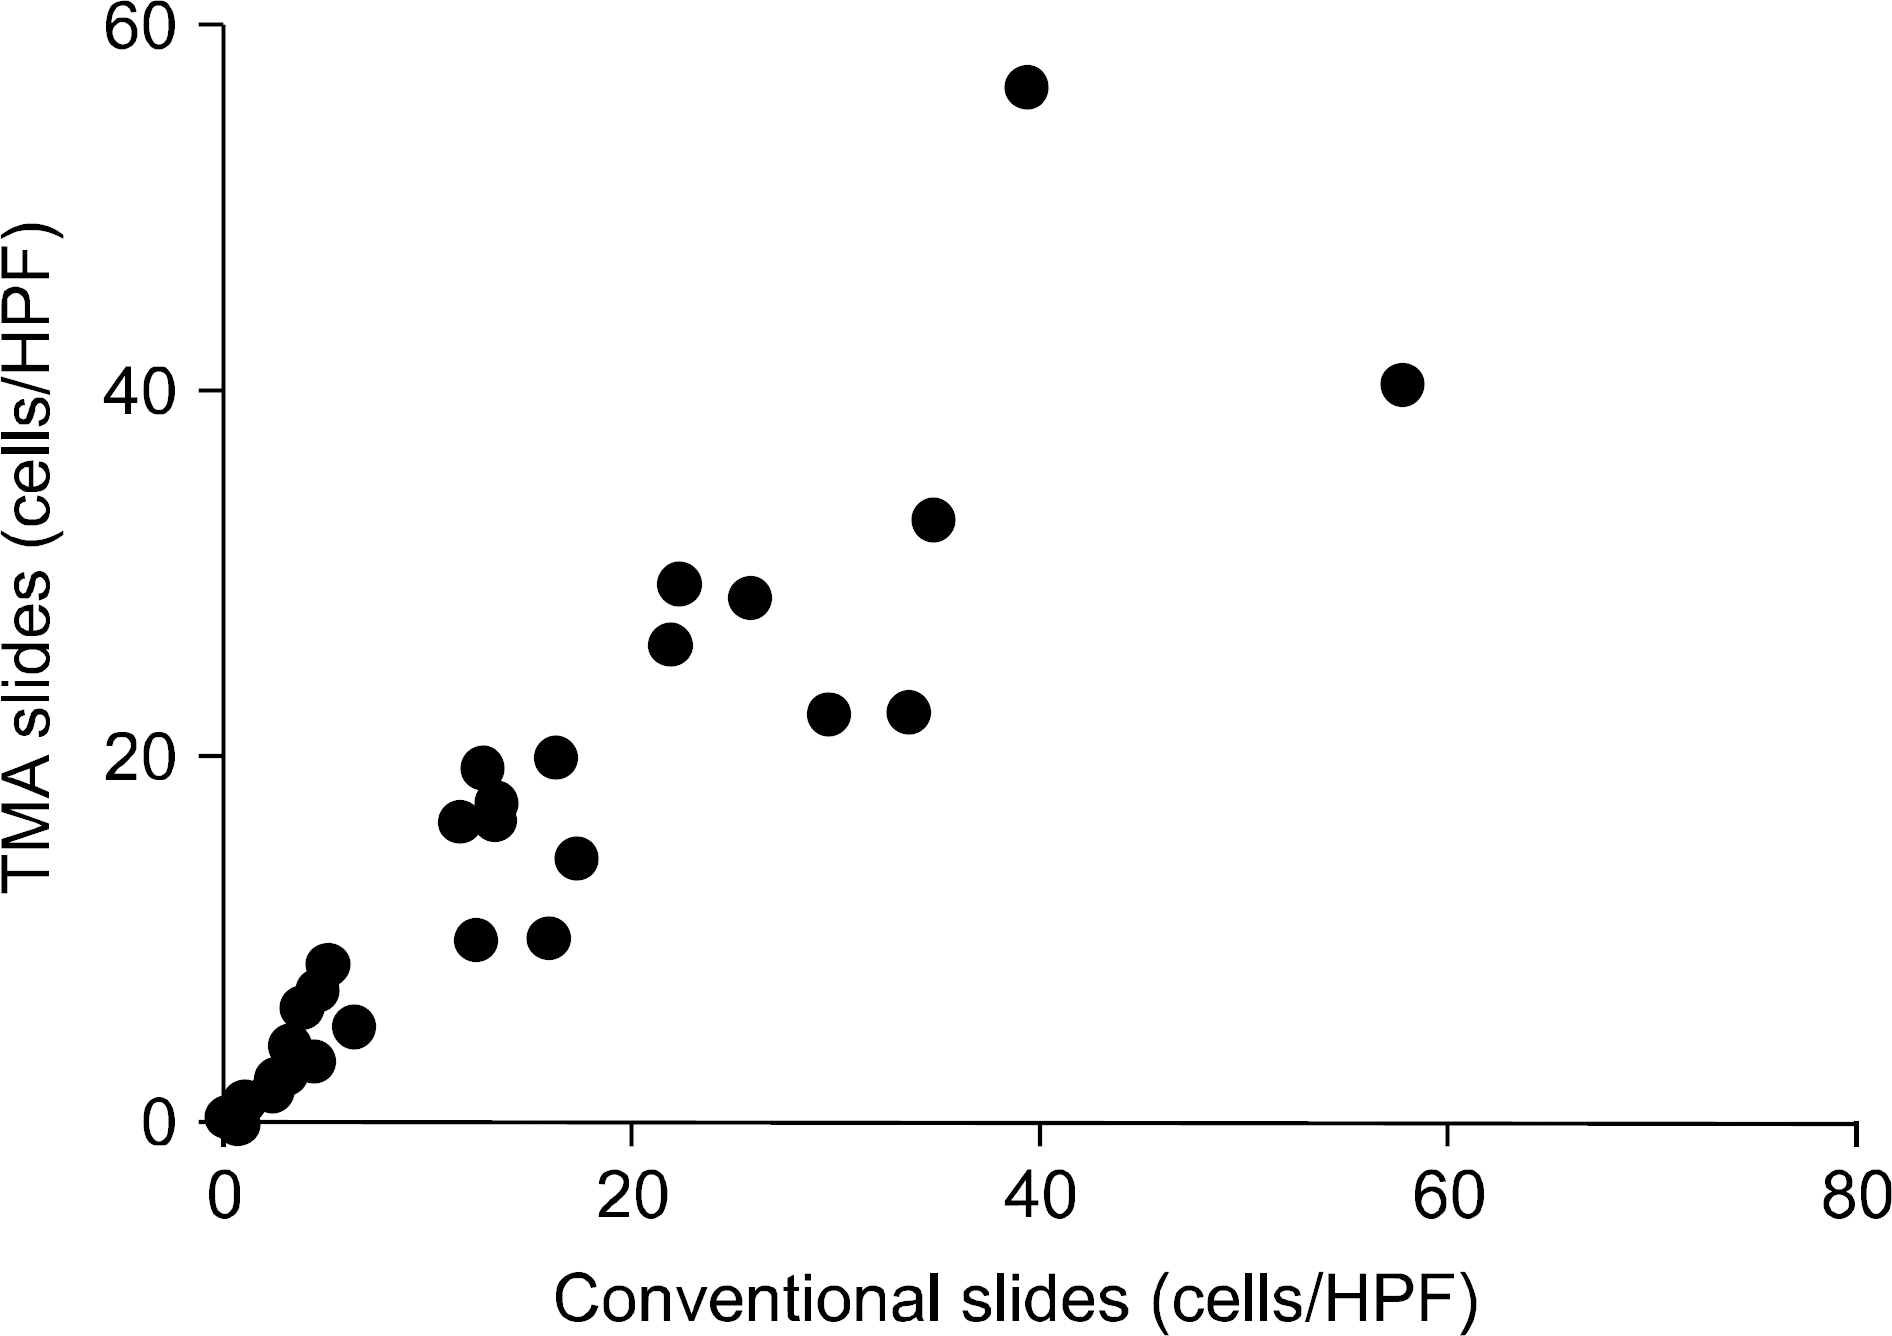
The degree of acute tubular injury and interstitial fibrosis showed a significant agreement between conventional and TMA methods (κ value, 0.79 and 1.00, respectively). The number of interstitial macrophages counted in conventional and TMA slides showed a significant correlation as well (r=0.934, P<0.001). However, the degree of vascular hyaline changes showed less agreement between conventional and TMA methods (κ value, 0.40).
Go to : 
REFERENCES
1). Camp RL, Neumeister V, Rimm DL. A decade of tissue microarrays: progress in the discovery and validation of cancer biomarkers. J Clin Oncol. 2008; 26:5630–7.

2). Racusen LC, Solez K, Colvin RB, Bonsib SM, Castro MC, Cavallo T, et al. The Banff 97 working classification of renal allograft pathology. Kidney Int. 1999; 55:713–23.

3). Solez K, Colvin RB, Racusen LC, Haas M, Sis B, Mengel M, et al. Banff 07 classification of renal allograft pathology: updates and future directions. Am J Transplant. 2008; 8:753–60.

4). Radhakrishnan R, Solomon M, Satyamoorthy K, Martin LE, Lingen MW. Tissue microarray: a high-throughput molecular analysis in head and neck cancer. J Oral Pathol Med. 2008; 37:166–76.
5). Voduc D, Kenney C, Nielsen TO. Tissue microarrays in clinical oncology. Semin Radiat Oncol. 2008; 18:89–97.

6). Simon R, Sauter G. Tissue microarrays for miniaturized high-throughput molecular profiling of tumors. Exp He-matol. 2002; 30:1365–72.

7). Zhang MZ, Su Y, Yao B, Zheng W, Decaestecker M, Harris RC. Assessing the application of tissue microarray technology to kidney research. J Histochem Cytochem. 2010; 58:413–20.

Go to : 
 | Fig. 1.A sample of tissue microarray (TMA). (A) 1:1 photography of a paraffin block and (B) a PAS-stained slide. Each TMA contained upto 30 tissue cores. Tissue cores were 3 mm in diameter and obtained from corticomedullary junction. Representative photography of cores (C, ×40; D, ×200). |
 | Fig. 2.ED-1 positive cell infiltration observed in conventional and tissue microarray analysis (TMA) slides. (A) In conventional slides, the number of ED-1 positive cells in interstitium was markedly increased after cyclosporine treatment, and remained in low level after cyclosporine and losartan combination treatment. (B) The result obtained from TMA slides showed same tendency in each group. Abbreviations: HPF, high power field; CsA, cyclosporine; LSRT, losartan. |
 | Fig. 3.Correlation of ED-1 positive cell counts obtained from conventional and tissue microarray analysis (TMA) slides. The number of ED-1 positive cells counted in conventional and TMA slides showed a significant correlation in each case (γ=0.934, P<0.001). Abbreviation: HPF, high power field. |
Table 1.
Comparison of the severity of tubular injury between conventional and tissue microarray analysis slides
Table 2.
Comparison of the severity of vascular hyaline change between conventional and tissue microarray analysis slides
Table 3.
Comparison of the degree of interstitial fibrosis between conventional and tissue microarray analysis slides


 PDF
PDF ePub
ePub Citation
 Print
Print


 XML Download