

 PDF
PDF ePub
ePub Citation
 Print
Print


Abstract
Background
The incidence of acute rejection has decreased with the introduction of new immunosuppressive agents. However, several studies have shown that allograft survival has not clearly improved over the past few decades.
Methods
We reviewed patients who underwent kidney transplantation between 1982 and 2007. We compared the causes of graft loss for three decades: 1982∼1990 (period I), 1991∼2000 (period II), and 2001∼2007 (period III), with the clinical characteristics of patients with functioning grafts and patients who lost their allografts.
Results
There were 785 recipients with a mean age of 36.1 years, and 65.2% were male. Graft loss occurred in 329 patients (41.9%), and the most common cause of graft loss was chronic allograft nephropathy (CAN, 52.0%), followed by patient death (17.6%), post-transplant glomerulonephritis (12.8%), and non compliance (7.9%). During the three time periods, 129, 172, and 28 patients lost their grafts, respectively. Five-year graft survival was 61.5%, 78.4%, and 90.8%, respectively, and increased significantly (P<0.000). CAN, as a cause of graft loss, fell from 65.1% (period I) to 32.1% (period III, P<0.000), but patient death increased from 12.4% to 32.1% (P=0.034). A multivariate analysis revealed that significant risk factors for graft loss included an older donor, transplantation at period I, and dual immunosuppression. Use of tacrolimus and mycophenolate mofetil was associated with a significantly reduced risk of graft loss.
Go to : 
References
1). Pascual M, Theruvath T, Kawai T, Tolkoff-Rubin N, Cosimi AB. Strategies to improve longterm outcomes after renal transplantation. N Engl J Med. 2002; 346:580–90.

2). Hariharan S, Johnson CP, Bresnahan BA, Taranto SE, McIntosh MJ, Stablein D. Improved graft survival after renal transplantation in the United States, 1988 to 1996. N Engl J Med. 2000; 342:605–12.
3). Meier-Kriesche HU, Schold JD, Srinivas TR, Kaplan B. Lack of improvement in renal allograft survival despite a marked decrease in acute rejection rates over the most recent era. Am J Transplant. 2004; 4:378–83.
4). Meier-Kriesche HU, Schold JD, Kaplan B. Long-term renal allograft survival: have we made significant progress or is it time to rethink our analytic and therapeutic strat-egies? Am J Transplant. 2004; 4:1289–95.
5). Howard RJ, Patton PR, Reed AI, Hemming AW, van der Werf WJ, Pfaff WW, et al. The changing causes of graft loss and death after kidney transplantation. Transplantation. 2002; 73:1923–8.
6). Kim JY, Kim SH, Kim YS, Choi BS, Kim JC, Park SC, et al. Report of 1,500 kidney transplants at the Catholic University of Korea. J Korean Soc Transplant. 2006; 20:172–80. (김진영, 김수현, 김영수, 최범순, 김준철, 박순철, 등. 가톨릭대학교 의과대학에서 시행한 신장이식 1,500예의 성적보고. 대한이식학회지 2006;20: 172–80.).
7). Rianthavorn P, Ettenger RB. Medication non-adherence in the adolescent renal transplant recipient: a clinician's viewpoint. Pediatr Transplant. 2005; 9:398–407.
8). Knoll G. Trends in kidney transplantation over the past decade. Drugs. 2008; 68(Suppl 1):3–10.
9). Cecka JM. The OPTN/UNOS renal transplant registry. Clin Transpl. 2004; 1–16.
10). Nankivell BJ, Borrows RJ, Fung CL, O'Connell PJ, Allen RD, Chapman JR. The natural history of chronic allograft nephropathy. N Engl J Med. 2003; 349:2326–33.
11). Mauiyyedi S, Pelle PD, Saidman S, Collins AB, Pascual M, Tolkoff-Rubin NE, et al. Chronic humoral rejection: identification of antibody-mediated chronic renal allograft rejection by C4d deposits in peritubular capillaries. J Am Soc Nephrol. 2001; 12:574–82.
12). Jevnikar AM, Mannon RB. Late kidney allograft loss: what we know about it, and what we can do about it. Clin J Am Soc Nephrol. 2008; 3(Suppl 2):S56–67.
13). Thaunat O, Legendre C, Morelon E, Kreis H, Mamzer-Bruneel MF. To biopsy or not to biopsy? Should we screen the histology of stable renal grafts? Transplantation. 2007; 84:671–6.
14). Ojo AO, Hanson JA, Wolfe RA, Leichtman AB, Agodoa LY, Port FK. Long-term survival in renal transplant recipients with graft function. Kidney Int. 2000; 57:307–13.
15). Evenepoel P, Vanrenterghem Y. Death with functioning graft–a preventable cause of graft loss. Ann Transplant. 2001; 6:17–20.
16). Sato K, Tadokoro F, Ishida K, Matsuzawa K, Nakayama Y, Yokota K, et al. Causes of death after renal transplantation: a longterm follow-up study. Transplant Proc. 1994; 26:2017–8.
17). Washer GF, Schröter GP, Starzl TE, Weil R 3rd. Causes of death after kidney transplantation. JAMA. 1983; 250:49–54.
18). Hiesse C, Rieu P, Larue JR, Kriaa F, Goupy C, Benoit G, et al. Late graft failure and death in renal transplant recipients: analysis in a singlecenter population of 1500 patients. Transplant Proc. 1997; 29:240–2.
19). Lindholm A, Albrechtsen D, Frödin L, Tufveson G, Persson NH, Lundgren G. Ischemic heart disease–major cause of death and graft loss after renal transplantation in Scandinavia. Transplantation. 1995; 60:451–7.
20). El-Zoghby ZM, Stegall MD, Lager DJ, Kremers WK, Amer H, Gloor JM, et al. Identifying specific causes of kidney allograft loss. Am J Transplant. 2009; 9:527–35.
21). Nijjar AP, Wang H, Quan H, Khan NA. Ethnic and sex differences in the incidence of hospitalized acute myocardial infarction: British Columbia, Canada 1995–2002. BMC Cardiovasc Disord. 2010; 10:38.
22). Lim JT, Kim SC, Jang HJ, Moon HK, Han DJ. Cause of death after kidney transplantation. J Korean Soc Transplant. 2003; 17:157–65. (임정택, 김송철, 장혁재, 문혜경, 한덕종. 신이식 후 사망 원인. 대한이식학회지 2003;17: 157–65.).
23). Fairhead T, Knoll G. Recurrent glomerular disease after kidney transplantation. Curr Opin Nephrol Hypertens. 2010; 19:578–85.
24). Hariharan S, Peddi VR, Savin VJ, Johnson CP, First MR, Roza AM, et al. Recurrent and de novo renal diseases after renal transplantation: a report from the renal allograft disease registry. Am J Kidney Dis. 1998; 31:928–31.
25). Gourishankar S, Leduc R, Connett J, Cecka JM, Cosio F, Fieberg A, et al. Pathological and clinical characterization of the ‘troubled transplant': data from the DeKAF study. Am J Transplant. 2010; 10:324–30.
26). Han SS, Huh W, Park SK, Ahn C, Han JS, Kim S, et al. Impact of recurrent disease and chronic allograft nephropathy on the longterm allograft outcome in patients with IgA nephropathy. Transpl Int. 2010; 23:169–75.
27). Brennan DC. Long-term trends in allograft survival. Adv Chronic Kidney Dis. 2006; 13:11–7.
28). Moreso F, Alonso A, Gentil MA, González-Molina M, Capdevila L, Marcén R, et al. Improvement in late renal allograft survival between 1990 and 2002 in Spain: results from a multicentre case-control study. Transpl Int. 2010; 23:907–13.
Go to :
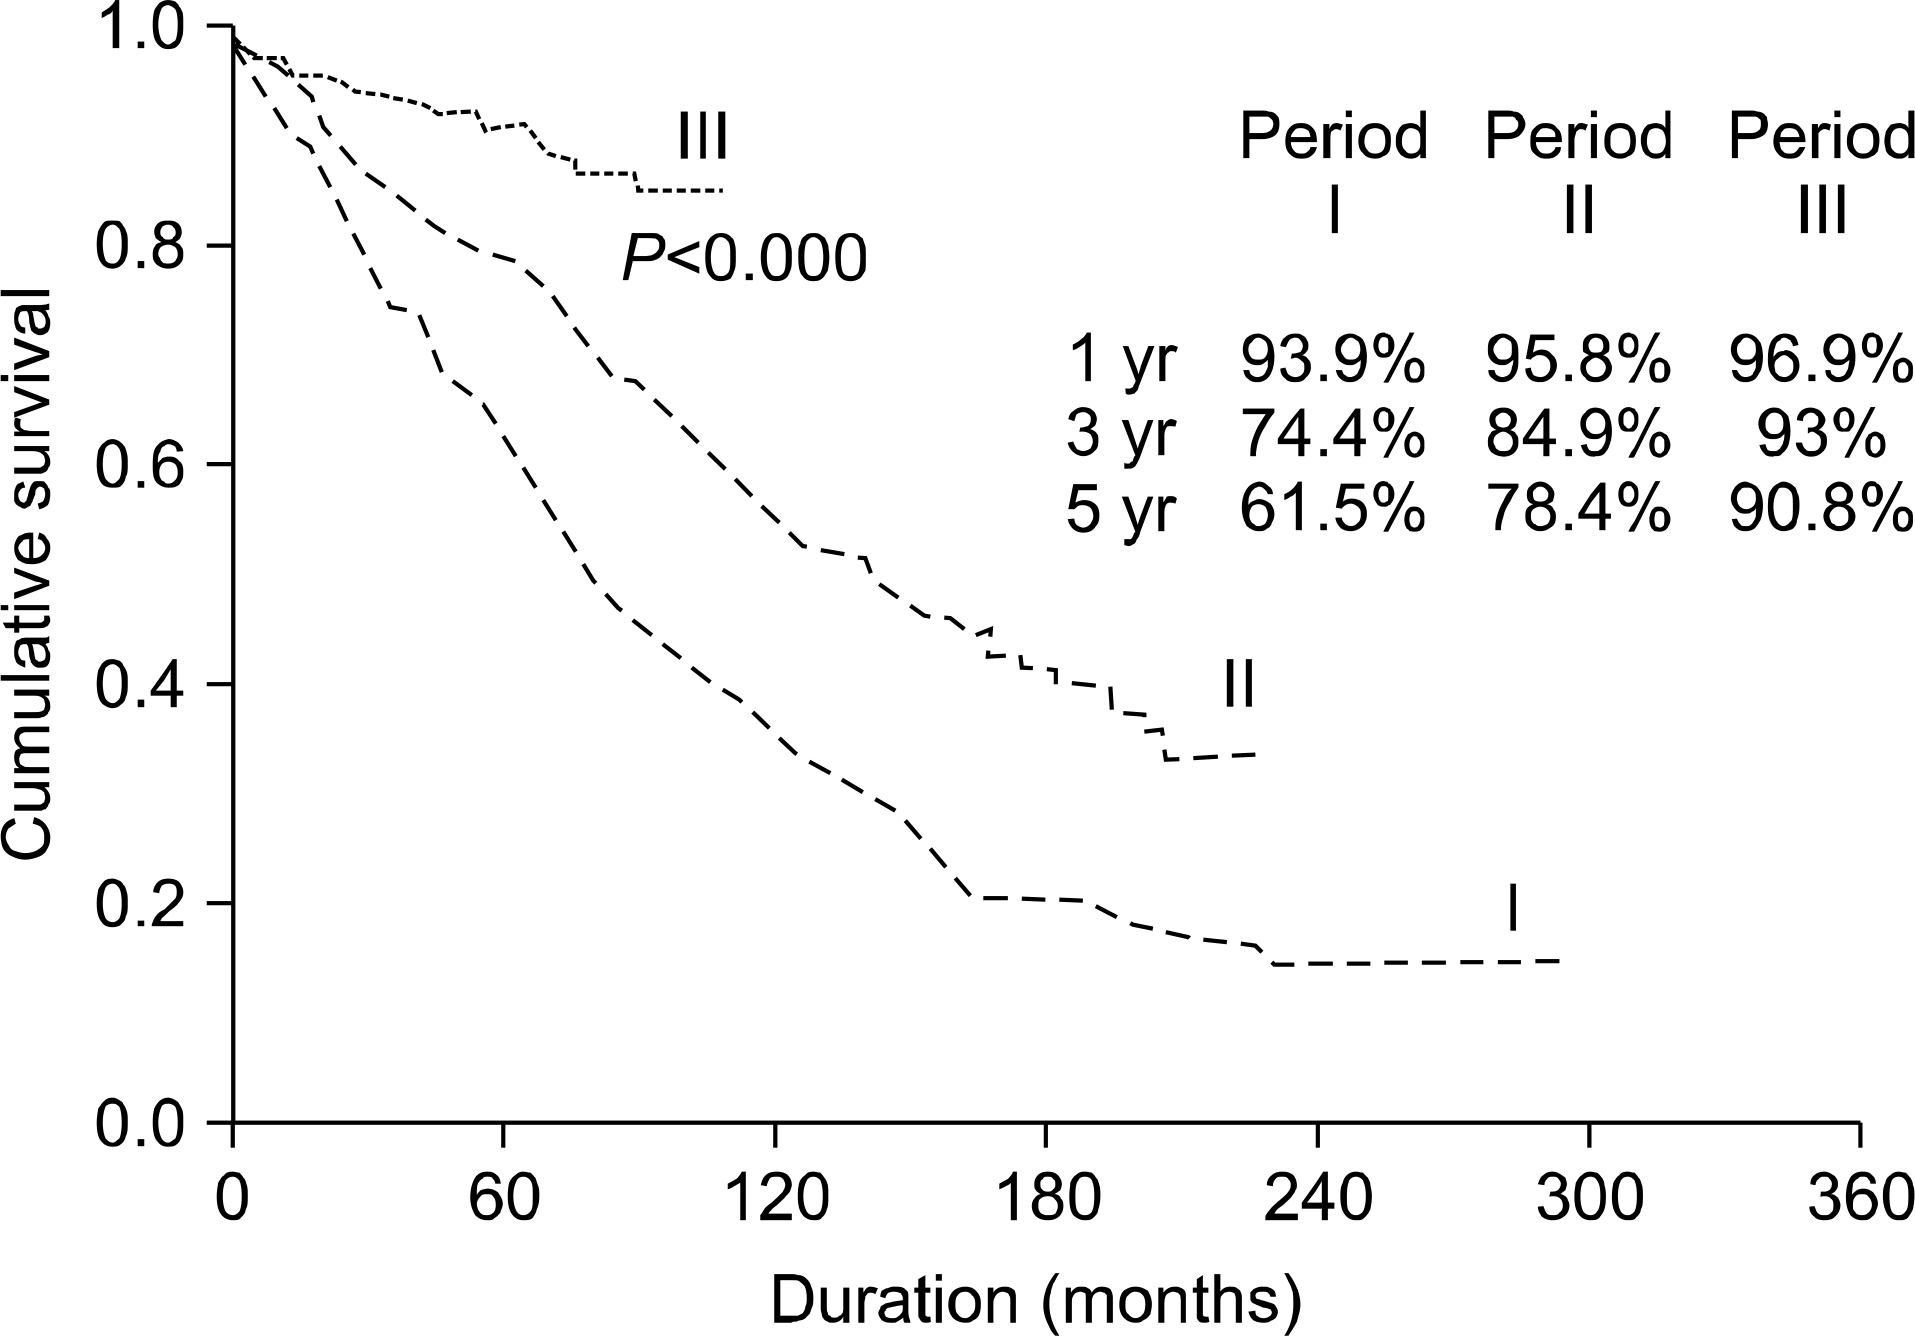 | Fig. 1.Graft survival rates according to period of transplantation by Kaplan-Meier analysis. |
Table 1.
Demographic characteristics
Table 2.
Causes of graft failure
Table 3.
Causes of patient's death with functioning graft
Table 4.
Outcomes of the patients according to periods of transplantation
Table 5.
Changes of causes of graft failure according to periods of transplantation
Table 6.
Comparison of demographic characteristics: patients with functioning graft vs. with failed graft
Table 7.
Risk factors for graft failure by binary regression analysis
 XML Download