Abstract
Background
Despite significant advances in immunosuppression, supportive therapies, and operative skills, several factors still compromise long-term graft survival of patients who undergo renal transplantation. This study was designed to evaluate the risk factors influencing graft outcomes of living donor renal transplantation. We matched the recipient and donor age, gender, and body mass index (BMI).
Methods
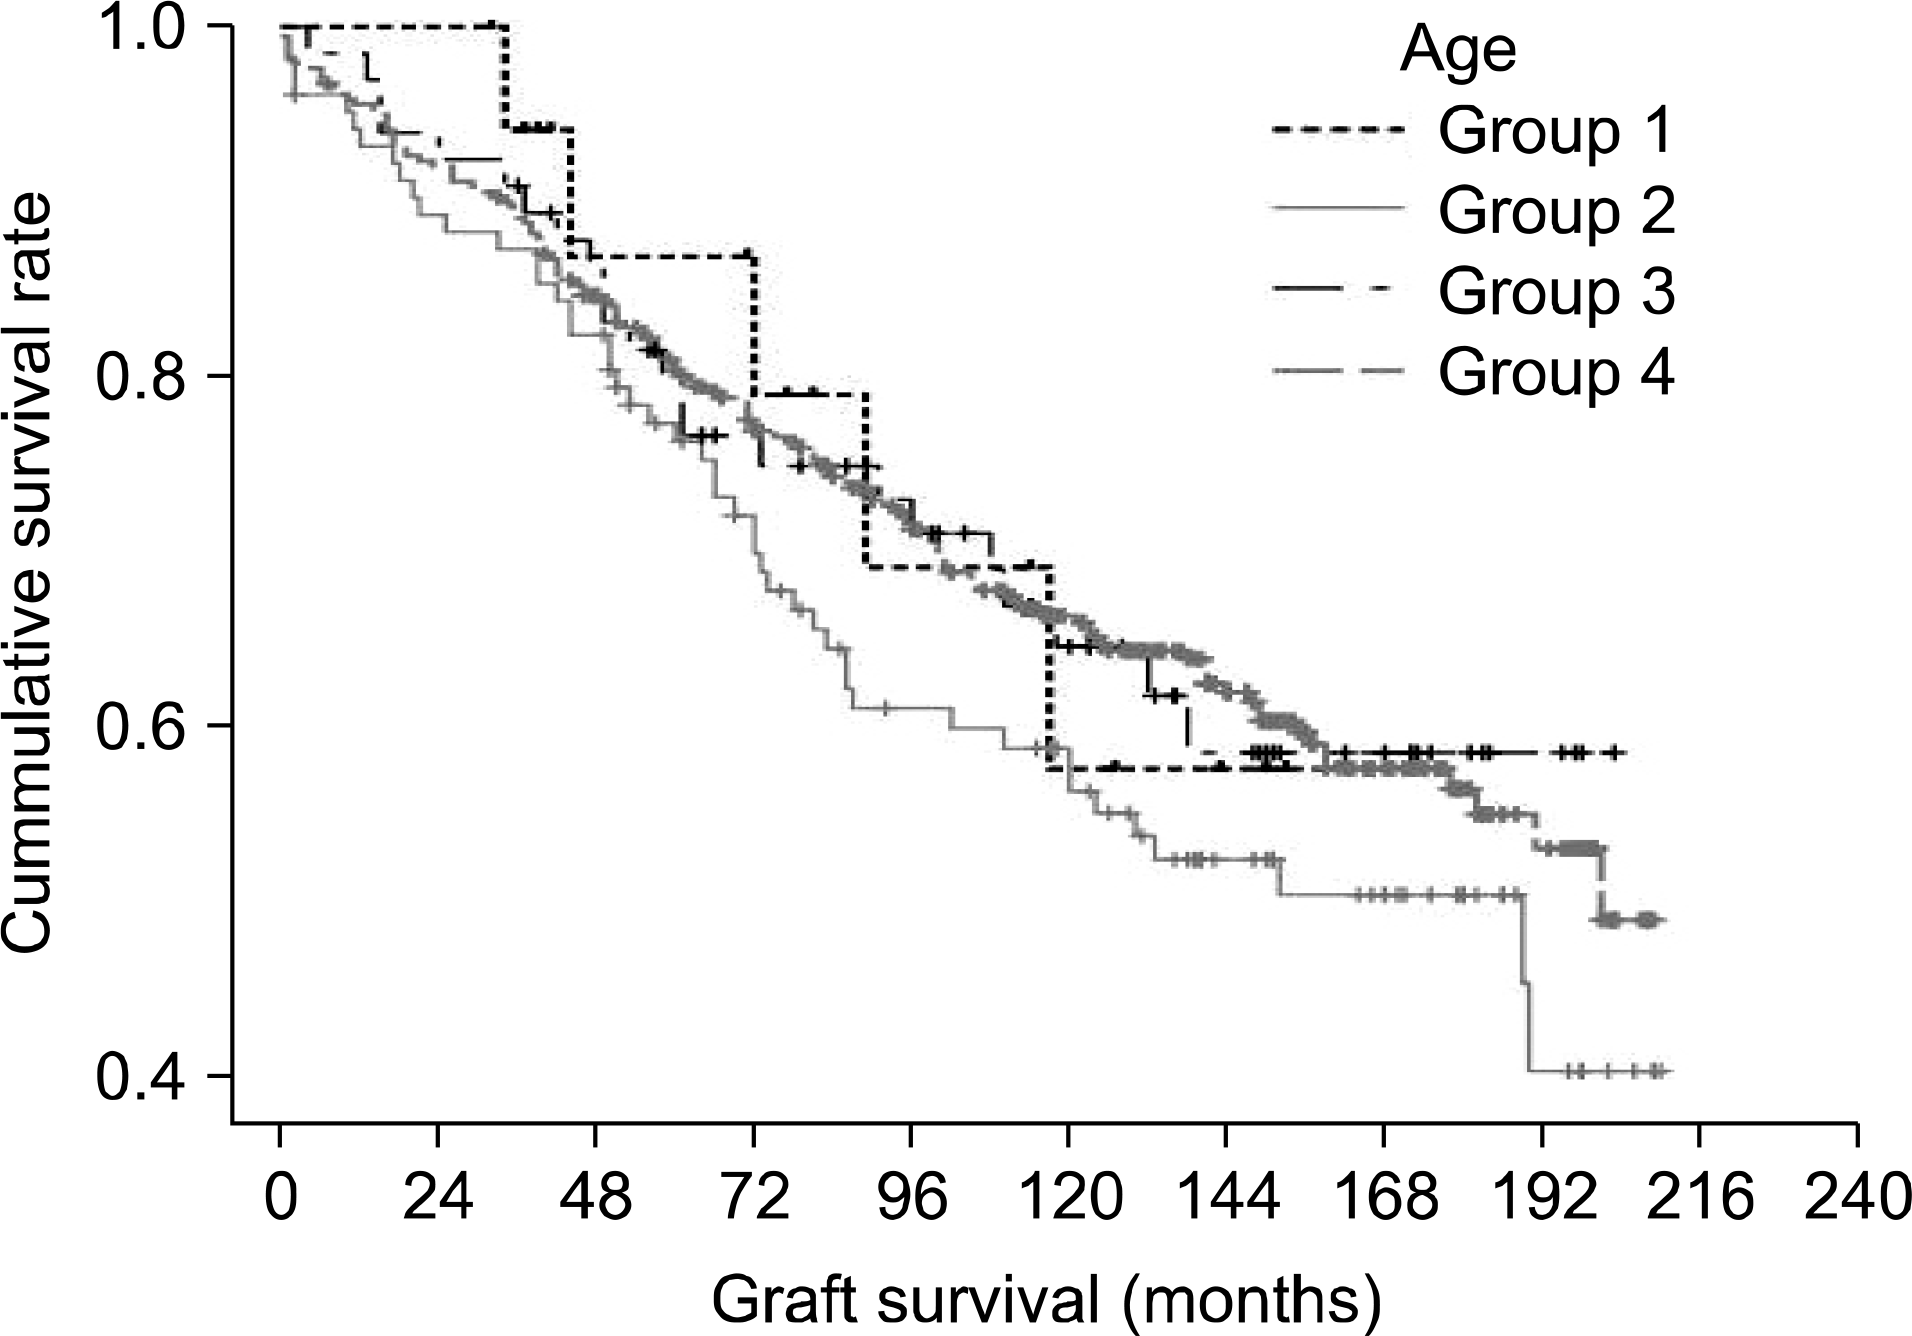
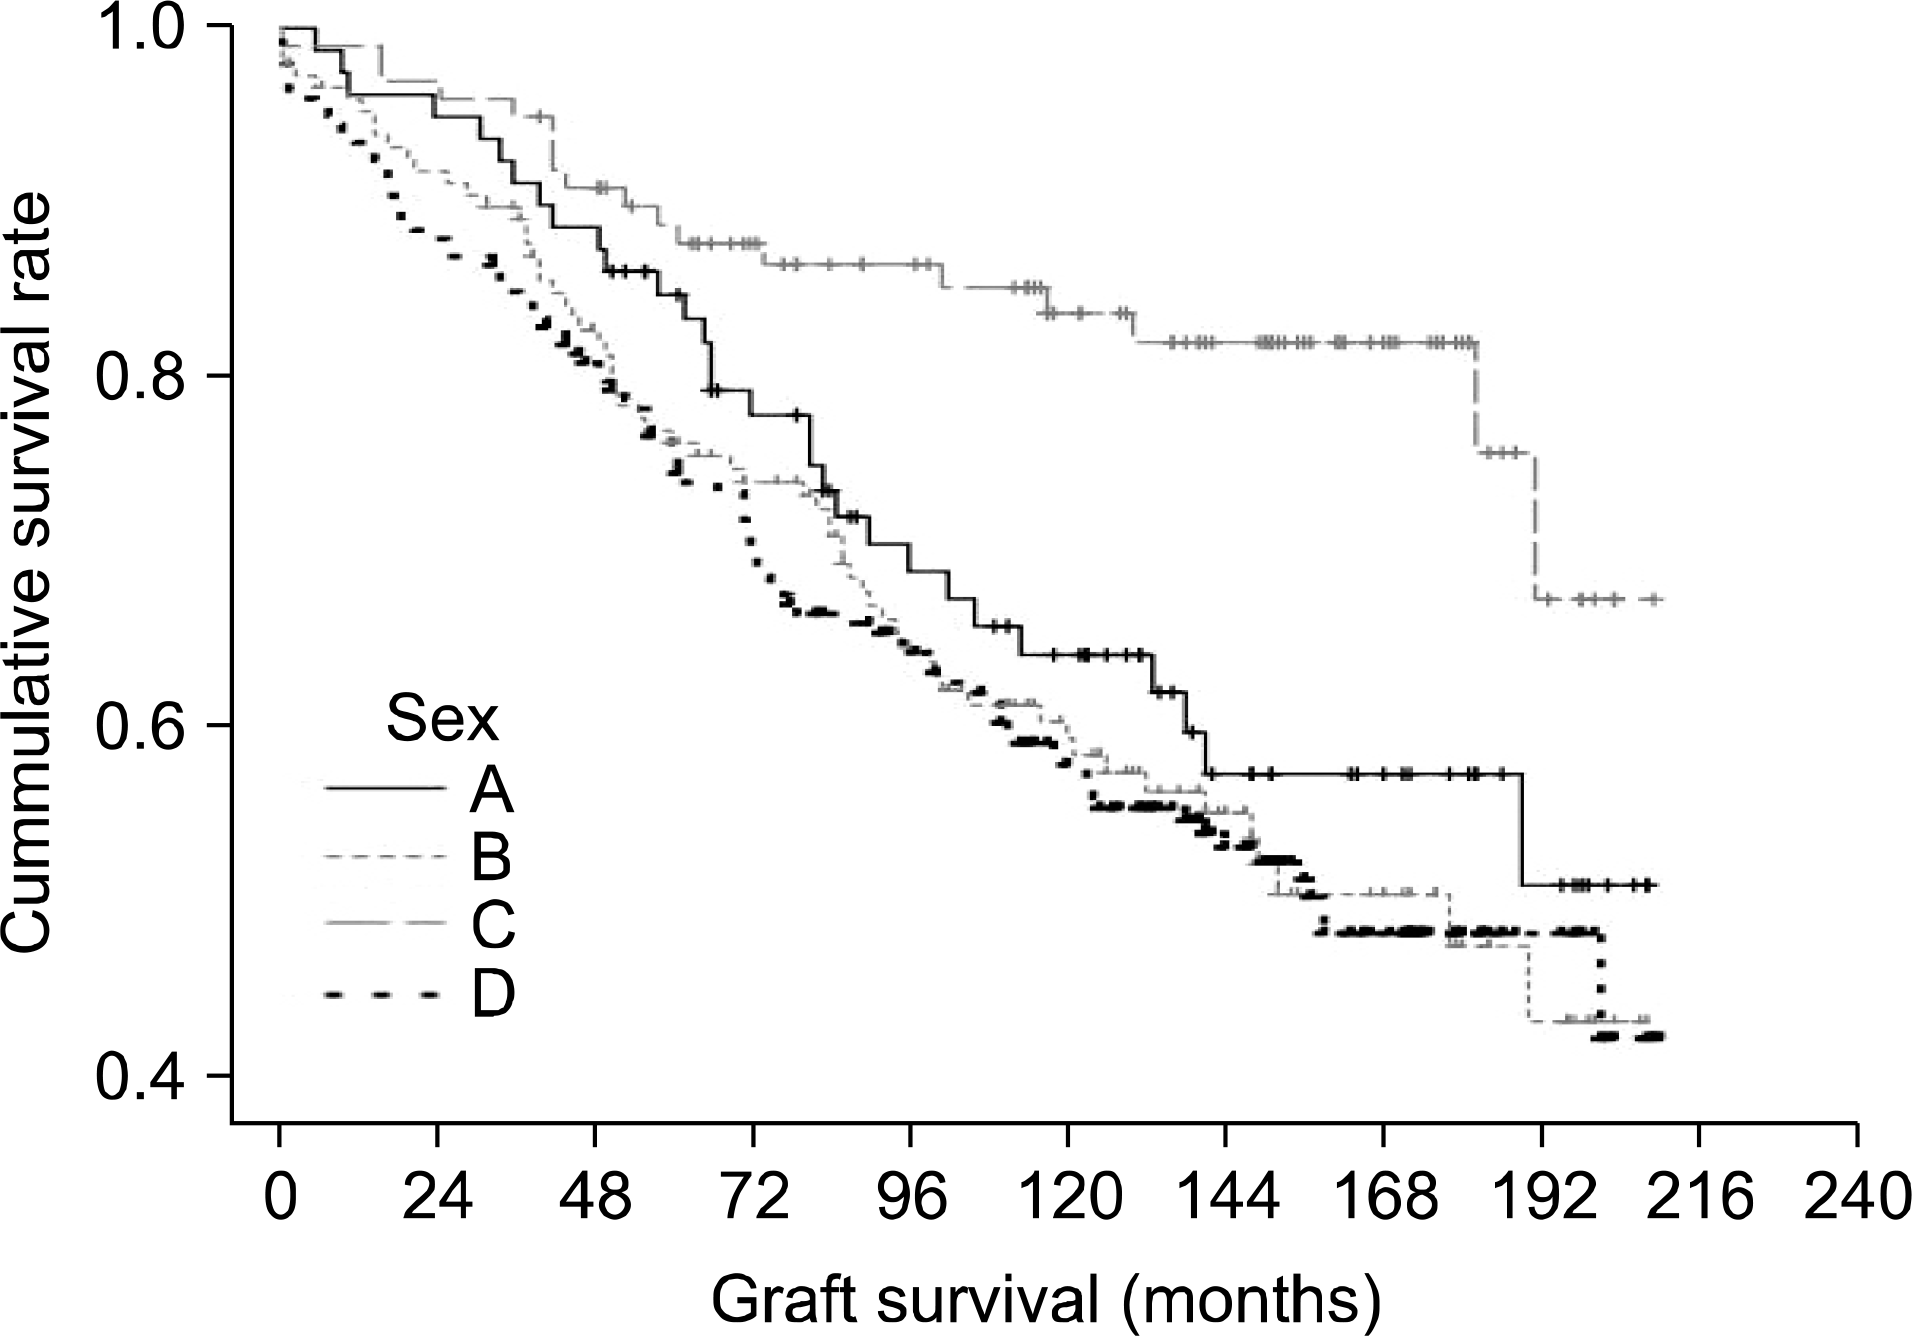
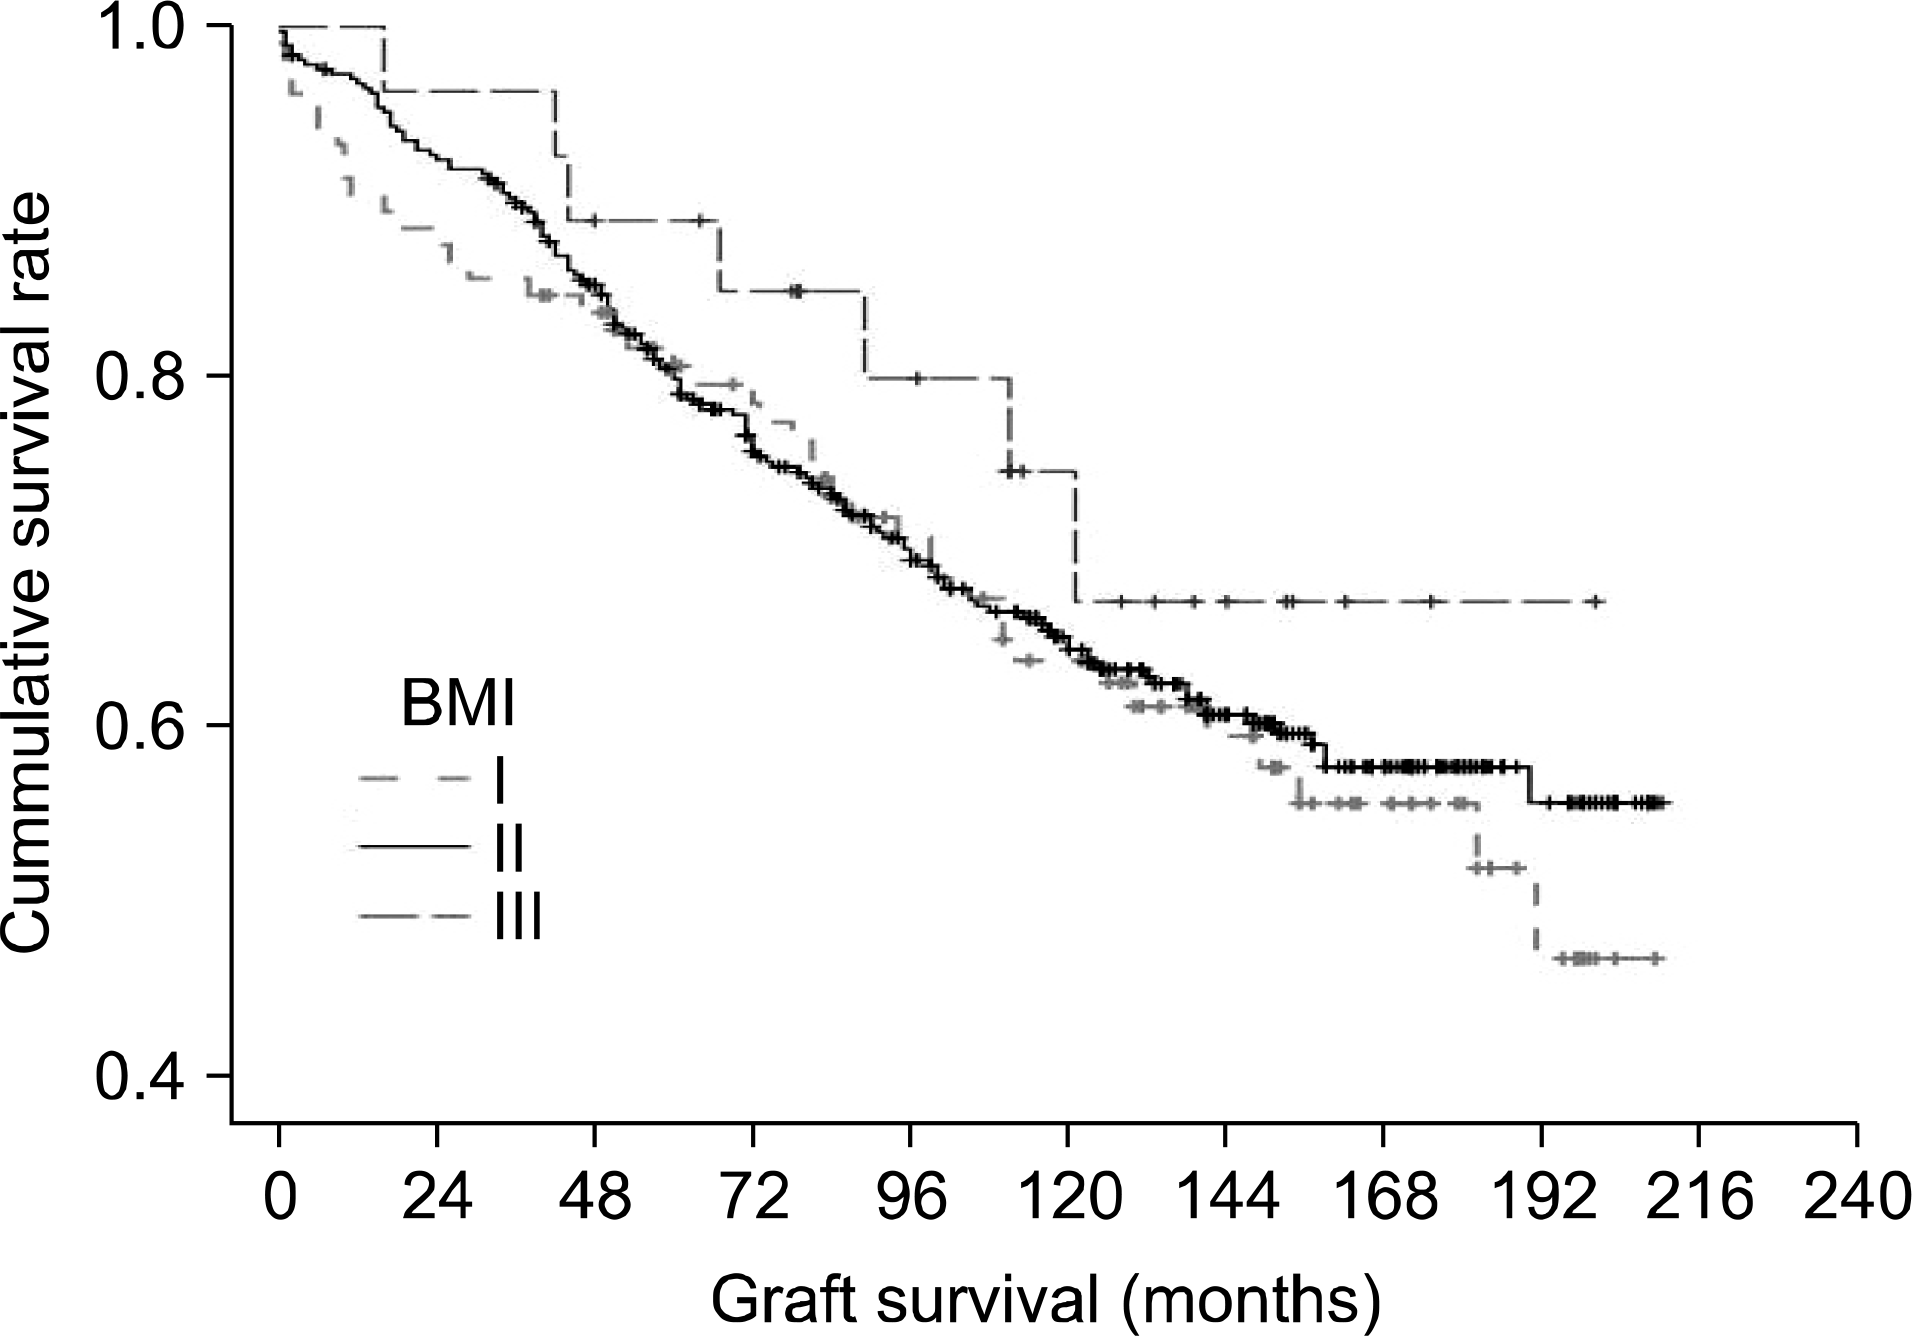
A total of 527 living renal transplantations were evaluated. The patients were divided into matching groups by donor and recipient age; group 1 (50≤/; 2, 50≤/<50; 3, <50/50≤; 4, <50/<50), gender (A, female/female; B, female/male; C, male/female; D, male/male), and BMI ratio (recipient/donor) (I, <0.8; II, 0.8≤/<1.3; III, 1.3≤). We compared 1, 3, 5, and 10 year graft survival and analyzed the donor and recipient variables of age, HLA matching, and acute rejection.
Results
The risk factors affecting long-term graft survival were recipient gender, acute rejection rate, and HLA-AB matching. In the groups divided according to donor and recipient age, no statistical difference was observed among the groups, but the 3–5 yr graft survival of group 1 (94.1/86.9%) was much higher than group 2 (86.5/75.6%). In the groups divided according to donor and recipient gender, graft survival in group C was higher than that in the other groups. No statistical difference in acute rejection or graft survival were observed in the groups with different BMI ratios.
Go to : 
References
1). Hariharan S, Johnson CP, Bresnahan BA, Taranto SE, McIntosh MJ, Stablein D. Improved graft survival after renal transplantation in the United States, 1988 to 1996. N Engl J Med. 2000; 342:605–12.

2). Wolfe RA, Ashby VB, Milford EL, Ojo AO, Ettenger RE, Agodoa LYC, et al. Comparison of mortality in all patients on dialysis, patients on dialysis awaiting transplantation, and recipients of a first cadaveric transplant. N Engl J Med. 1999; 341:1725–30.

3). Calne R. Clinical transplantation: current problems, possible solutions. Philos Trans R Soc Lond B Biol Sci. 2005; 360:1797–801.

4). Sims RJ, Cassidy MJ, Masud T. The increasing number of older patients with renal disease. BMJ. 2003; 327:463–4.

5). Harrison JH, Merrill JP, Murray JE. Renal homotransplantation in identical twins. Surg Forum. 1956; 6:432–6.
6). Hayes JM, Novick AC, Streem SB, Hodge EE, Bretan PN, Graneto D, et al. The use of single pediatric cadaver kidneys for transplantation. Transplantation. 1988; 45:106–10.
7). Alexander JW, Vaughn WK. The use of “marginal” donors for organ transplantation. The influence of donor age on outcome. Transplantation. 1991; 51:135–41.

8). Remuzzi G, Cravedi P, Perna A, Dimitrov BD, Turturro M, Locatelli G, et al. .;. Dual Kidney Transplant Group. Long-term outcome of renal transplantation from older donors. N Engl J Med. 2006; 354:343–52.

9). Gjertson DW, Cecka JM. Living unrelated donor kidney transplantation. Kidney Int. 2000; 58:491–9.

10). Koo DD, Welsh KI, McLaren AJ, Roake JA, Morris PJ, Fuggle SV. Cadaver versus living donor kidneys: impact of donor factors on antigen induction before transplantation. Kidney Int. 1999; 56:1551–9.

11). Halloran PF, Melk A, Barth C. Rethinking chronic allograft nephropathy: the concept of accelerated senescence. J Am Soc Nephrol. 1999; 10:167–81.
12). Opelz G, Wujciak T, Döhler B, Scherer S, Mytilineos J. HLA compatibility and organ transplant survival. Collaborative Transplant Study. Rev Immunogenet. 1999; 1:334–42.
13). Mange KC, Joffe MM, Feldman HI. Effect of the use or nonuse of longterm dialysis on the subsequent survival of renal transplants from living donors. N Engl J Med. 2001; 344:726–31.

14). Meier-Kriesche HU, Kaplan B. Waiting time on dialysis as the strongest modifiable risk factor for renal transplant outcomes: a paired donor kidney analysis. Transplantation. 2002; 74:1377–81.
15). Basar H, Soran A, Shapiro R, Vivas C, Scantlebury VP, Jordan ML, et al. Renal transplantation in recipients over the age of 60: the impact of donor age. Transplantation. 1999; 67:1191–3.
16). Bilgin N, Karakayali H, Moray G, Demirağ A, Arslan G, Akkoç H, et al. Outcome of renal transplantation from elderly donors. Transplant Proc. 1998; 30:744–6.

17). Busson M, Benoit G. Is matching for sex and age beneficial to kidney graft survival? Clin Transplant. 1997; 11:15–8.
18). Cohen B, Smits JM, Haase B, Persijn G, Vanrenterghem Y, Frei U. Expanding the donor pool to increase renal transplantation. Nephrol Dial Transplant. 2005; 20:34–41.

19). Fritsche L, Hörstrup J, Budde K, Reinke P, Giessing M, Tullius , et al. Old-for-old kidney allocation allows successful expansion of the donor and recipient pool. Am J Transplant. 2003; 3:1434–9.

20). Park K, Suh JS, Kim YS, Kim SI. Living-donor renal transplantation, univariate analysis of risk factors influencing renal allograft outcome from 500 cases. J Korean Surg Soc. 1991; 41:616–27. (박기일, 서재석, 김유선, 김순일. 생체신이식 500예를 대상으로 분석한 이식성적에 영향을 미치는 인자에 관한 연구. 대한외과학회지 1991;41: 616–27.).
21). Nicholson ML, Windmill DC, Horsburgh T, Harris KP. Influence of allograft size to recipient bodyweight ratio on the longterm outcome of renal transplantation. Br J Surg. 2000; 87:314–9.

Go to : 
 | Fig. 1.Graft survival according to age matching (donor/recipient). Group 1, 50≤/50≤; Group 2, 50≤/<50; Group 3, <50/50≤; Group 4, <50/<50. In the groups according to donor and recipient age, there was no statistical difference among the groups (P=0.230) |
 | Fig. 2.Graft survival according to matching gender (donor/recipient). Group A, female/female; Group B, female/male; Group C, male/female; Group D, male/male. Graft survival in group C was higher than that in the other groups (Group A, P=0.006; Group B, P<0.001; Group D, P<0.001). |
 | Fig. 3.Graft survival according to body mass index (BMI) ratio (recipient/donor). Group I, <0.8; Group II, 0.8≤/<1.3; Group III, 1.3≤. No statistical difference in graft survival was observed in the groups with different BMI ratios. Abbreviation: BMI, body mass index. |
Table 1.
Factors influencing long-term graft survival
Table 2.
Characteristics of study population group according to donor and recipient age
Table 3.
Characteristics of study population group according to donor and recipient gender
Table 4.
Characteristics of study population group according to body mass index (BMI) ratio (recipient/donor)


 PDF
PDF ePub
ePub Citation
 Print
Print


 XML Download