

 PDF
PDF ePub
ePub Citation
 Print
Print


Abstract
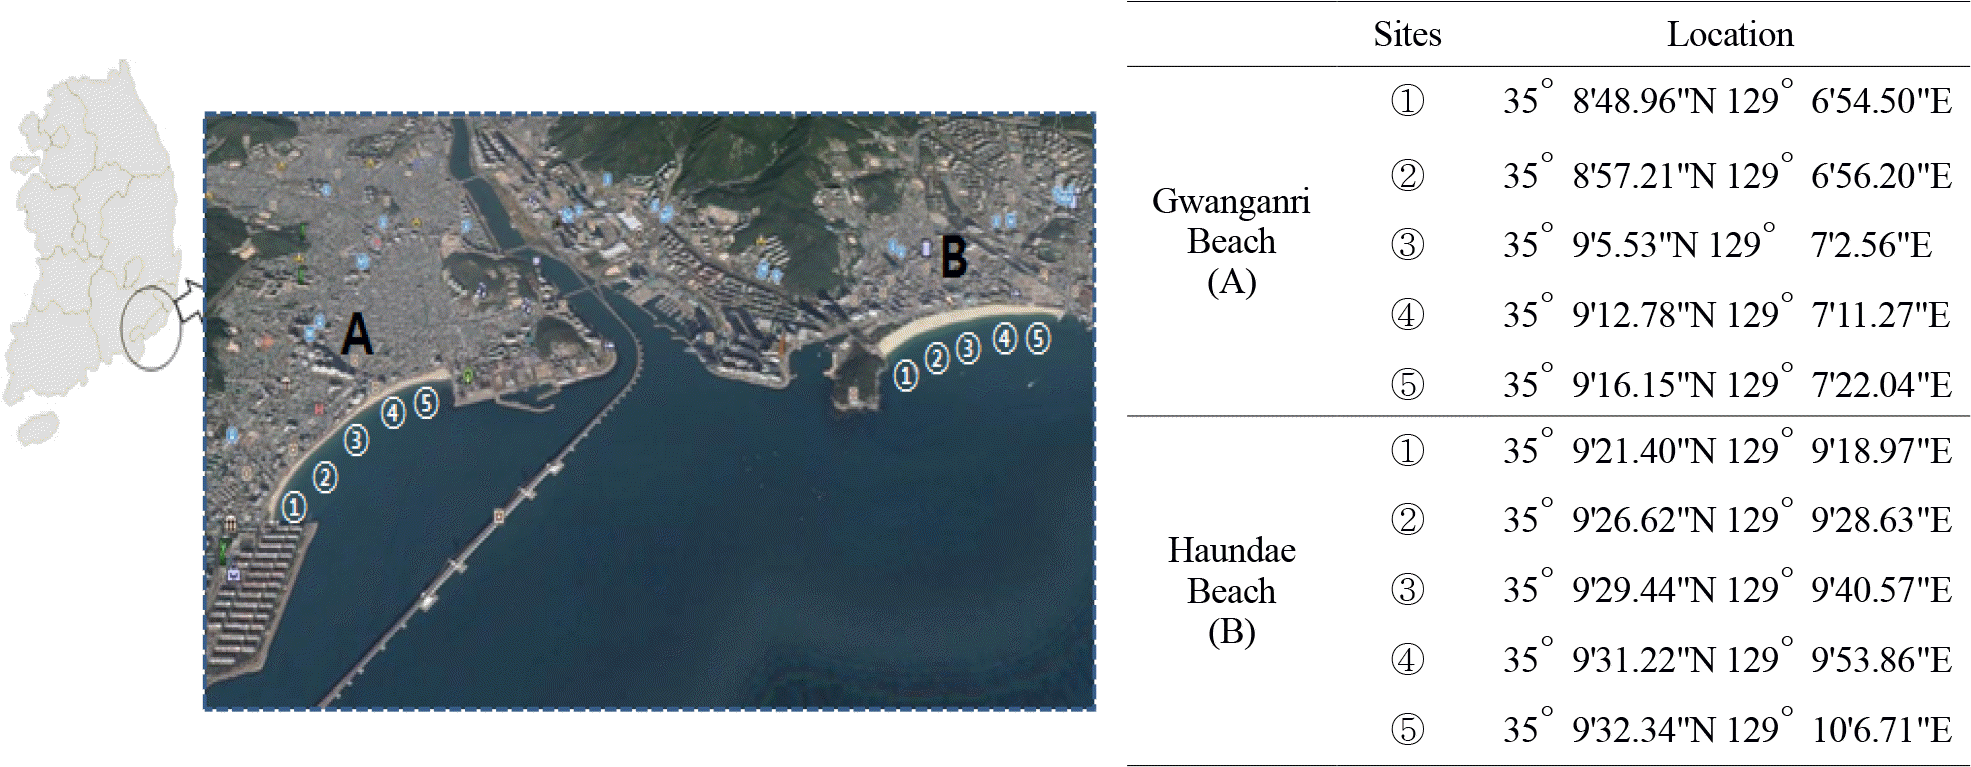
The associations between storm events, urban runoff and costal water quality have not been well investigated in Korea. A temporal and spatial analysis during summer, 2015 was conducted to determine associates between urban runoff and fecal indicator bacteria (Escherichia coli, Enterococcus) levels at two popular coastal beaches (Gwanganri beach and Haundae beach) in Busan. In this study, a clear relationship between rainfall and elevated number of indicators was observed. Two beaches met the costal beach water health standards after less than 3.0 mm of rain. Only for storms less than 2.5 mm was no observable rainfall effect. Our results revealed that exceedances were greatest in 5 hours following 41.0~45.5 rainfall, then declined the bacterial concentrations in 8 hours after the storm and they generally returned to levels below water health standards within 10~14 hours. But it took 2.7 days to get the level of water quality of dry days. The time required for water quality recovery depends on the intensity and duration of rainfall. In the event of intense rainfall issuance of beach closure by public authorities is warranted to protect public health.
Go to : 
REFERENCES
1). The Annual Report of Busan Metropolitan City Institute of Health & Environment. 2002-2014. 12–24.
2). Drew A, Stephen BW. Relationship between rainfall and beach bacterial concentrations on Santa Monica Bay beaches. J Water Health. 2003; 1:85–9.
3). Weiwei Z, Juying W, Jingfeng F, Dalu G, Hongyan J. Effects of rainfall on microbial water quality on Qingdao No. 1 Bathing Beach, China. Marine Pollution Bulletin. 2013; 66:185–90.

4). Rachel TN, Stephen BW, Molly KL, Charles DM, John HD, Patricia Vainik, et al. Storm effects on regional beach water quality along the southern California shoreline. J Water Health. 2013; 1:23–31.
5). Dwight RH, Semenza JC, Baker DB, Olson BH. Association of urban runoff with coastal water quality in Orange county, California. Water Environ Research. 2002; 74:83–90.
6). Ann TS, Seo EY, Han JM. Water quality monitoring in the eastern coast of Korea. Korea Marine Pollution Response Corp. Report. 2013.
7). Byeon SJ, Choi GW, Jo HG. A study on discharged coliform into coastal bathing water after rainfall event. J Korean Soc Hazard Mitig. 2011; 11:337–43.
8). He LM, He ZL. Water quality prediction of marine recreational beaches Receiving watershed base flow and storm water runoff in southern California, USA. Water Research. 2008; 42:2563–73.
9). County of San Diego. 2015. http://www.sdbeachinfo.com.
10). State of Wisconsin. 2015. http://www.beachapedia.org/State_of_the_Beach/State_Reports/WI/Water_Quality.
11). EPA annual report, USA. 2006-2007.
12). Haeundae-Gu. 2015. http://sunnfun.haeundae.go.kr.
13). Suyeong-Gu. 2015. http://www.suyeong.go.kr/gwangalli/main.asp.
14). Korea Meteorological Administration. 2015. http://www.-kma.go.kr.
15). Korea Hydrographic and Oceanographic Agency. 2015. http://www.khoa.go.kr.
16). Kim JM, Jheong WH, Choi HJ. Inactivation rate of Enterococci and total Coliforms in fresh water and sea water. J Kor Soc on Water Quality. 2009; 25:136–41.
17). McFeters GA. Drinking water microbiology: Progress and recent developments. New York: Springer;1990.
18). Kim JM, Jheong WH, Chung HM, Won SM. Total coliforms viability in effluent of wastewater treatment plant discharged into the ocean. J Kor Soc on Water Quality. 2007; 23:12–8.
19). Noble RT, Lee IM, Schiff KC. Inactivation of indicator microorganism from various sources of faecal contamination in seawater and freshwater. J Appl Microbiol. 2004; 96:464–72.
20). Shin SG, Bak KH. Development of integrated Suyeong river watershed management strategy. Busan Development Institute Research paper. 2013. 30–32.
21). Ole Mark, Anders Erichsen. Towards Implementation of the new EU Bathing Water Directive-Case studies. Copenhagen & Arhus, Denmark: NOVATECH;2007.
Go to :
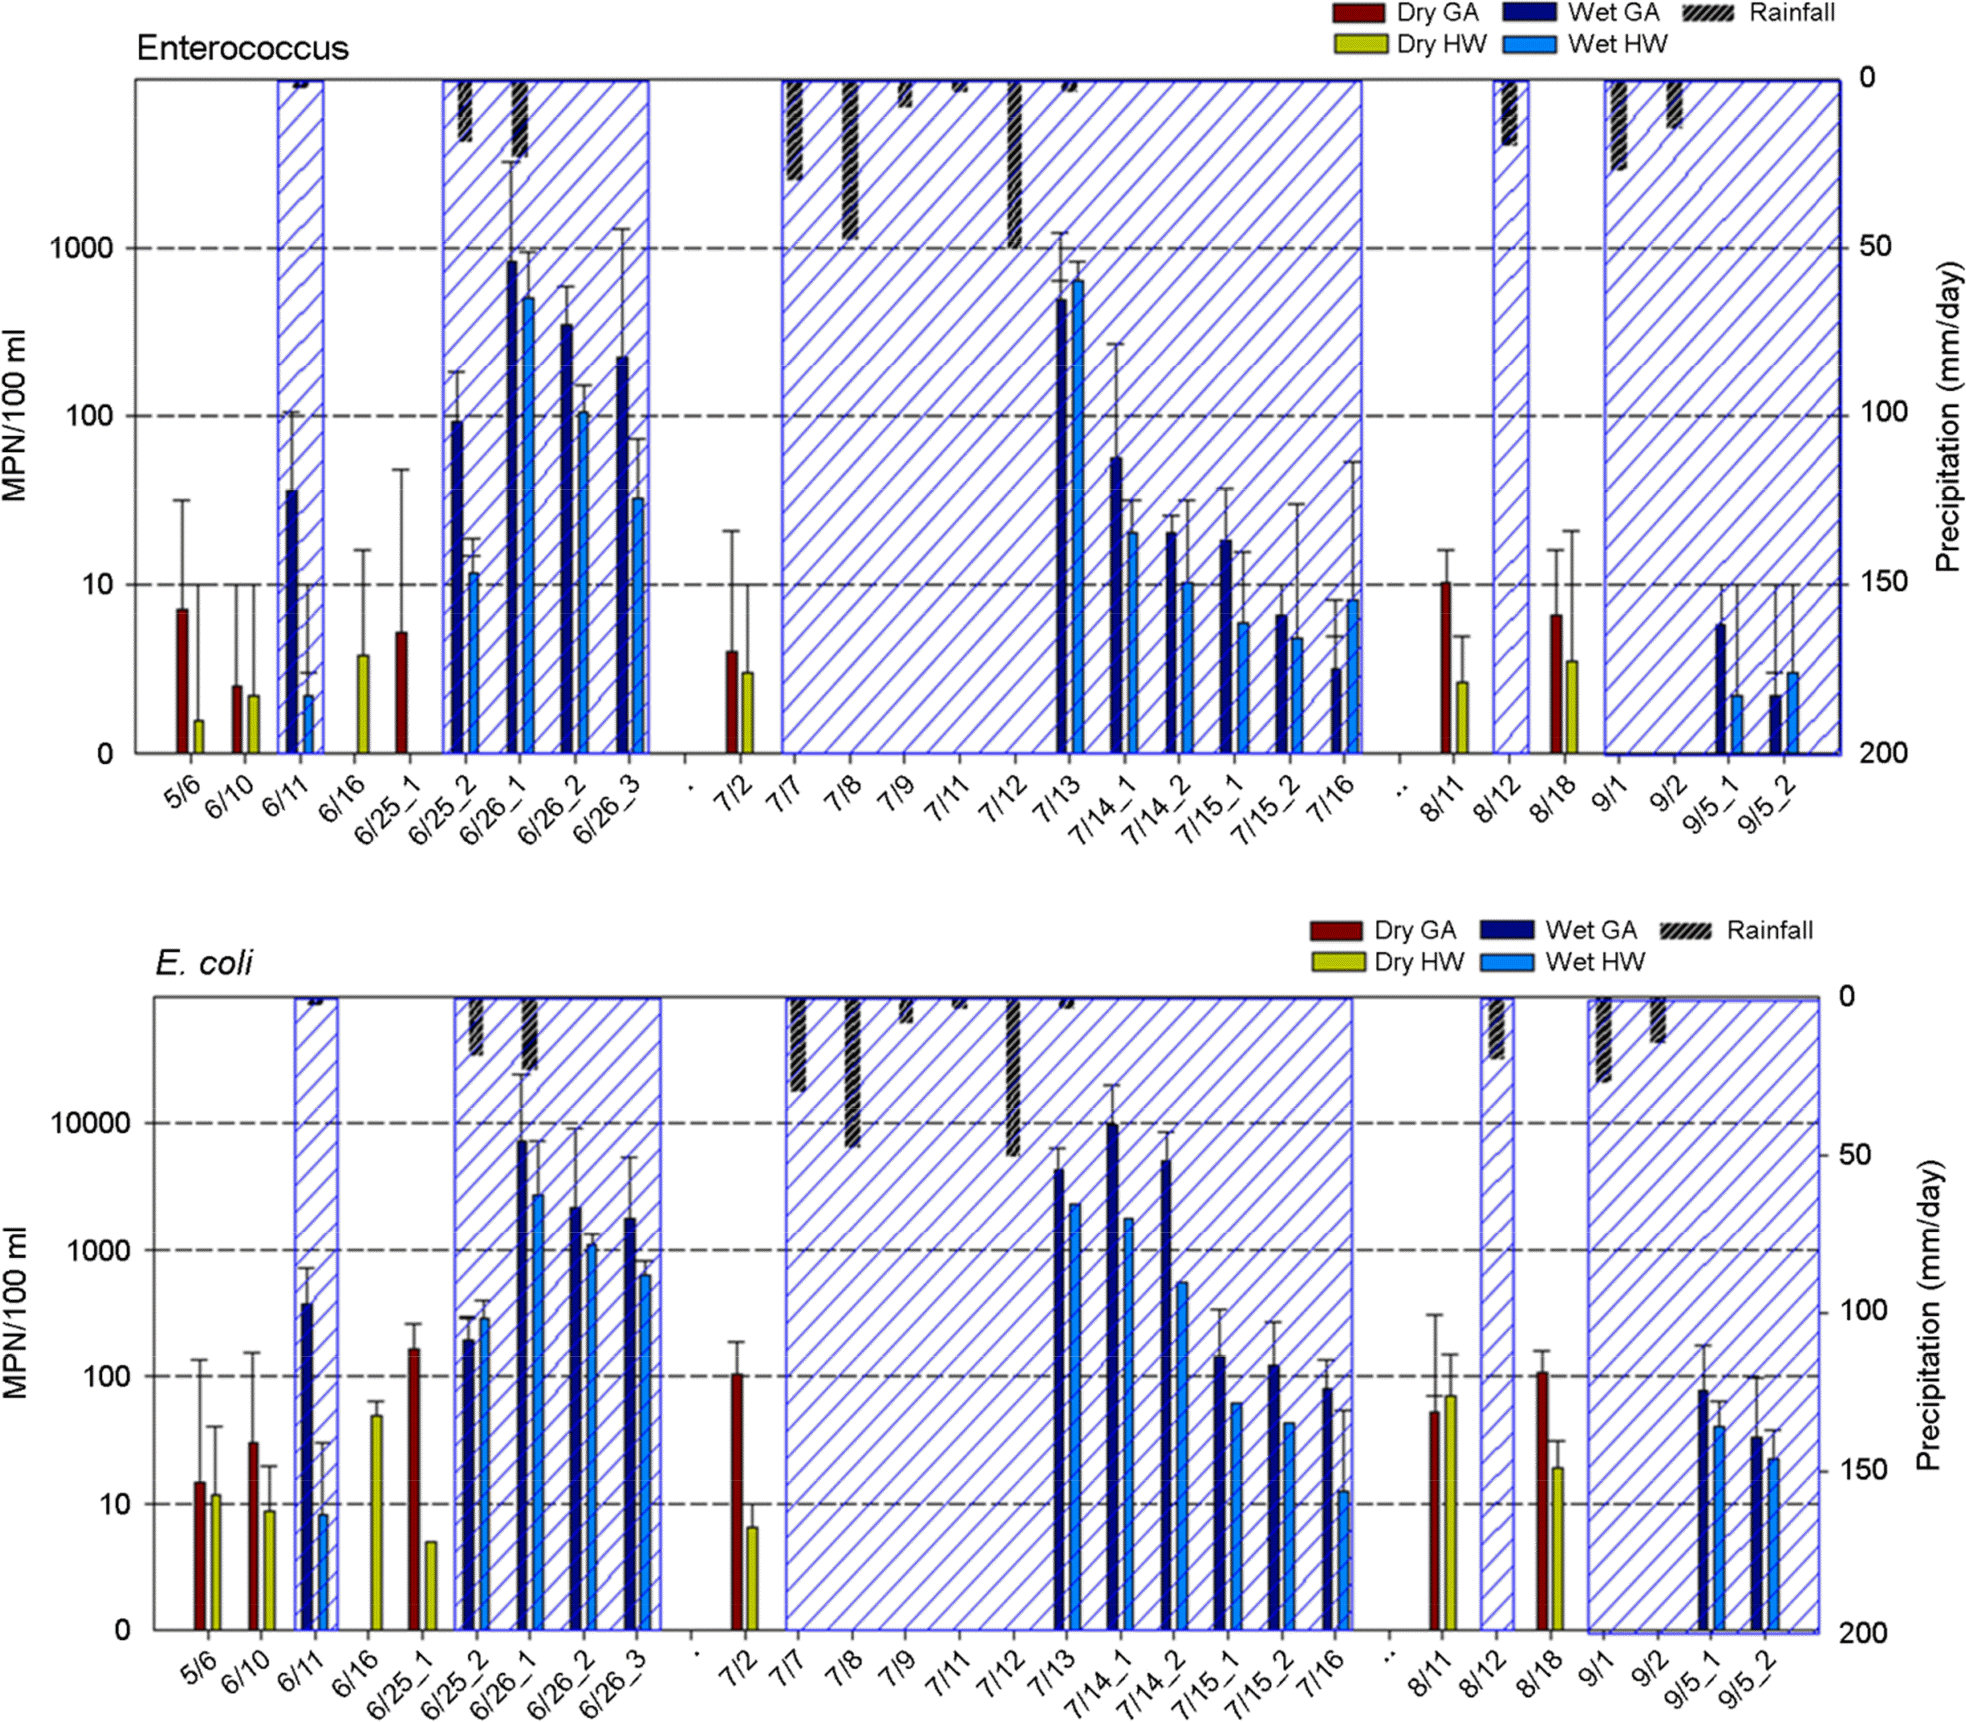 | Figure 2.Variability of Enterococcus and E. coli at Haeundae (HW) and Gwanganri (GA) in Dry days (Dry) and Wet days (Wet). The stripes indicate wet days. |
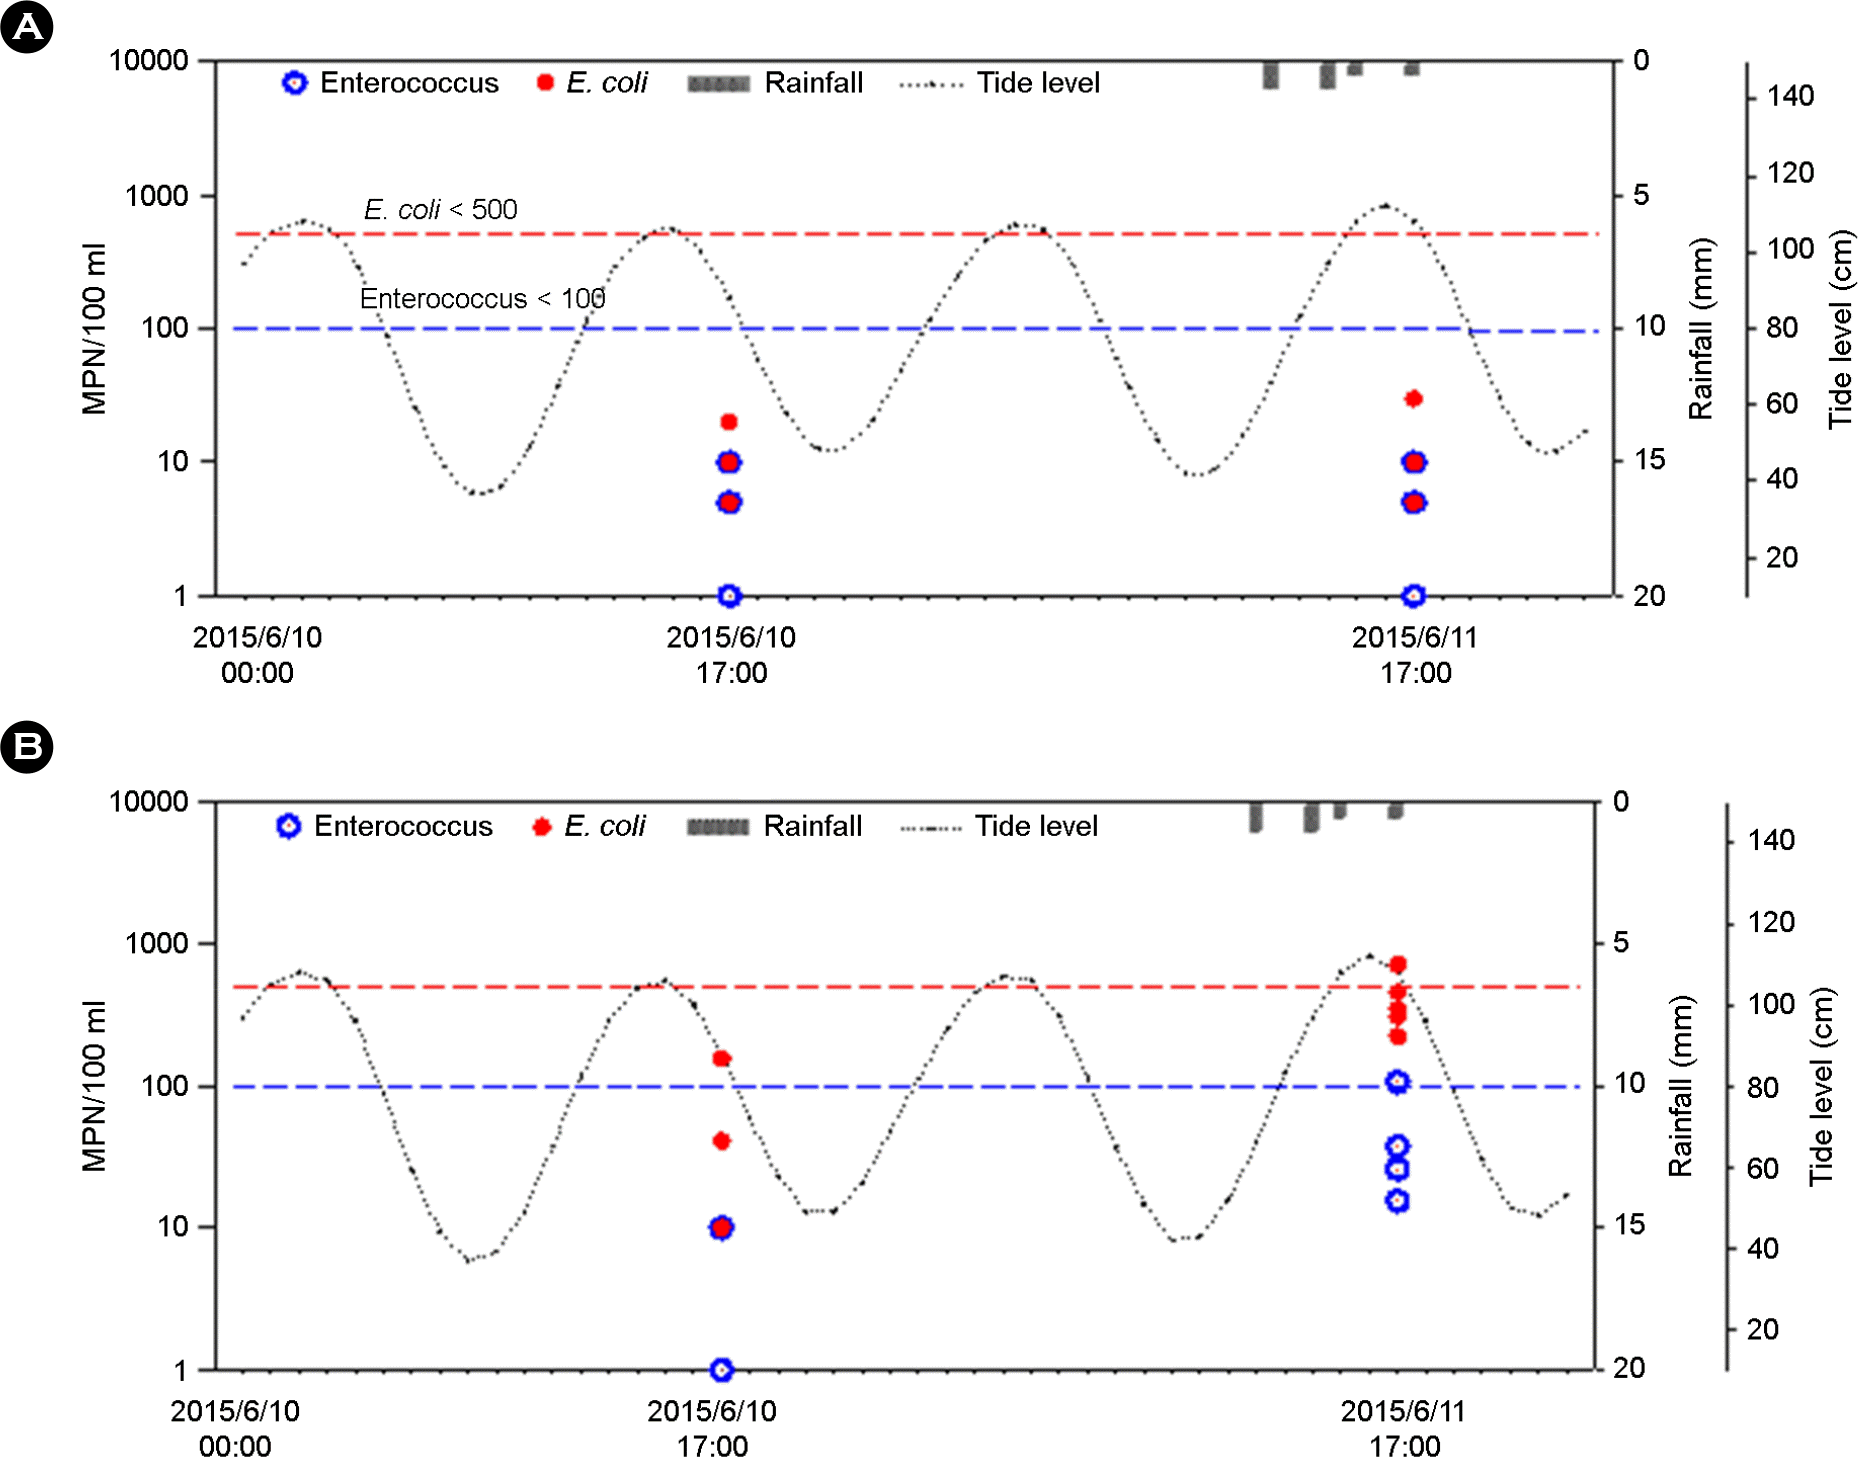 | Figure 3.3.0 mm Rainfall for 5.5 hours and concentration of Enterococcus and E. coli at 5 sampling sites of Haeundae (A) and Gwanganri (B). The dot lines indicate costal beach water health standards. |
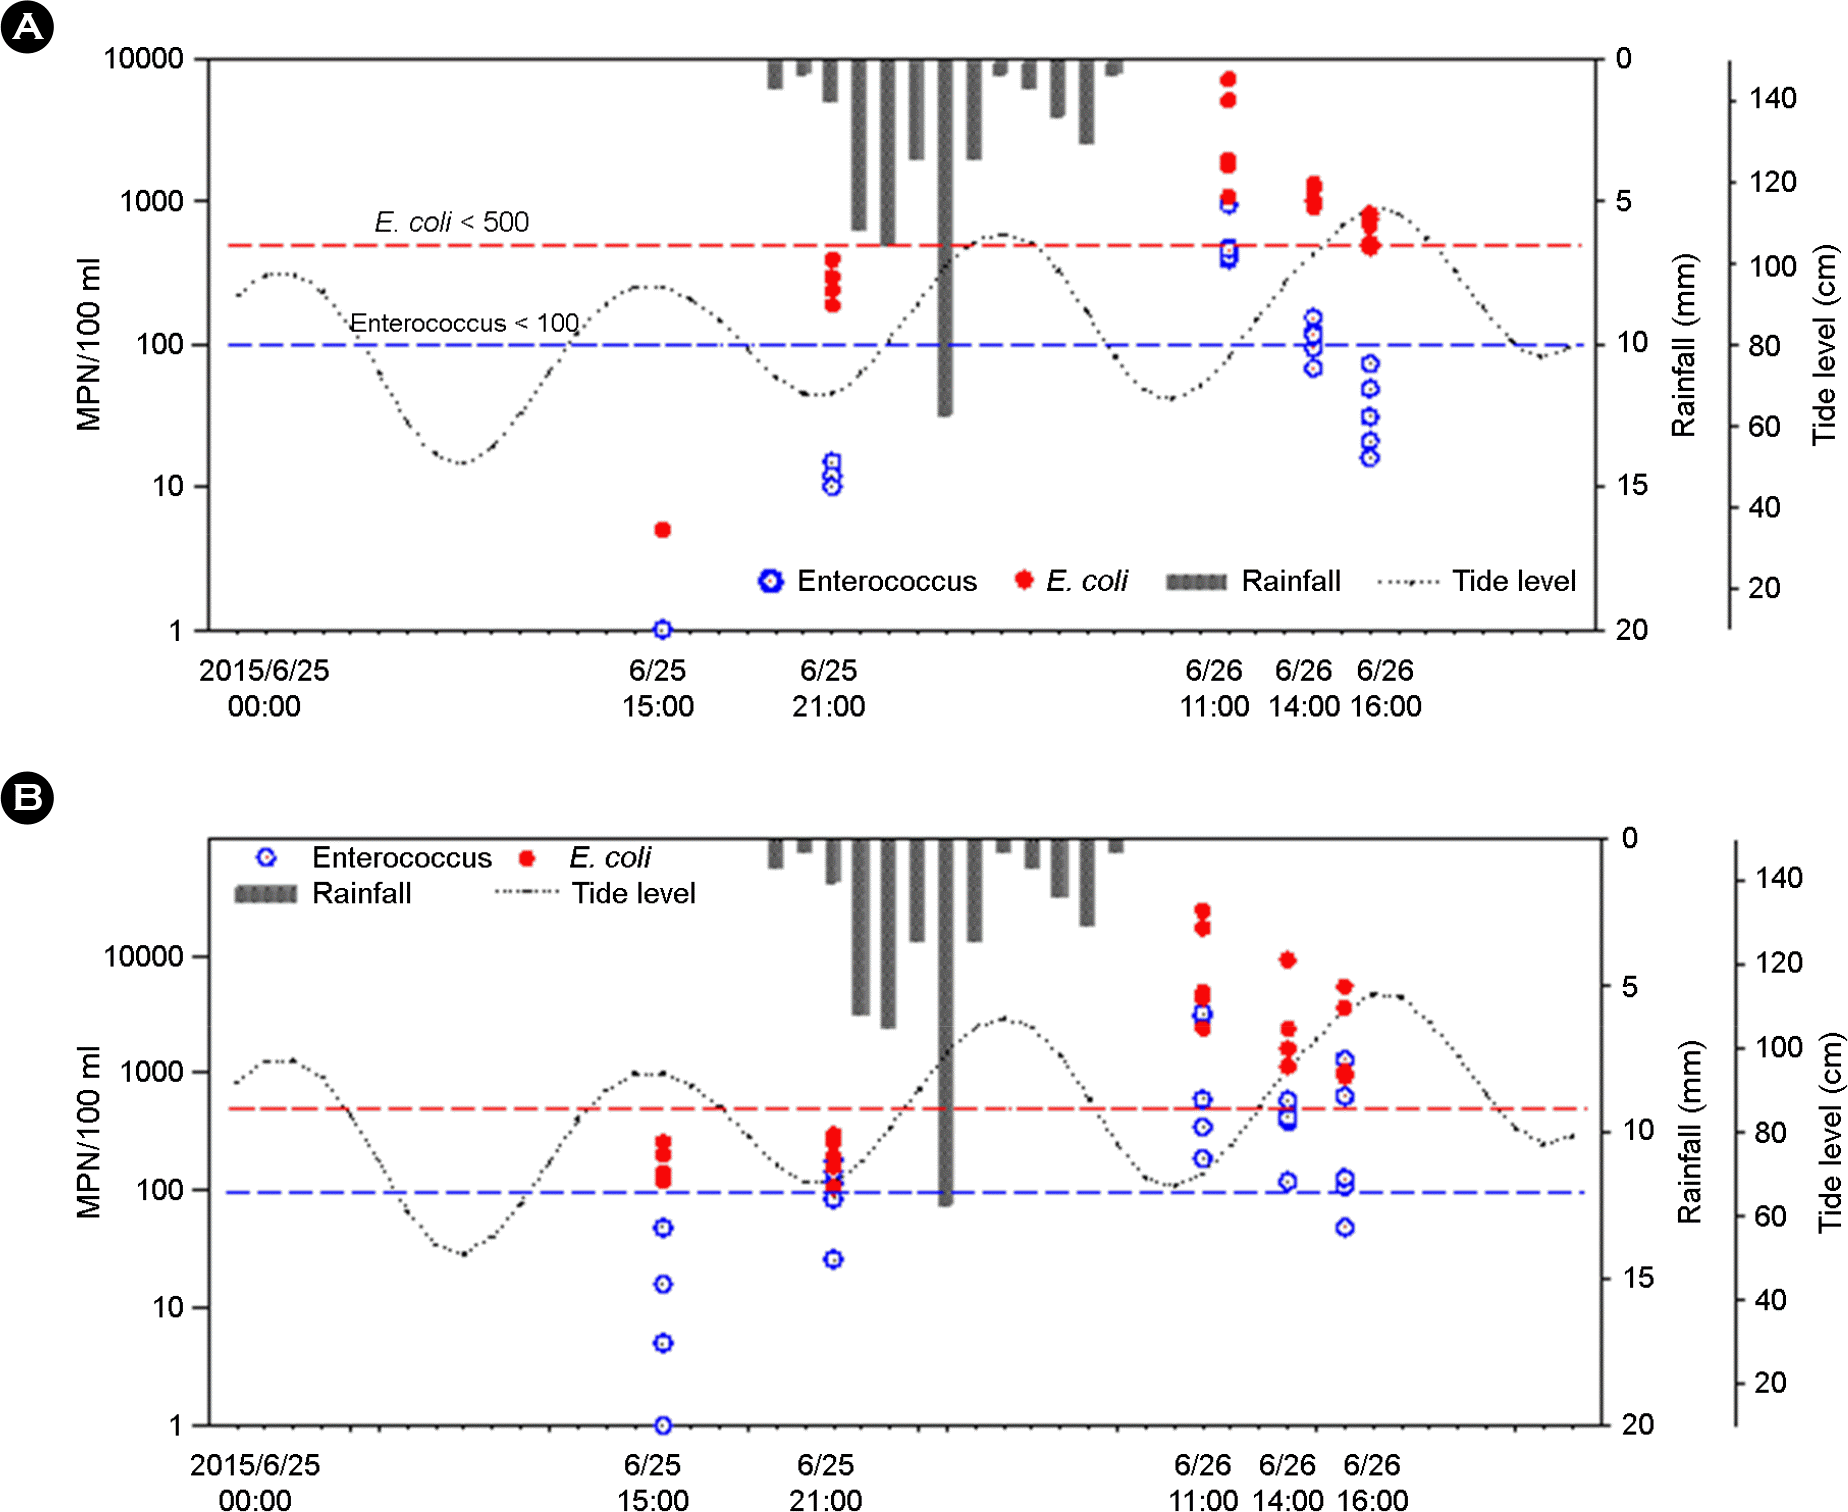 | Figure 4.41.5 mm rainfall for 11.5 hours and concentration of Enterococcus and E. coli at 5 sampling sites of Haeundae (A) and Gwanganri (B). The dot lines indicate costal beach water health standards. |
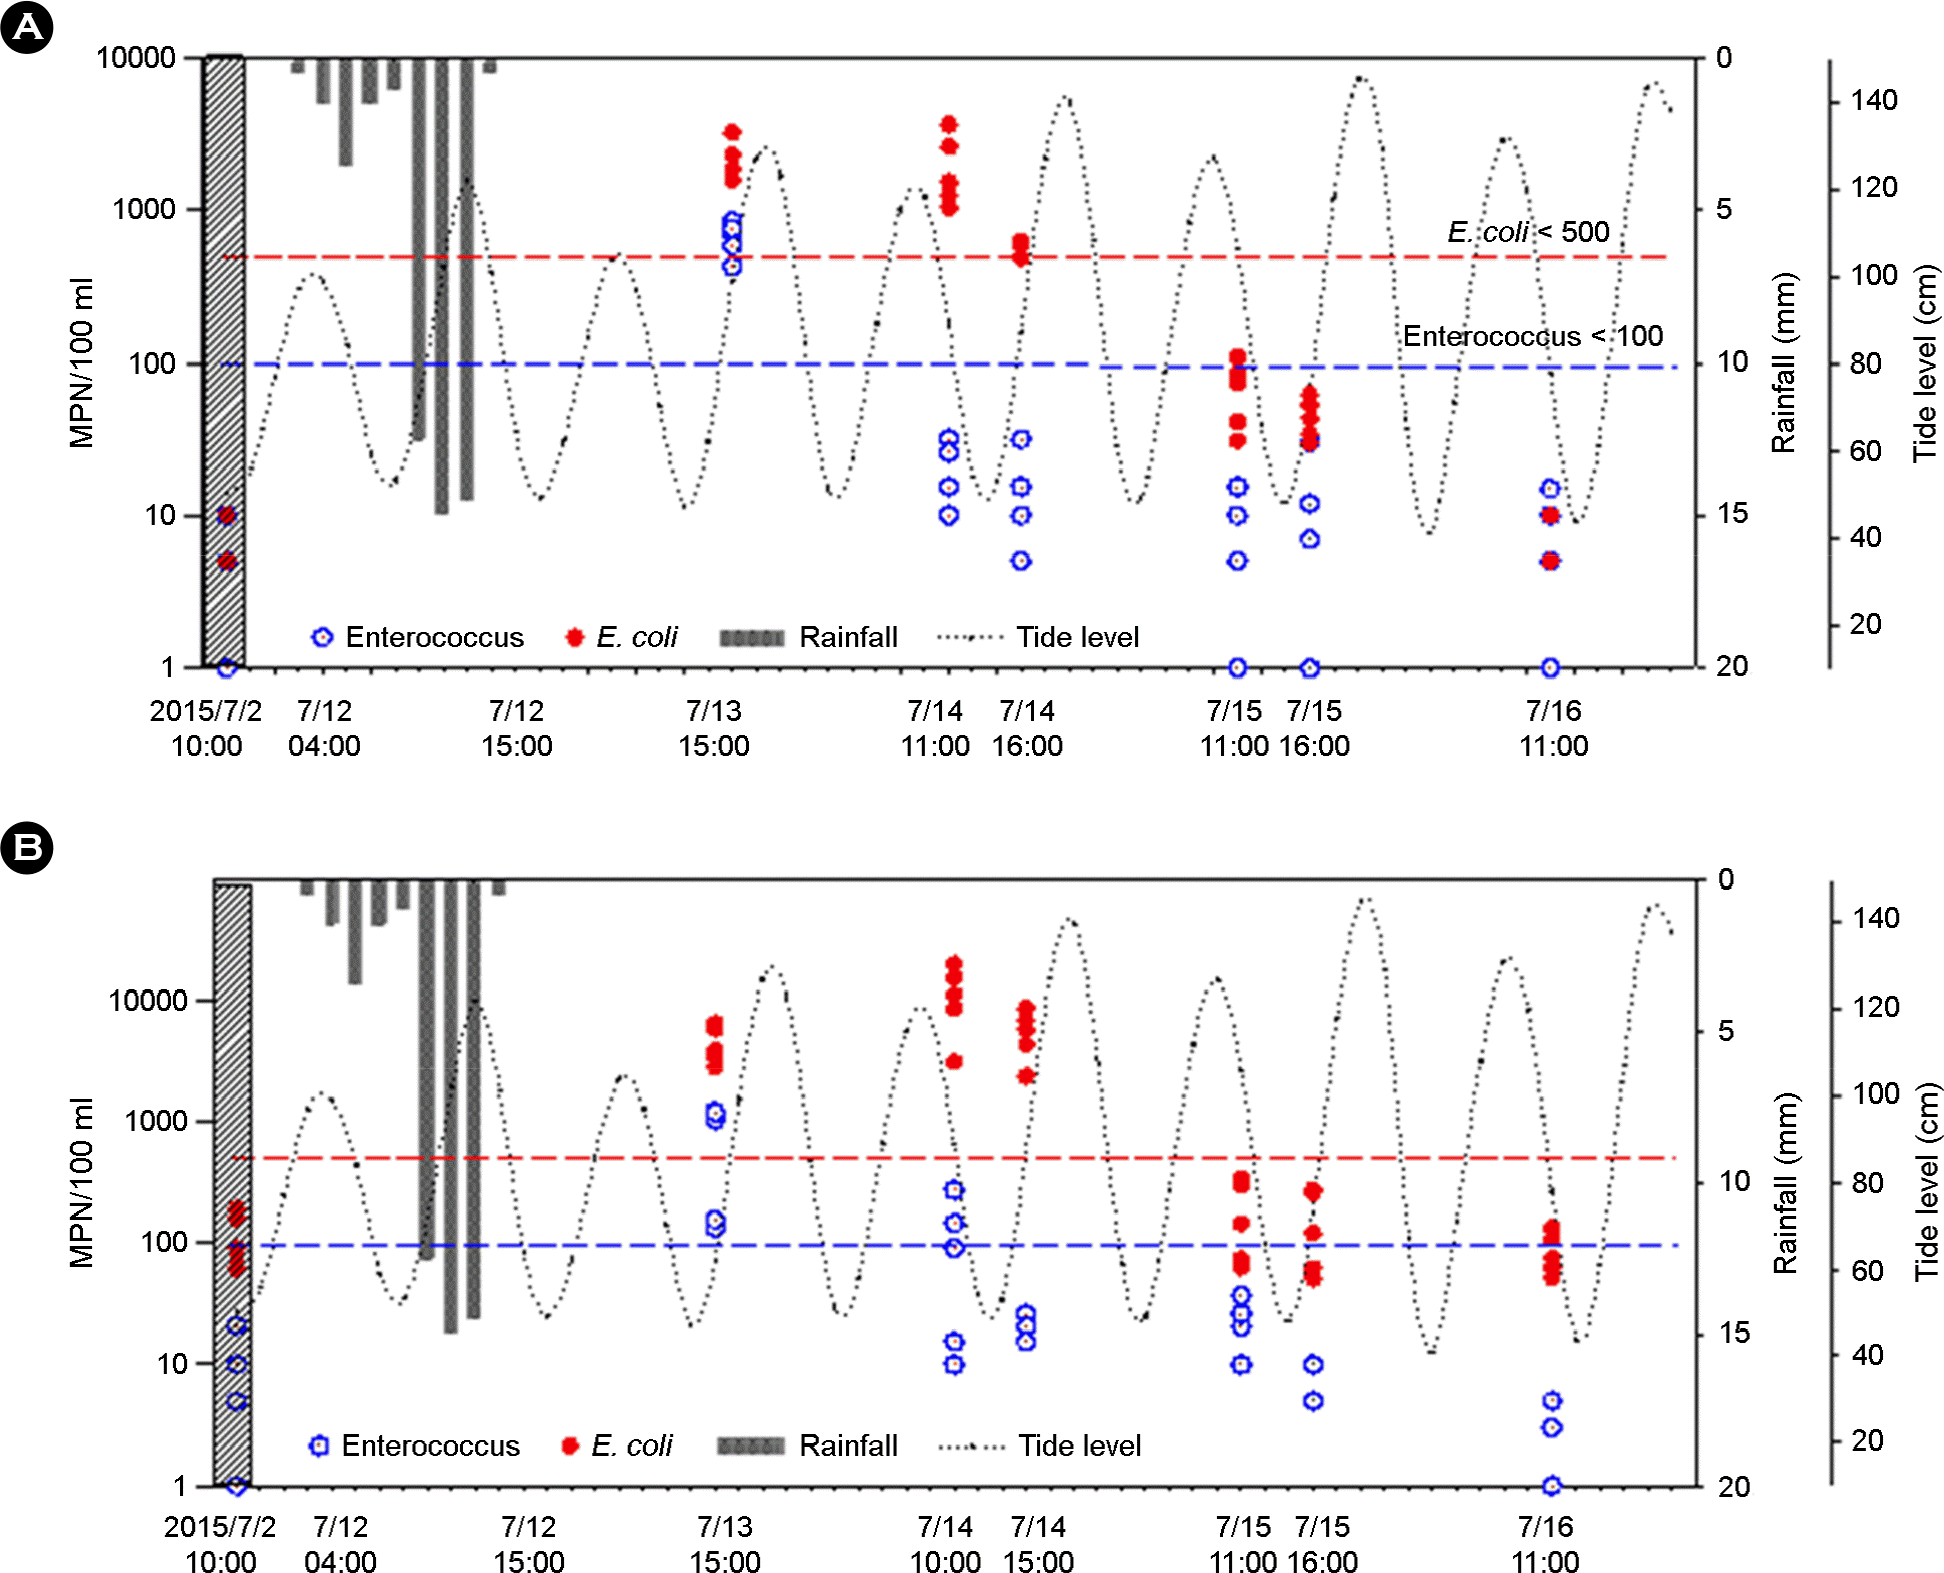 | Figure 5.54.5 mm Rainfall for 19.5 hours and concentration of Enterococcus and E. coli at 5 sampling sites of Haeundae (A) and Gwanganri (B). The dot lines indicate costal beach water health standards |
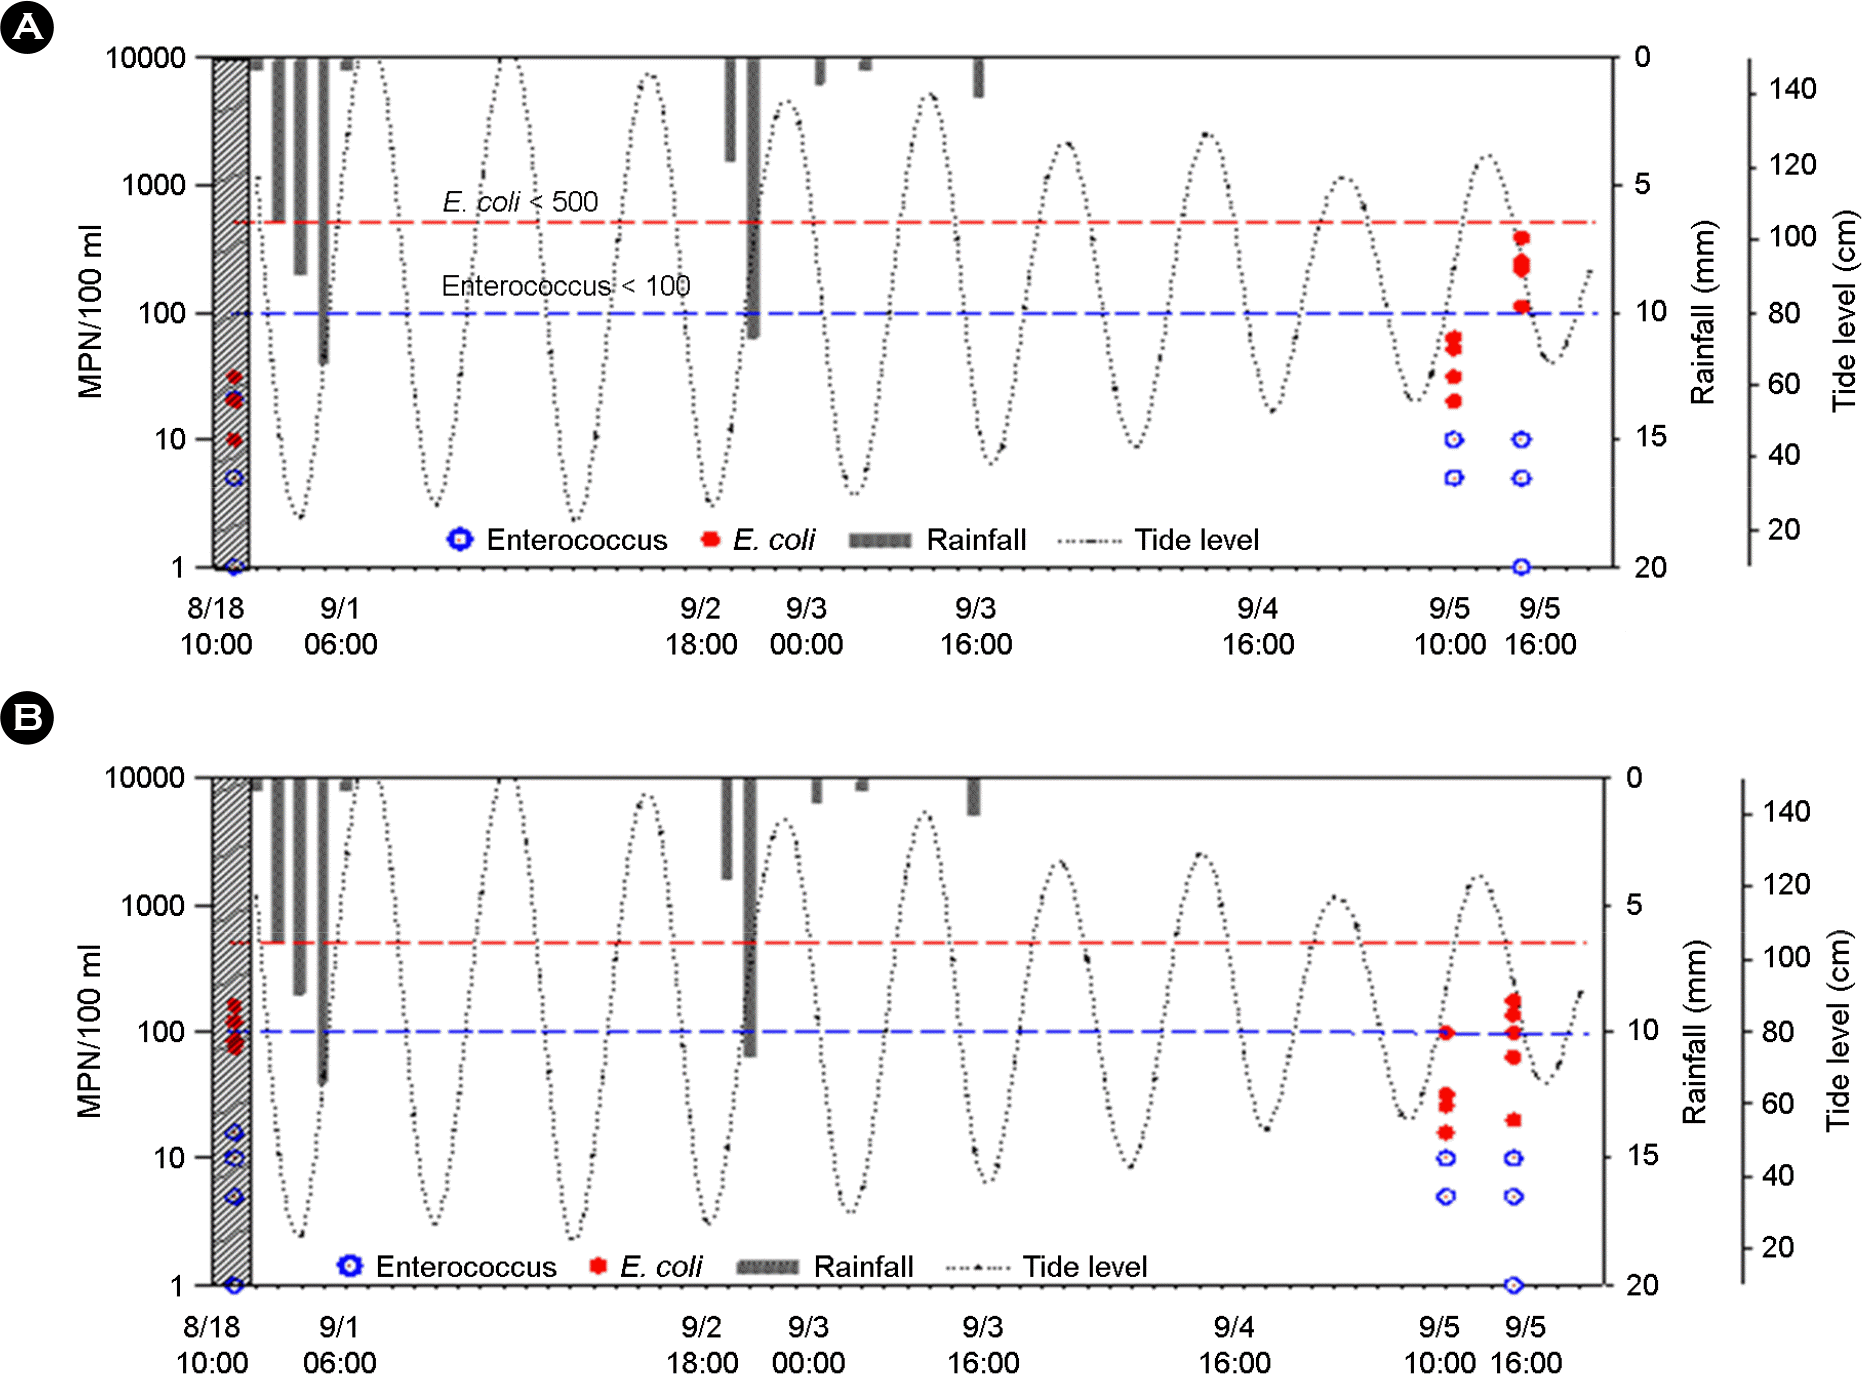 | Figure 6.45.5 mm Rainfall for 3 days and concentration of Enterococcus and E. coli at 5 sampling sites of Haeundae (A) and Gwanganri (B). The dot lines indicate costal beach water health. |
Table 1.
Rainfall information and sampling time for the rainfall sampled during the wet days
Table 2.
Geometric mean (GM), minimum (Min), maximum (Max) of each parameter, and significance level (p-value) using paired t-test for comparing the variation between dry days and wet days at Haeundae beach
| Parameter | Unit | Dry daysa | Wet daysb | Sig. level (p) | ||||
|---|---|---|---|---|---|---|---|---|
| GM | Min | Max | GM | Min | Max | |||
| Enterococcus | MPN/100 ml | 2 | 1 | 21 | 17 | 1 | 960 | 0.000 |
| E. coli | MPN/100 ml | 15 | 5 | 150 | 186 | 5 | 7300 | 0.000 |
| Salinity | PSU | 32.9 | 32.6 | 33.8 | 32.0 | 31.0 | 33.2 | 0.002 |
| Turbidity | NTU | 2.804 | 1.400 | 4.600 | 3.874 | 0.600 | 33.900 | 0.025 |
| Chemical oxygen demand | mg/l | 1.4 | 0.6 | 3.2 | 0.8 | 0.1 | 2.5 | 0.016 |
| Total organic carbon | mg/l | 1.3 | 1.3 | 1.4 | 1.4 | 1.1 | 2.6 | 0.480 |
| Total suspended solid | mg/l | 7.8 | 4.5 | 12.8 | 12.1 | 2.1 | 45.0 | 0.001 |
| Ammonia nitrogen | mg/l | 0.019 | 0.003 | 0.265 | 0.280 | 0.036 | 1.183 | 0.000 |
| Total nitrogen | mg/l | 0.059 | 0.044 | 0.072 | 0.416 | 0.034 | 1.121 | 0.021 |
| Total phosphorus | mg/l | 0.023 | 0.014 | 0.032 | 0.022 | 0.002 | 0.067 | 0.001 |
| Water temperature | ℃ | 20.6 | 20.2 | 21.1 | 21.9 | 19.6 | 23.5 | 0.011 |
| pH | - | 8.1 | 7.9 | 8.2 | 8.1 | 8.1 | 8.2 | 0.679 |
Table 3.
Geometric mean (GM), minimum (Min), maximum (Max) of each parameter, and significance level (p-value) using paired t-test for comparing the variation between dry days and wet days at Gwanganri beach
| Parameter | Unit | Dry daysa | Wet daysb | Sig. level (p) | ||||
|---|---|---|---|---|---|---|---|---|
| GM | Min | Max | GM | Min | Max | |||
| Enterococcus | MPN/100 ml | 4 | 1 | 49 | 40 | 1 | 3200 | 0.002 |
| E. coli | MPN/100 ml | 38 | 5 | 310 | 613 | 16 | 24000 | 0.000 |
| Salinity | PSU | 32.0 | 31.3 | 32.5 | 30.1 | 26.7 | 32.4 | 0.007 |
| Turbidity | NTU | 5.933 | 2.900 | 9.600 | 8.333 | 1.500 | 35.600 | 0.102 |
| Chemical oxygen demand | mg/l | 3.0 | 1.2 | 8.1 | 2.1 | 0.7 | 6.6 | 0.035 |
| Total organic carbon | mg/l | 2.1 | 1.4 | 4.0 | 1.5 | 1.1 | 2.4 | 0.000 |
| Total suspended solid | mg/l | 11.7 | 7.5 | 44.7 | 21.3 | 7.1 | 67.9 | 0.000 |
| Ammonia nitrogen | mg/l | 0.000 | 0.000 | 0.000 | 0.170 | 0.001 | 1.213 | 0.000 |
| Total nitrogen | mg/l | 0.266 | 0.233 | 0.323 | 0.685 | 0.131 | 1.625 | 0.038 |
| Total phosphorus | mg/l | 0.039 | 0.036 | 0.042 | 0.051 | 0.009 | 0.105 | 0.000 |
| Water temperature | ℃ | 21.6 | 20.8 | 22.4 | 21.5 | 18.9 | 23.3 | 0.944 |
| pH | - | 8.2 | 8.2 | 8.2 | 8.1 | 8.1 | 8.3 | 0.084 |
Table 4.
Inactivation coeffients (K d) and time to decrease bacterial concentration by water quality standard during June 25 ~ June 26
| Costal beach | Indicator bacteria | K d | T st (h)a |
|---|---|---|---|
| Haeundae beach | Enterococci E. coli | -0.548 -0.289 | 8.0 10.8 |
| Gwanganri beach | Enterococci E. coli | -0.263 -0.291 | 13.0 13.9 |
 XML Download