Abstract
Background
Chronic low grade inflammation is closely linked to type II diabetes, obesity, and atherosclerosis. Macrophages play a key role in the regulation of pro- or anti-inflammatory actions at the lesion sites of disease. Components of cordyceps militaris, cordycepin and adenosine, have been used for the modulation of inflammatory diseases. The effects of cordycepin in the modulation of macrophages have yet to be elucidated. We investigated the effects of cordycepin and adenosine on the morphological changes of macrophages under the inflammatory condition of LPS and an anti-inflammatory condition involving high concentrations of adenosine.
Methods
We confirmed the mRNA levels of the M1/M2 cytokine genes through RT-PCR and morphological change.
Results
LPS-activated macrophages returned to their inactivated original shape, i.e., they looked like naïve macrophages, through the treatment with high concentrations of cordycepin (40 µg/ml). LPS and adenosine activated macrophages also returned to their original inactivated shapes after cordycepin treatment; however, at relatively higher levels of cordycepin than adenosine. This change did not occur with relatively low concentrations of cordycepin. Adenosine down-regulated the gene expression of M1 cytokines (IL-1β, TNF-α) and chemokines (CX3CR1, RANTES), as well as cordycepin. Additionally, M2 cytokines (IL-10, IL-1ra, TGF-β) were up-regulated by both cordycepin and adenosine.
Most arthritis, diabetes, and heart disease sufferers are all too familiar with inflammation. Inflammation is the activation of the immune system in response to infection, irritation, or injury and is characterized by an influx of white blood cells, redness, heat, swelling, pain, and dysfunction of the organs involved (1,2). Macrophages play a key role in the immune system via the regulation of pro-inflammatory and anti-inflammatory actions at the lesion sites of disease. In injured tissues, monocytes/macrophages infiltrate inflamed tissues and play central roles (3). Mediators of theses event including pro-inflammatory cytokines and chemokines promote macrophage accumulation via increasing the expression of adhesion molecules (3,4). In these states, macrophages are called classically activated M1 macrophages (M1), and are induced by IFN-γ either alone or in concert with microbial stimuli (e.g. lipopolysaccharides (LPS)) or cytokines (e.g. TNF-α and GM-CSF) (5). Anti-inflammatory cytokines such as IL-4, IL-10, and IL-13 have been found to be more than simple inhibitors of macrophage activation, but also able to induce an alternative M2 form of macrophage activation (M2) (6).
Taken together, macrophage phenotype is an important factor in recruiting macrophages to the lesion site, scavenging pathogens, expressing surface proteins, and releasing pro- and anti-inflammatory cytokines.
Cordycepin, 3'-deoxyadenosine, is an effective component isolated from Cordyceps militaris. Cordycepin has various biological effects including anti-fungal (7), anti-malarial (8), anti-herpes (9), anti-tumorigenic on some cell lines, anti-leukemic activities (10), and anti-diabetic effects (11).
Adenosine is an endogenous purine nucleoside that, following its release from cells or after being formed extracellularly, diffuses to the cell membrane of surrounding cells where it binds specific cell-surface structures that recognize it, termed adenosine receptors (12,13). The role of adenosine as an extracellular signaling molecule demonstrated that adenosine is both a potent negative inotropic agent and a coronary vasodilator (14).
Taken together, cordycepin and adenosine must represent excellent immunomodulators regulating immune cell activation via the suppression of over-expressed inflammation. However, the effects of neither cordycepin nor adenosine on morphological change in macrophages have been determined.
In the current study, we investigated the effects of cordycepin and adenosine on morphological changes in macrophage under various experimental conditions.
Cordycepin, adenosine, lipopolysaccharide (LPS), and 3-(4,5-dimethylthiazol-2-yl)2,5-dephenyltetrazolium bromide (MTT) were purchased from Sigma (St. Louis, MS, USA). Dulbecco's Modified Eagle Medium (DMEM), antibiotic-penicillin/streptomycin solution, and fetal bovine serum (Hyclone, Logan, UT, USA) were used for cell culture.
RAW 264.7 cells, a murine macrophage cell line, was maintained in a 95% air, 5% CO2 atmosphere in DMEM supplemented with 10% heat-inactivated fetal bovine serum (FBS), 10,000 U/ml penicillin, and 10,000 U/ml streptomycin.
Cell viability was determined by a MTT reduction assay. In brief, RAW 264.7 cells were pre-incubated overnight in 24-well plates at a density of 2×10⁵ cells per well, and were then washed with 1x PBS. Cells were then treated with different concentrations of cordycepin or adenosine for 24 hrs and grown in 0.5 mg/ml MTT at 37℃ for 4 hrs. After removing culture supernatants, the resulting dark blue crystals were dissolved with DMSO (Dimethyl sulfoxide). Absorbance values were read at 560 nm using an automated VERSAmax microplate reader (Molecular Devices, Sunnyvale, CA, USA). All determinations were confirmed by replication in at least three independent experiments.
Total RNA was prepared from cells using the RNeasy Mini kit (QIAGEN, Valencia, CA, USA) according to the protocol for the manufacturer. For RT-PCR, 1 µg/ml of total RNA from each sample was reverse transcribed for 1 hr at 37℃ in a reaction mixture containing 2 mM deoxynucleotide triphosphate (dNTP), 2 µM oligo-dT primer, 1x reverse transcriptase buffer, 200 units MMLV reverse transcriptase, and 1 U RNase inhibitor (invitrogen, Carlsbad, CA, USA). Next, PCR was performed using the above-prepared cDNA as a template, with the following cycle parameters: 94℃, 2 min; 35 cycles, 94℃, 45 s; 62℃, 45 s, 72℃, 1 min; 72℃, 5 min, 4℃, ∞. All PCR products were visualized by electrophoresis in 1.5% agarose gels, followed by straining with ethidium bromide (EtBr; 0.5 µg/ml).Verification of specific genes was established using their predicted sizes under ultraviolet (UV) light. The primer sequences were as follows: 5'-CAG GAT GAG GAC ATG ACA CC-3' (forward), 5'-CTC TGC AGA CTC AAA CTC CAC-3' (reverse) for IL-1β; 5'-TGC TGG GTA CTT ACA AGG ACC-3' (forward), 5'-CAG AGC GGA TGA AGG TAA AGC-3' (reverse) for IL-1RA; 5'-TGG CCA CAC TTG AGA GCT GC-3' (forward), 5'-TTC AGG GAT GAA GCG GCT GG-3' (reverse) for IL-10; 5'-TTG ACC TCA GCG CTG AGT TA-3' (forward), 5'-CCT GTA GCC CAC GTC GTA GC-3' (reverse) for TNF-α; 5'-ATC ATC CTC ACT GCA GCC GC-3' (forward), 5'-CAC ACT TGG CGG TTC CTT CG-3' (reverse) for RANTES; 5'-TCC TGT CCG TCT TCT ACG CC-3' (forward), 5'-ATT GTG GAG GCC CTC ATG GC-3' (reverse) for CX3CR1; 5'-CTA AAC CAG GAG TCC TGC GG-3' (forward), 5'-CTA GTG GCC AAG GTG ATC CC-3' (reverse) for CX3CL1; 5'-GGA GCT GGT GAA ACG GAA GC-3' (forward), 5'-CAT AGT AGT CCG CTT CGG GC-3' (reverse) for TGF-β; and 5'-GTG GGC CGC CCT AGG ACC AG-3' (forward), 5'-GGA GGA AGA GGA TGC GGC AG T-3' (reverse) for β-actin as an internal PCR control. Band intensity was quantified by densitometric analysis (Infinity 3026, Vilber Lourmat, Marne la Valled, France).
To determine the effects of cordycepin or adenosine on macrophage morphology, cells were cultured in 24-well plates at a density of 2×10⁵ cells per well, sterile for 24 hrs. The culture medium was then removed, and the cells were treated with (A) cordycepin (5, 10, 20, 40 µg/ml) in the presence of LPS (100 ng/ml), and (B) adenosine (5, 10, 20, 40 µg/ml) in the absence of LPS, for 24 hrs. Then, to investigate which combination of cordycepin and adenosine affected the phenotypic changes in macrophages, cells were treated with (C) adenosine (2.5 µg/ml)/cordycepin (5 µg/ml), adenosine (5 µg/ml)/cordycepin (10 µg/ml), adenosine (10 µg/ml)/cordycepin (20 µg/ml), and adenosine (20 µg/ml)/cordycepin (40 µg/ml), (D) adenosine (20 µg/ml)/cordycepin (10 µg/ml), adenosine (40 µg/ml)/cordycepin (20 µg/ml), and adenosine (80 µg/ml)/cordycepin (40 µg/ml), for 24 hrs. Following the treatment, the culture supernatant was removed and cells were then fixed and stained in Diff-quick Solution (Baxter, Houston, TX, USA). Also, to determined the effects of cordycepin on lipid accumulation, cells were cultured in 24-well plates at a density of 2×10⁵ cells per well, sterile for 24 hrs. The culture medium was removed, and the cells were treated with cordycepin (5, 10, 20, 40 µg/ml) in the presence of LPS (100 ng/ml) for 24 hrs. Following the treatment, the culture supernatant was removed and cells were then fixed and stained in Oil red O solution.
Data are expressed as mean±standard deviation. Statistical significance between the groups was determined by paired t-test and one-way ANOVA for repeated measures. Results with p<0.05 were considered statistically significant. Data were assessed using SPSS (Version 15.0, SPSS Inc., Chicago, IL, USA).
To rule out cordycepin toxicity, we tested its effect on the viability of RAW 264.7 by MTT assay. Exposure of cells to cordycepin (5~40 µg/ml) or adenosine (2.5~40 µg/ml) for 24 hrs showed no significant toxic adverse effects on viability compare to the untreated controls (Supplementary Fig. 1).
Morphological examination under a light microscope indicated that more than half of the macrophages appeared asteroid and there were little or no phagocytic granules prior to treatment with cordycepin or ademosine. After being treated with cordycepin (5~40 µg/ml) in the presence of LPS (100 ng/ml), macrophages in the control group became round and the granules increased (Fig. 1A) whereas those without adenosine and LPS appeared larger and rougher than control (Fig. 1B). These results suggested that cells treated with high concentration of adenosine (40 µg/ml) were similar to those exposed to LPS. However, cells treated with high concentrations of cordycepin (40 µg/ml) in the presence with LPS were smoother than those treated with LPS.
To further investigate to important role of cordycepin and adenosine on inflammation, murine macrophage cells with cordycepin (5~40 µg/ml) in the presence of LPS (100 ng/ml), or adenosine (10 µg/ml) in the absence with LPS, for 24 hrs exhibited altered M1 cytokines and chemokines. Cordycepin suppressed IL-1β, TNF-α, CX3CR1, CX3CL1, and RANTES expression in a dose-dependent manner. Adenosine exhibited a slight increase in these genes, while the cells co-treated with adenosine and LPS decreased their expression (Fig. 2).
We determined M2 cytokines expression on inflammation in murine macrophage cells with cordycepin (5~40 µg/ml) in the presence of LPS (100 ng/ml) or adenosine (10 µg/ml) in the absence with LPS, for 24 hrs. Cordycepin upregulated IL-10 and TGF-β expression in a dose-dependent manner. Adenosine increased the expression of these genes in a manner similar to that of LPS (Fig. 3).
When cultured in medium alone, normal RAW 264.7 cells tended to be round, with none appearing to spread over the surface (Fig. 4). In cells treated with double the concentration of cordycepin than adenosine, a naïve macrophage form from the M1 phenotype was induced (Fig. 4A). On the other hand, in cells treated with double the concentration of adenosine than cordycepin, an M2 phenotype from an M1 phenotype was induced (Fig. 4B).
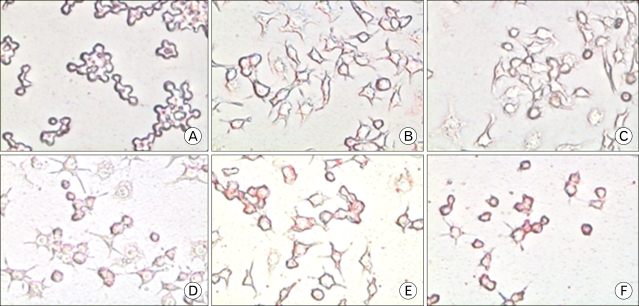
When cultured in medium alone, normal RAW 264.7 cells tended to be round, with none appearing to spread over the surface. The cells treated with a high concentration of cordycepin exhibited an increased accumulation of red-stained lipids as compared to those treated with low concentrations (Fig. 5).
The data presented in this paper indicates that cordycepin and adenosine regulate immune responses. The present study demonstrated that cordycepin and adenosine changed the macrophage phenotypic switch via a decrease in the expression of pro-inflammatory cytokines and chemokines (IL-1β, IL-6, TNF-α, RANTES, CX3CL1), and an induction of anti-inflammatory cytokine (IL-1ra, IL-10, TGF-β) in RAW 264.7 cells.
In inflamed tissue or lesions, naïve macrophages are activated either classically or alternatively depending on the profile of the environmental stimuli. Classically activated macrophages (M1), induced by IFN-γ plus TNF-α or TLRs ligands, are typical effectors of cell-mediated immunity. Alternative activation of macrophages by IL-4 and IL-13 or by phagocytosis of apoptotic cells antagonizes classical activation. Alternatively activated macrophages (M2) secrete the anti-inflammatory cytokines IL-1ra, IL-10, and TGF-β, thereby providing signals to deactivate macrophages as well as to mediate immunosuppressive and healing processes. The phenotypes of both M1 and M2 cells in inflamed tissues is the major source of cytokines, and it is believed that the coordinated switching between these two phenotypes determines the outcome of inflammatory processes (15). These cytokines affect wound healing rate and wound-breaking strength while M1 cells produce pro-inflammatory cytokines and chemokines, IL-1β, IL-6, TNF-α, RANTES, and CX3CL1, and attract more attention in that they can be localized to the infected tissue, manifested systemically throughout the body, and cause vasodilation as well as symptoms of inflammation, such as redness, swelling, heat, and pain (16). Cordycepin down-regulated the expression of pro-inflammatory molecules such as IL-1β and TNF-α, and the chemokines, CX3CR1 and RANTES, in LPS-stimulated RAW 264.7 cells (Fig. 2). When we examined the morphological changes that took place in macrophages treated with cordycepin and LPS, cells treated with LPS and low concentrations of cordycepin (5~10 µg/ml) were similar those exposed to LPS alone. However, cells treated with high concentrations of cordycepin (40 µg/ml) in combination with LPS were smoother than those treated with LPS alone (Fig. 1A). Also, these levels inhibited the activation of pro-inflammatory cytokines and related proteins in both of the LPS-activated cell types (17,18).
Adenosine treated with LPS down-regulated the expression of pro-inflammatory cytokines and chemokines; however, when we exposed them to adenosine, it induced gene expression in macrophages somewhat (Fig. 2). Additionally, with respect to morphological change, low concentrations of adenosine activated macrophages and high concentration of adenosine induced M2 cells that contained lipid vacuoles (Fig. 1B and Fig. 5).
In contrast, Macrophages secreted anti-inflammatory cytokines after treatment with cordycepin or adenosine (Fig. 3), which differentiated M2 macrophages (Fig. 1). M2 macrophages are generally characterized by low production of pro-inflammatory cytokines and high expression of anti-inflammatory mediators such as IL-1ra, IL-10, and TGF-β (Fig. 3). Further research will be needed to examine IL-1ra expression which was down-regulated by cordycepin (Fig. 3A) versus adenosine, which showed an up-regulation of anti-inflammatory cytokines (Fig. 3B). Cells treated with both cordycepin and adenosine still induced the M2 phenotype from the phenotype of macrophages when treated with LPS only (Fig. 4).
The purpose of this study was to investigate the effects of the main constituents of Cordyceps militaris, cordycepin and adenosine, on macrophage maturation/differentiation and cytokine production as well as to determine how the immune responses are modulated in inflammatory diseases. We demonstrated that both cordycepin and adenosine were able to regulate immune responses by producing anti-inflammatory cytokines and also showed the phenotypic switch from M1 to M2 in macrophages. Treatment with both cordycepin and adenosine in LPS-activated macrophages was examined and resulted in a down-regulation of M1 cytokines and chemokines and alternatively, an up-regulation of M2 cytokines in macrophages.
References
1. Duncan BB, Schmidt MI, Pankow JS, Ballantyne CM, Couper D, Vigo A, Hoogeveen R, Folsom AR, Heiss G. Low-grade systemic inflammation and the development of type 2 diabetes: the atherosclerosis risk in communities study. Diabetes. 2003; 52:1799–1805. PMID: 12829649.
2. Jacobs M, van Greevenbroek MM, van der Kallen CJ, Ferreira I, Blaak EE, Feskens EJ, Jansen EH, Schalkwijk CG, Stehouwer CD. Low-grade inflammation can partly explain the association between the metabolic syndrome and either coronary artery disease or severity of peripheral arterial disease: the CODAM study. Eur J Clin Invest. 2009; 39:437–444. PMID: 19397692.

3. Gregory JL, Morand EF, McKeown SJ, Ralph JA, Hall P, Yang YH, McColl SR, Hickey MJ. Macrophage migration inhibitory factor induces macrophage recruitment via CC chemokine ligand 2. J Immunol. 2006; 177:8072–8079. PMID: 17114481.

4. Schober A, Bernhagen J, Weber C. Chemokine-like functions of MIF in atherosclerosis. J Mol Med. 2008; 86:761–770. PMID: 18385967.

5. Mantovani A, Sica A, Locati M. New vistas on macrophage differentiation and activation. Eur J Immunol. 2007; 37:14–16. PMID: 17183610.

6. Meghari S, Berruyer C, Lepidi H, Galland F, Naquet P, Mege JL. Vanin-1 controls granuloma formation and macrophage polarization in Coxiella burnetii infection. Eur J Immunol. 2007; 37:24–32. PMID: 17163446.

7. Sugar AM, McCaffrey RP. Antifungal activity of 3'-deoxyadenosine (cordycepin). Antimicrob Agents Chemother. 1998; 42:1424–1427. PMID: 9624488.

8. Trigg PI, Gutteridge WE, Williamson J. The effects of cordycepin on malaria parasites. Trans R Soc Trop Med Hyg. 1971; 65:514–520. PMID: 4999656.

9. de Julián-Ortiz JV, Gálvez J, Muñoz-Collado C, García-Domenech R, Gimeno-Cardona C. Virtual combinatorial syntheses and computational screening of new potential anti-herpes compounds. J Med Chem. 1999; 42:3308–3314. PMID: 10464017.

10. Deitch AD, Sawicki SG. Effects of cordycepin on microtubules of cultured mammalian cells. Exp Cell Res. 1979; 118:1–13. PMID: 310391.

11. Yun Y, Han S, Lee S, Ko SK, Lee C, Ha NJ, Kim K. Anti-diabetic effects of CCCA, CMESS, and cordycepin from Cordyceps militaris and the immune responses in streptozotocin-induced diabetic mice. Nat Prod Sci. 2003; 9:291–298.
12. Ralevic V, Burnstock G. Receptors for purines and pyrimidines. Pharmacol Rev. 1998; 50:413–492. PMID: 9755289.
13. Fredholm BB, Ijzerman AP, Jacobson KA, Klotz KN, Linden J. International union of pharmacology. XXV. Nomenclature and classification of adenosine receptors. Pharmacol Rev. 2001; 53:527–552. PMID: 11734617.
14. Drury AN, Szent-Györgyi A. The physiological activity of adenine compounds with especial reference to their action upon the mammalian heart. J Physiol. 1929; 68:213–237. PMID: 16994064.
15. Mosser DM. The many faces of macrophage activation. J Leukoc Biol. 2003; 73:209–212. PMID: 12554797.

16. Haddad JJ, Safieh-Garabedian B, Saadé NE, Kanaan SA, Land SC. Chemioxyexcitation (delta pO2/ROS)-dependent release of IL-1 beta, IL-6 and TNF-alpha: evidence of cytokines as oxygen-sensitive mediators in the alveolar epithelium. Cytokine. 2001; 13:138–147. PMID: 11161456.
17. Shin S, Lee S, Kwon J, Moon S, Lee S, Lee CK, Cho K, Ha NJ, Kim K. Cordycepin suppresses expression of diabetes regulating genes by inhibition of lipopolysaccharide-induced inflammation in macrophages. Immune Netw. 2009; 9:98–105. PMID: 20107539.

18. Kim HG, Shrestha B, Lim SY, Yoon DH, Chang WC, Shin DJ, Han SK, Park SM, Park JH, Park HI, Sung JM, Jang Y, Chung N, Hwang KC, Kim TW. Cordycepin inhibits lipopolysaccharide-induced inflammation by the suppression of NF-κB through Akt and p38 inhibition in RAW 264.7 macrophage cells. Eur J Pharmacol. 2006; 545:192–199. PMID: 16899239.

Figure 1
RAW 264.7 cells were cultured on cover slips in the presence of various concentrations of cordycepin (A) medium alone (a), LPS 100 ng/ml (b), cordycepin (5 µg/ml) (c), 10 µg/ml (d), 20 µg/ml (e), and 40 µg/ml (f), in the presence of LPS and adenosine (B) medium alone (a), LPS 100 ng/ml (b), adenosine (5 µg/ml) (c), 10 µg/ml (d), 20 µg/ml (e), 40 µg/ml (f), and in the absence of LPS for 24 hrs. The cells were then fixed and stained in Diff-quick Solution (×400).
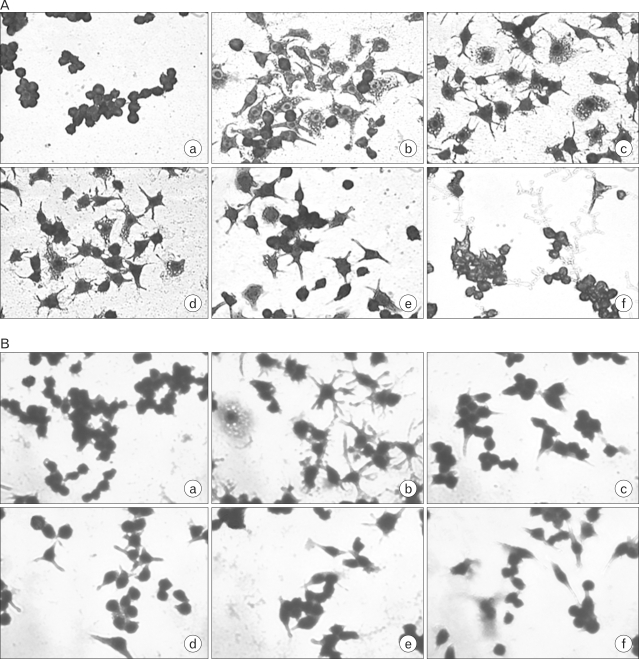
Figure 2
Effects of cordycepin and adenosine on the expression of M1 cytokines (A, B), chemokines, and their receptor (C, D) in RAW 264.7 cells. Cells were incubated in various concentrations of cordycepin (5, 10, 20, 40 µg/ml) in the presence of LPS (100 ng/ml) or adenosine (10 µg/ml), in the presence or absence of LPS, for 24 hrs. mRNA levels of M1 cytokine and chemokine genes were determined by RT-PCR analysis. β-actin was used as a control. ††p<0.01 vs. cells only; *p<0.05, **p<0.01 vs. LPS only; and †p<0.05 vs. cells only were all based on Student's t-tests.
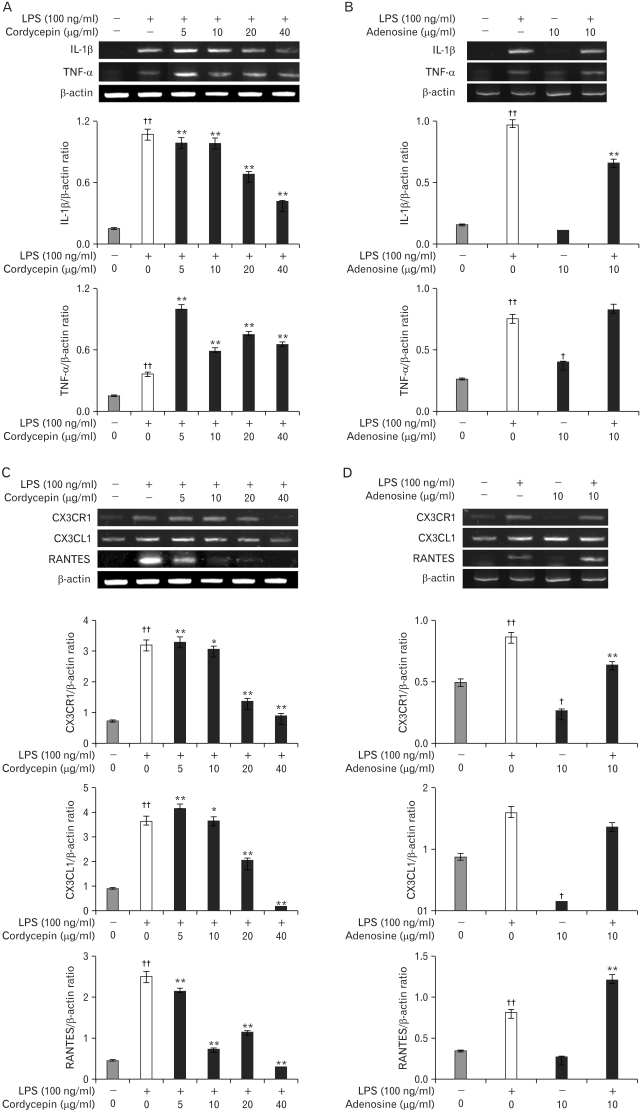
Figure 3
Effects of cordycepin (A) and adenosine (B) on the expression of M2 cytokines in RAW 264.7 cells. Cells were incubated in various concentrations of cordycepin (5, 10, 20, 40 µg/ml) in the presence of LPS (100 ng/ml), or adenosine (10 µg/ml), in the presence or absence of LPS, for 24 hrs. mRNA levels of M2 cytokine genes were determined by RT-PCR analysis. β-actin was used as a control. ††p<0.01 vs. cells only; *p<0.05, **p<0.01 vs. LPS only; and †p<0.01 vs. cells only were based on Student's t-tests.
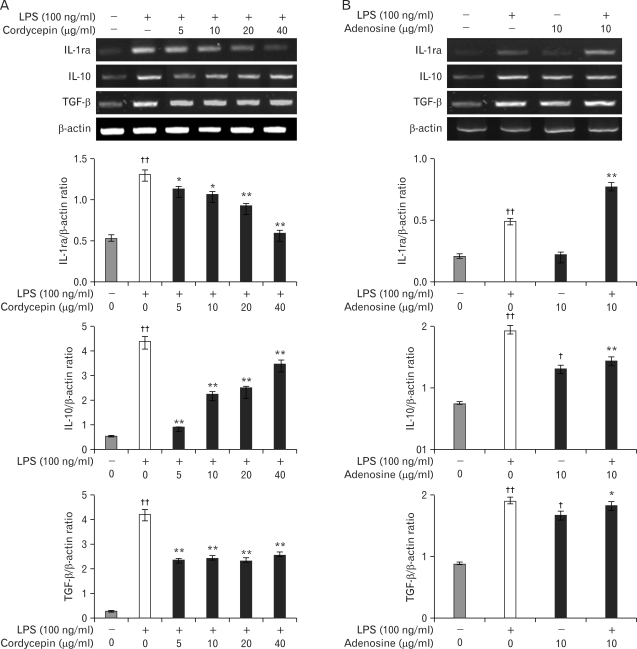
Figure 4
The morphological switch by cordycepin with adenosine or adenosine and cordycepin. RAW 264.7 cells were cultured on cover slips in the presence of double the concentration of cordycepin than adenosine (A) in: medium alone (a), LPS 100 ng/ml (b), adenosine (2.5 µg/ml)/cordycepin (5 µg/ml) (c), adenosine (5 µg/ml)/cordycepin (10 µg/ml) (d), adenosine (10 µg/ml)/cordycepin (20 µg/ml) (e), adenosine (20 µg/ml)/cordycepin (40 µg/ml) (f), and 2× adenosine/cordycepin (B) in: medium alone (a), LPS 100 ng/ml (b), adenosine (20 µg/ml)/cordycepin (10 µg/ml) (c), adenosine (40 µg/ml)/cordycepin (20 µg/ml) (d), adenosine (80 µg/ml)/cordycepin (40 µg/ml) (e), for 24 hrs. The cells were then fixed and stained in Diff-quick Solution (×400).
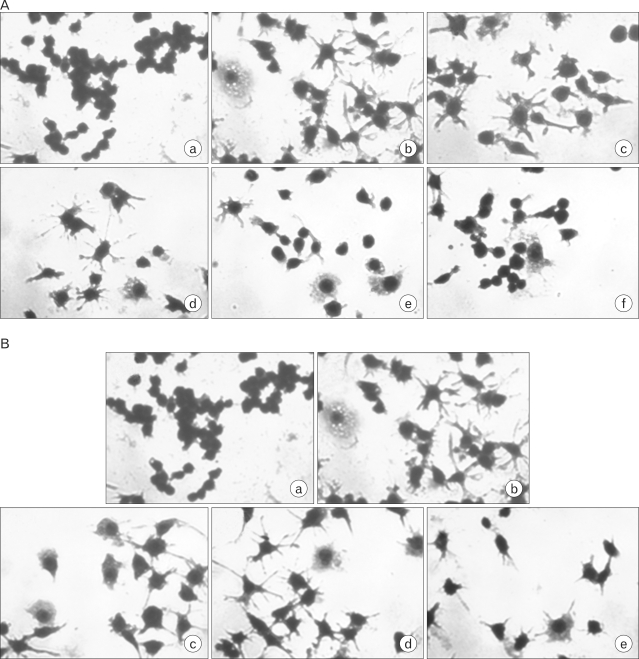
Figure 5
Lipid accumulation of macrophages by cordycepin. RAW 264.7 cells were cultured on cover slips in the presence of various concentrations of cordycepin: medium alone (A), LPS (100 ng/ml) (B), cordycepin (5 µg/ml) (C), 10 µg/ml (D), 20 µg/ml (E), 40 µg/ml (F) in the presence of LPS, for 24 hrs. The cells were then fixed and stained in oil red O solution. (×400).


 PDF
PDF ePub
ePub Citation
 Print
Print


 XML Download