

 PDF
PDF ePub
ePub Citation
 Print
Print


Abbreviations
7-AAD
7-aminoactinomycin D
AO
acridine orange
CBA
cytometric bead array
DiOC6(3)
3,3'-dihexiloxa-dicarbocyanine
EdU
5-Ethynyl-2'-deoxyuridine
FLICA™
fluorescently labeled inhibitors of caspases
MOMP
mitochondrial outer membrane permeabilization
PARP
poly ADP ribose polymerase
PBMCs
peripheral blood mononuclear cells
PCA
principle components analysis
PI
propidium iodide
PMA
phorbol myrstate acetate
PY
pyronin Y
PSM
probability state modeling
RH123
rhodamine 123
INTRODUCTION
Multiparameter flow cytometry is a powerful analytical and preparative tool (1,2). It enables the rapid measurement of multiple physical and chemical characteristics of individual cells or particles as they flow past beams of laser light in a focused fluid stream. Using flow cytometry, defined cell types can be identified within mixed cell populations and studied separately or within the context of functional intercellular interactions. Flow cytometers that provide cell sorting capabilities can identify specific cell types and physically separate them in bulk or individually (e.g., through indexed cell sorting (3)), into different groups for further study.
Flow cytometry is often applied to scrutinizing the types and levels of molecules expressed on the cell surface or within various intracellular compartments. The simultaneous measurement of multiple fluorescence parameters allows detailed analyses of coexpressed structural, receptor, signaling, and effector molecules, as well as information-containing nucleic acids. By enabling high-resolution identification and quantification of cell types and their functional characteristics, flow cytometry has become an invaluable tool for unraveling the complexities of the immune system. Well-characterized molecules are probed individually or in panels as immunophenotypic biomarkers associated with particular cell types in normal or disease states. Within each cell type of interest, insight into cellular function can be obtained by measuring markers associated with cell signaling, cell cycle status, effector function, and other cell fates.
In addition to cell analysis, flow cytometry has also extended to the analysis of subcellular organelles and even chromosomes (4), as well as numerous molecules present in cellular lysates or biological fluids (5). Flow cytometric bead-based assays are well suited for performing multiplex immunoassays (5). These assays are capable of measuring multiple analytes within small, sometimes very precious, samples such as biological fluids obtained from multicellular organisms or cultured prokaryotic and eukaryotic cells (6-9).
The early roots of flow cytometry centered on its capacity to identify cells by physical parameters such as cell size and granularity (1). Following the introduction of the first commercial flow cytometers in 1974, flow cytometric measurement of these cellular characteristics became widespread. Flow cytometry was readily applied to samples studied in the fields of immunology, hematology, pathology, and cancer. Early flow cytometry applications developed around the use of fluorescent nucleic acid dyes for viable cell counts, cell cycle, and ploidy analysis, as well as fluorescein- or rhodamine-tagged antibodies that allowed basic discrimination of the major lymphocyte lineages of the cellular (T cells) and humoral (B cells) arms of the immune system (1,10,11).
Subsequently, advances in affinity reagent technology have enabled the flow cytometric detection of numerous proteins and other molecules through the development of new monoclonal antibodies, peptide/MHC multimers, recombinant receptor and ligand binding proteins, and aptamers (1,12). These new reagents, coupled with new sample processing methodologies and the development of a large number of new fluorochromes, fluorescent chemical probes, and fluorescent reporter proteins, have enabled increasingly complex immunophenotyping analyses, as well as flow cytometric studies of cell cycle, apoptosis, and cell signaling (2,10,13). Parallel advances in hardware technology, instrument calibration methodology, and data analysis capabilities have facilitated the application of multiparameter flow cytometric analyses of the biology of quiescent, activated, growing, differentiating, proliferating, dying, and dead cells (1,10). Due to significant ongoing technological and reagent-associated advances, multiparameter flow cytometry remains a preeminent tool for deciphering immune function and phenotype in academic, biotechnological, and pharmaceutical research, as well as clinical research and medicine (14).
Go to : 
MULTIPARAMETER CELL SURFACE AND INTRACELLULAR FLOW CYTOMETRY
For the past three decades, multivariate flow cytometric analyses have been systematically applied for immunophenotyping in clinical and research settings (1,2). Using panels of fluorochrome-conjugated antibodies with distinct fluorescence excitation and emission characteristics, polychromatic flow cytometry (simultaneous detection of ≥5 colors) can be employed to define a high-content molecular signature for each cell (15,16). The strength in the flow cytometric identification and characterization of this signature lies at the single-cell level within the context of broader cell subsets and populations. Multicolor flow cytometric disease marker analyses currently serve essential roles in the diagnosis, classification, staging, and monitoring of disease states (e.g., acute leukemia and lymphoma), as well as in biomarker discovery for basic cellular developmental and differentiation studies (17,18). Advances in the development of new fluorescent dyes, specific antibodies, flow cytometers capable of 20-parameter measurements, and analysis software have helped push the cell analysis research field towards high-content multicolor flow applications (14,19).
Simultaneous detection of intracellular (e.g., cytokines, transcription factors, and phospho-proteins) and cell surface molecules has enabled high-resolution analyses of the cellular and molecular mechanisms that underlie complex immune system functions (15,20,21). Merging protocols for surface staining and intracellular staining represents a major challenge for the simultaneous analysis of cellular phenotype and function. Many buffers used for intracellular epitope detection are harsh and adversely affect surface marker staining, resulting in compromised signal intensity or complete loss of resolution for certain surface markers. While the field lacks a universal buffer capable of detecting all surface markers and intracellular antigens without any compromise, parallel development of new protocols for sample preparation and storage, as well as new cellular fixation and permeabilization buffers, has enabled many combined analyses of surface and intracellular epitopes. Thus, polychromatic flow cytometry has earned a critical place not only in the identification and enumeration of immune cell subsets, but also in the assessment of important effector functions such as cytokine production, cytotoxicity, and phagocytosis. Fig. 1 demonstrates the application of 11-parameter immunofluorescent staining to the study of human T-cell subsets through surface marker analysis or the combined staining of surface markers and intracellular cytokine.
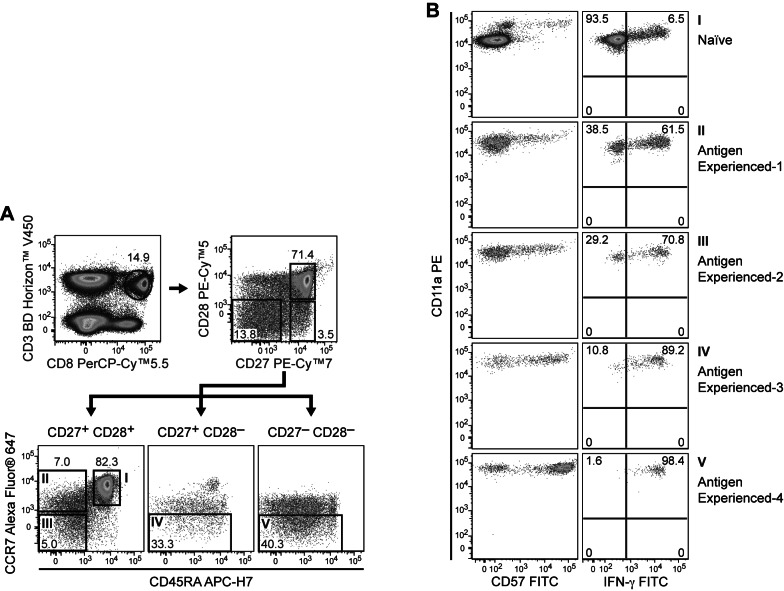 | Figure 1Polychromatic flow cytometry for analysis of T-cell phenotype and effector function. PBMCs were stained with CD57 FITC, CD11a PE, CD28 PE-Cy™5, CD27 PE-Cy™7, CD8 PerCP-Cy™5.5, CCR7 Alexa Fluor® 647, CD45RA APC-H7, CD3 BD Horizon™ V450, and CD4 BD Horizon™ V500. Cells were then acquired on a BD™ LSR II and analyzed for CD3 and for the subsets within the CD8 T-cell population. These subsets were further analyzed based on CD28 and CD27 staining to obtain the CD27+CD28+, CD27+CD28-, and CD27+CD28- fractions as shown in Panel A. Based on CD197 (CCR7) and CD45RA staining, the cells were then identified as Naïve, Antigen experienced-1, Antigen experienced-2, Antigen experienced-3, and Antigen experienced-4 (Panel B) as described in Appay, et al. (2008). Note that the expression of CD57-positive cells increased with the increased antigen experience. To confirm the increase in antigen experience, CD8 subsets from PBMCs were analyzed after stimulation with PMA/Ionomycin in the presence of BD GolgiStop™ protein transport inhibitor for 5 hours. As expected, there was an increase in the intracellular stain for IFN-γ as the cells moved from the naïve phenotype to the more experienced phenotype.
|
Advances in flow cytometry instrumentation and fluorochrome availability have enabled a new era of polychromatic flow cytometry. Continued developments promise to further expand the number of fluorescence parameters that can be simultaneously evaluated for a single cell. On the instrumentation side, the number and type of lasers and optical filters in the cytometer configuration determine the multicolor combinations that can be analyzed. A typical multiparameter flow cytometer is equipped with multiple lasers, such as a red (633-nm), blue (488-nm), and a violet (405-nm) laser. New lasers that emit light at 561 nm, 532 nm, and 375 nm (ultraviolet) are now available. These increase the potential number of different fluorochromes that can be analyzed by enhanced flow cytometers. A large number of new fluorescent proteins and fluorochromes have also become available over the past decade. Among the most notable developments, there have been the dramatic growth of numerous fluorescent proteins available for gene expression studies and the tremendous increase in the usability of the violet laser as a result of the development of several new fluorochromes, including quantum dots and the Brilliant Violet™ dyes (13,22,23).
The combined use of complex, multiparameter flow cytometry instrumentation along with a growing list of defined antibodies and a large variety of fluorochromes comes with many challenges (15,24). Differentially expressed surface molecules, spillover issues arising from different fluorochromes, and even the potential triggering of downstream signaling events by antibody binding to cells can all contribute to the variability within and between experiments (15,20). For successful multicolor panel design, a number of factors must be addressed, including challenges involving fluorescence spillover, differential expression of antigens, differential affinities of antibody clones for normal versus fixed antigen epitopes, and complex analysis with the potential need for rare event detection. Additionally, controlled sample preparation, instrument setup, and data acquisitions are important for successful multiparameter analyses. Integration of reagent and instrument standards with automated, software-defined setup and acquisition will help to mitigate some of the issues in the future for obtaining reliable, interpretable data (2,5,24,25).
An expanding area of interest has been the field of biomarker discovery, in which high-content and high-throughput genetic assays are being validated at the level of cellular function to facilitate new drug discovery and treatment. High-content biomarker discovery studies using molecular biological assays such as gene arrays and deep gene sequencing are being increasingly employed in a systematic approach to fully analyze complex biological systems (26). Multiparameter cell sorting has been very useful for isolating defined cell subsets for population analysis. Recently, indexed cell sorting has been applied to preparing individual cells for these complex molecular biological assays (26). New systems biology studies are now combining analyses at both the genetic and protein levels to better understand cellular processes, as well as the complex networks of interactions between the various cell types within the body (14). The general consensus from a number of studies is that no single biomarker is sufficiently sensitive or specific on its own (10). Therefore, simultaneous use of several markers in multicolor flow cytometry increases the specificity of the identification and characterization of a particular subset of interest. Advances in analysis software, technologies to increase throughput (e.g., fluorescent cell barcoding (27-29), multi-well plate loaders), and quantitation of cell-surface markers (BD Quantibrite™ reagents) provide data-rich platforms that enhance the discovery and validation of new biomarkers. These improvements themselves contribute to the increasing need to standardize instrument setup, calibration, and analysis for successful complex multicolor flow cytometric applications.
Recently, there has been an increase in the use of flow cytometry for immune monitoring across multiple sites. Many approaches have been considered for standardizing these important analyses of leucocyte phenotype and function (30). Some of the main obstacles to standardizing immune monitoring studies include reagent manufacturing variations among different companies, reagent variability due to age, handling and storage conditions, and use of different site-specific protocols for sample handling. Customized lyophilized fluorescent antibody panels in a 96-well format have been successfully applied to minimize data variations (31). Additionally, lyophilized standard target cells have been used to standardize results among multicolor flow cytometric analyses within and between different sites by controlling variations in instrument performance or data analysis techniques.
Go to :
MULTIPARAMETER CELL CYCLE FLOW CYTOMETRY
Cell cycle regulation is a critical element of immune responses, allowing lymphocytes to transition between states of relative quiescence and periods of rapid clonal expansion or homeostatic regulation. Passage through the cell cycle is tightly regulated at multiple checkpoints, each of which can be modulated by factors such as cellular differentiation status, disease, and chemical modulation. A thorough understanding of the cell cycle is important for several reasons including the design of better vaccines that generate optimal numbers of protective effector and memory T and B cells, improved expansion of cells for adoptive cell transfer therapies, and for deeper understanding of how to counter the dysregulated cycling mechanisms of transformed cells. Cell cycle studies are commonly performed through flow cytometry in order to determine the proportion of cells at each phase of the cell cycle. High-resolution cell cycle analyses have benefitted tremendously from the development of fluorescent dyes and probes that can stain cellular DNA, RNA and protein in fixed or viable cells (25,32).
Fluorescent nucleic acid dyes such as acridine orange (AO) and propidium iodide (PI) have traditionally been used for characterizing cells within G0, G1a, G1b, S, and G2+M phases of the cell cycle (1,32,33). Other fluorescent probes such as 7-aminoactinomycin D (7-AAD), DAPI, Hoechst 33342, and DRAQ5 for staining cellular DNA and Pyronin Y (PY) for RNA staining are also used extensively for cell cycle analysis. The increased availability of dyes with distinct excitation and emission properties allows greater flexibility for combining nucleic acid analysis with other fluorochrome-labeled probes, such as fluorescent antibodies that can be used to simultaneously identify cell types and additional cellular characteristics (1,32). The different binding characteristics and optimal concentrations of fluorescent nucleic acid dyes require careful optimization studies before applying them to flow cytometric studies. The staining of total cellular protein with fluorescent dyes such as fluorescein can also be used along with fluorescent nucleic acid dyes to distinguish cells in various subcompartments of the cell cycle (25).
In addition to nucleic acid dyes, many other probes have been developed to characterize the nature of DNA-synthesizing and proliferating cells. The immunofluorescent staining of incorporated BrdU or other analogs of the DNA precursor thymidine enables high-resolution flow cytometric determinations of the frequency and nature of individual cells that have synthesized DNA in the course of a specific time interval (1,32). The recent introduction of a novel method for analyzing DNA synthesis based on Click chemistry detection of the thymidine analog 5-Ethynyl-2'-deoxyuridine (EdU) has further expanded the options for analyzing cell cycle by flow cytometry (34). CFSE and other fluorescent cell staining dyes become fluorescent within viable cells and are distributed uniformly between daughter cells during cellular division, making them useful tools for flow cytometric determination of the number of cell divisions completed by individual cells (1,32). Antibodies against proteins involved in promoting or inhibiting cell cycle progression (e.g., cyclins, Ki-67, phosphorylated histone H3, p21/Cip1, p27/Kip1) also provide insight into cell cycle status and regulation.
With the exception of AO, many of the fluorescent stains used for cell cycle analysis can be used with other fluorescent probes such as fluorochrome-labeled antibodies against cell subset-discriminating surface markers and functional intracellular molecules. Determination of the frequency and the nature of normal or treated cells that either do or do not respond to stimuli is crucial for better understanding of how complex cellular networks function. For this reason, multiparameter flow cytometric analyses of cellular development as well as the activation, proliferation (cell cycle entry and progression), differentiation, anergy and senescence of mature cells are featured in many immunophenotypic and functional studies.
Go to :
APOPTOSIS AND CELL DEATH
Programmed cell death plays a critical role in driving normal cellular development and function within the immune system (35). It prevents malignancy by eliminating cells that are unable to repair DNA damage (36), eliminates autoreactive lymphocytes during negative selection, and is also involved in restoring homeostasis during the resolution of an immune response. Flow cytometry has long been applied to the detection of dead and dying cells, allowing quantification of apoptotic and dead fractions within cell lines and primary cells. With the increasing research focus on unraveling and manipulating the molecular mechanisms underlying cell death, a large variety of complementary assays for analyzing apoptosis and cell death using flow cytometry has emerged (37).
Intrinsic apoptotic stimulation through DNA damage or endoplasmic reticulum stress activates the pro-apoptotic Bcl-2 family proteins Bax and Bak, resulting in mitochondrial outer membrane permeabilization (MOMP). MOMP is frequently associated with a loss of mitochondrial inner transmembrane potential (Δψ) and can be measured by fluorescent dyes capable of detecting changes in Δψ as indicators of early apoptotic events. While dyes such as rhodamine 123 (Rh123) and 3,3'-dihexiloxa-dicarbocyanine [DiOC6(3)] were among the original dyes used for this purpose, a number of alternative dyes with beneficial properties have become more heavily used over the past decade (37). One of the most commonly used flow cytometric approaches to apoptosis detection is measurement of the externalization of phosphatidylserine (PS). While healthy cells maintain an asymmetric distribution of phospholipids in their plasma membranes, apoptotic cells lose this asymmetry, resulting in the exposure of PS on the cell surface. Annexin V staining in conjunction with a membrane permeability dye, such as PI or 7-AAD, allows for the resolution between cells that are viable (Annexin V-/PI-), in the early stages of apoptosis (Annexin V+/PI-), or in the very late stages of apoptosis associated with secondary necrosis (Annexin V+/PI+).
A hallmark of apoptosis is the activation of the caspase family of cysteine proteases, which plays a critical role in the breakdown of intracellular components. In healthy cells, caspases exist as inactive pro-enzymes that in response to intrinsic or extrinsic apoptotic stimuli are activated by cleavage and dimerization, resulting in specific protease activity and ultimately the disassembly of the cell. There are multiple methods for detecting caspase activation by flow cytometry (38). Following fixation and permeabilization, cells can be stained intracellularly with fluorochrome-conjugated antibodies against the activated (cleaved) forms of specific caspases or against caspase cleavage products such as the 89-kDa fragment of poly ADP ribose polymerase (PARP). Alternatively, caspase activity may be analyzed in live cells using fluorescently labeled inhibitors of caspases (FLICA™) or cell-permeable, fluorogenic caspase substrates.
Other protocols for identifying apoptotic cells involve the detection of apoptosis-induced DNA fragmentation. Under particular staining conditions, DNA stains reveal a characteristic sub-G1 peak in apoptotic cells. DNA fragmentation can also be detected using TUNEL to fluorescently label double-strand breaks in DNA.
Each of the many flow cytometric methods for apoptosis detection and analysis has its own advantages and limitations [reviewed in detail in reference 37]. Many of the assays described previously may be combined to achieve multiparameter analyses of apoptosis at the single-cell level. Furthermore, markers of apoptosis may be analyzed simultaneously with indicators of DNA damage or cell cycle status, providing deep insight into cellular functions such as DNA damage repair and checkpoint control (39).
Go to :
ANALYSIS OF CELL SIGNALING AT THE SINGLE-CELL LEVEL
Protein phosphorylation is involved in many signaling pathways, with kinases playing a key role in the determination of cell fates ranging from cell growth and differentiation to anergy and apoptosis. Kinase dysfunction is associated with several diseases, including cancers, immunodeficiencies, and neurological disorders, making the analysis of protein phosphorylation a valuable tool for investigating disease mechanisms and identifying biomarkers with utility for diagnosis, patient stratification, and treatment monitoring (18). To evaluate cell signaling events by flow cytometry, cells are fixed to halt kinase and phosphatase activity, permeabilized to allow access to phosphoepitopes within intracellular signaling complexes, and then stained with fluorescent antibodies directed against the phosphorylated forms of signaling proteins of interest (40). Phospho-specific flow cytometry emerged in the late 1990s and early 2000s (41-46). Refinement of techniques for cellular fixation, permeabilization, and staining has since increased robustness and flexibility while enabling increasingly sophisticated analyses of intracellular signaling networks (47,48).
In comparison to lysate-based approaches, cytometric methods provide unique advantages for the study of cell signaling. The ability to simultaneously measure multiple fluorescence parameters per cell allows protein phosphorylation to be assessed in conjunction with cell surface markers, transcription factors, cell cycle proteins, and other important indicators of cellular phenotype and function. Thus, multiple cell populations of interest can be identified and analyzed within a heterogeneous mixture of cells. With the introduction of methods for lysing red blood cells during or after leucocyte fixation, whole blood samples can even be stimulated, fixed, permeabilized, and stained for flow cytometric analysis of phospho-signaling (48,49). The ability to analyze heterogeneous samples without the need for prior cell enrichment or sorting circumvents the risk of altering signaling responses during cell purification and facilitates the analysis of rare cell populations, while also saving time and making efficient use of small samples. Many studies have taken advantage of these technical benefits to analyze cell signaling within rare cells or limited donor sample material (50-52).
A key advantage of phospho-specific flow cytometry is its ability to evaluate signaling events with single-cell resolution. Using traditional biochemical techniques, a single lysate is made from each cell population of interest (e.g., CD4 T cells). Subsequent Western blot analysis produces an average measurement of the phospho-protein level expressed by the unseparated cell population. In contrast, flow cytometry allows site-specific protein phosphorylation to be measured within each cell in the population of interest. Thus, heterogeneous signaling responses by individual cells within bulk samples can be easily detected and investigated (Fig. 2).
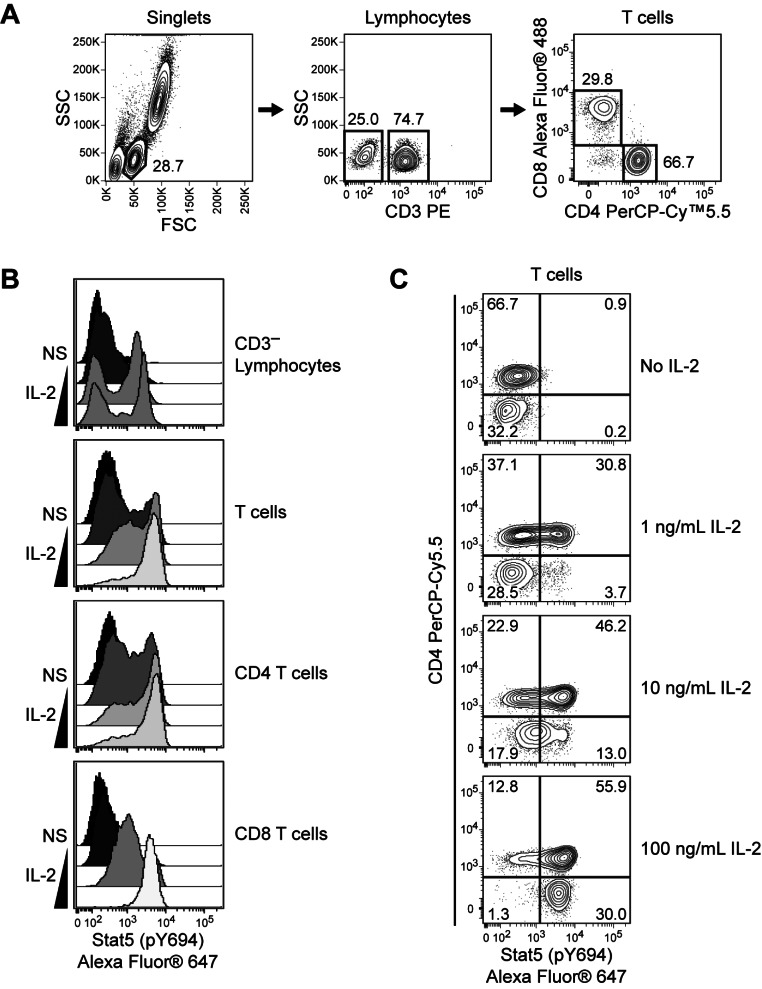 | Figure 2Detection of heterogeneous signaling responses within CD4 and CD8 T-cell populations. Human whole blood was stimulated with 0, 1, 10, or 100 ng/ml of recombinant human IL-2 for 15 minutes at 37℃ and fixed, permeabilized, and stained using the BD Phosflow™ human T cell activation kit. Data was acquired on a BD FACSVerse™ flow cytometer and analyzed using Cytobank software. Lymphocyte subpopulations were identified based on surface marker expression (Panel A), and Stat5 (pY694) phosphorylation responses were assessed within each subpopulation (Panel B) or within T cells (Panel C). IL-2 induced a dose-dependent increase in Stat5 (pY694) phosphorylation in T cells and a subpopulation of CD3- lymphocytes. Compared to CD8 T cells, a larger subpopulation of CD4 T cells responded at the lowest concentration of IL-2. However, a subpopulation of CD4 T cells remained unresponsive to IL-2 at the highest concentration, whereas the majority of CD8 T cells responded strongly.
|
When analyzing cell signaling using any technique, proper sample handling is critical. Cell signaling networks are sensitive indicators of cell status. Basal phosphorylation states and responses to exogenous stimuli can be affected by factors such as cell cycle status, as well as by delays in processing primary samples, stressful cell harvest or isolation conditions, and freezing and thawing procedures (40). Fixable viability stains are useful for excluding dead cells from analyses (53). Since light scattering characteristics change considerably upon cellular fixation and permeabilization, discrimination between live and dead cells based on scatter characteristics alone is not always possible.
Reagent selection is critical for the simultaneous detection of phospho-protein and surface marker epitopes. Unlike lysate-based approaches, which pool protein from many cells, the sensitivity of flow cytometric methods is limited by the amount of phospho-protein present within a single cell. Thus, phospho-specific flow cytometry requires high-affinity, highly selective antibodies that have been thoroughly validated for use in flow cytometry assays (40). While the availability of monoclonal antibodies validated for flow cytometry applications has increased substantially over the last decade, reagent availability is still far lower than that of Western blot. In addition to phospho-specific antibodies, a small number of antibodies have been validated for the flow cytometric detection of proteins with other post-translational modifications, such as acetylation. Fixation and permeabilization conditions used for phospho-specific flow cytometry negatively impact the staining of many surface marker epitopes, necessitating the optimization of staining conditions for detection of surface markers within permeabilized cells. A number of useful resources are available to assist with optimization of staining conditions (46,57, http://cytobank.org/facselect).
Go to :
HIGH-THROUGHPUT AND HIGH-CONTENT FLOW CYTOMETRY
Flow cytometry can be performed in high-throughput and high-content modes with up to 20 different parameters measured per cell (14). With high-throughput flow cytometry, hundreds and even thousands of samples can be stained and analyzed by flow cytometry (14,58). Automated sample preparation, staining, delivery, data acquisition and analysis are required for these types of studies. For example, fluorescence cell barcoding and multiplexing significantly increase the number of simultaneously detectable phenotypic and functional parameters acquired for every measured cell (27-29). High-throughput and high-content flow provide the capacity needed for an effective systems biology tool because large assay systems can be developed and run in a reasonable amount of time. These recent developments give flow cytometry an expanding role in drug and biological response modifier screening and are key to understanding cellular and molecular networks.
To interpret expression changes in a wide variety of proteins for a number of cell subtypes, the need for the development of novel bioinformatics tools cannot be overemphasized. Traditional methods involve gating of populations in one- or two-dimensional displays and manually selecting populations of interest. Such methods are highly subjective, time consuming, not easily scalable to a high number of dimensions, and are inherently inaccurate because they do not account for cell population overlap. Automated gating algorithms can reduce the subjectivity of manual gating and thereby improve reproducibility, but are generally limited to two-dimensional projections of the data and do not account for overlapping populations. Few of these methods address the important issue of visualizing the biology of complicated cellular progressions that may be defined by many correlated measurements.
Many groups have addressed these challenges with a variety of approaches for data analysis (59-61). A number of these approaches involve some variation of clustering analysis, which can have important limitations. For example, an important option in clustering is setting the desired number of clusters and the cluster linkage thresholds. If the selection of these setup options is not determined automatically, then different operators are likely to get different answers, resulting in lack of reproducibility. In addition, many clustering approaches are not optimized to identify marker expression transitions between clusters. These transitions are characteristic of the immunological systems they represent and therefore are equally important, if not more biologically relevant, as recognizing distinct clusters. Other approaches have been developed in addition to clustering, including principal components analysis (PCA) and Bayesian inference (62). These approaches have been evaluated through the FlowCAP initiative (http://flowcap.flowsite.org/). One unique approach, an algorithm called SPADE, utilizes down-sampling, clustering, minimum spanning tree and up-sampling algorithms to generate two-dimensional branched visualizations (63). The branched tree structure incorporates information from all measurements in the data, partially addressing scalability issues. However, SPADE has many of the same subjective inputs as conventional clustering algorithms (e.g. number of clusters) and also may have issues of reproducibility and generation of non-biological branches. Similar to the SPADE software, the Euroflow Consortium software called INFINICYT™ uses nearest-neighbor analysis to associate the data around the center of the mass of cells. Adopting Euclidean distance analysis, this software associates a normal profile for a cell type (through phenotyping of multiple normal samples) to identify and characterize an abnormal profile (64). Developed as a diagnostic tool, this approach is limited by the relative frequency of the cell subset of interest and restriction of the parameter chosen to determine the normal profile that was used to create the database.
An additional way to look at the data is using the probability state modeling (PSM) method (65) and the visualization tools in GemStone™ software for the analysis of multidimensional flow cytometry data. A probability state model is a set of generalized Q functions, one for each correlated measurement, where the common cumulative probability axis can be a surrogate for time or cellular progression. By exploiting the unique characteristics of Q functions, PSM can model any number of correlated measurements and present one comprehensive yet understandable view of the results. In summary, these various software packages work to reduce the complexity into a relatively small set of model parameters that are amenable to group statistics and comparisons. These features play an important role in better understanding normal and pathological changes in cellular immunity.
Go to :
RECENT ADVANCES IN FLOW CYTOMETRY
Owing to the spectral overlap between fluorescence labels and to the problems associated with biological stains, it has thus far been very difficult to extend beyond the simultaneous use of 18 different fluorescent probes for flow cytometric analyses. Recently, mass spectroscopy-based flow cytometry has been developed to enable higher content analyses (29,66,67). Instead of fluorochromes, heavy metal isotopes are conjugated to molecules that are linked to specific antibodies. This technology allows for a greater number of different "staining" antibodies to be used simultaneously for multiparameter cytometric analyses.
Because flow cytometry normally supplies little spatial information concerning target molecules of interest, the new technology of image flow cytometry has evolved (55,68,69). With this technology, streaming cells are individually imaged. This technology is not only useful for detecting molecules that are normally associated with a cell surface or intracellular compartment, but also for locating molecules that translocate in the course of a cellular response. As an example, cell surface-associated or cytoplasmic signaling molecules may translocate into the nucleus during the course of a cellular response.
Though traditionally used to identify cell types, flow cytometry can also be used for non-cell based assays. Relatively high-content and high-throughput flow cytometric particle- or bead-based immunoassays have been developed for simultaneously measuring multiple soluble analytes (e.g., hormones, cytokines, chemokines, inflammatory mediators and post-translationally-modified proteins) within small biological samples (5). These multiplexed bead immunoassay platforms (5-9) consist of a series of spectrally discrete fluorescent capture bead sets that are defined by their unique spectral characteristics and fluorescence intensities. These bead sets are used with calibrated standards and fluorescent detection antibodies to quantitate soluble analytes as described in Fig. 3. This has allowed cell based assays to be linked to cell function (release of soluble mediators) for elucidation of the immune network interaction.
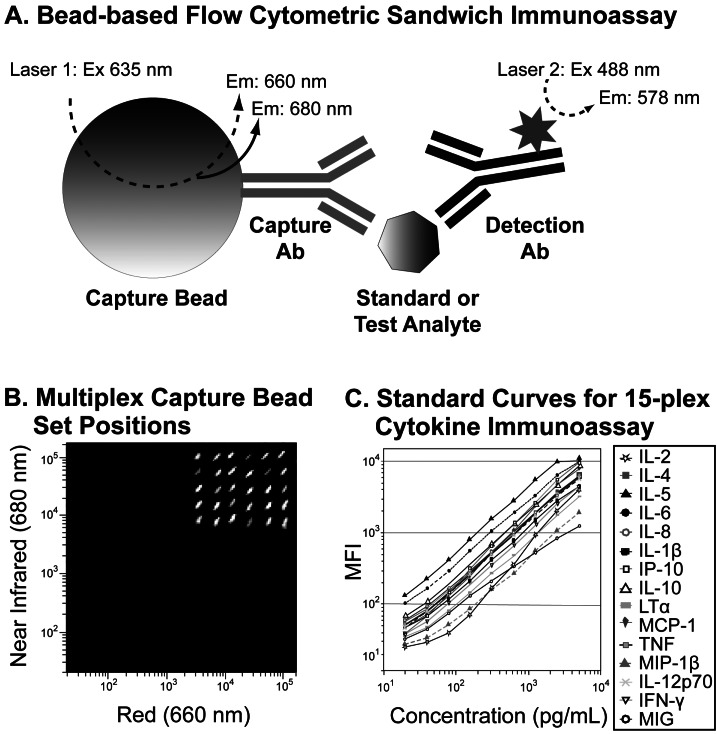 | Figure 3Multiplex flow cytometric immunoassays. Bead-based multiplex immunoassay principles are demonstrated using the BD™ Cytometric Bead Array (CBA) Flex Set system (Panel A). Each set of capture beads is labeled with two different fluorescent dyes and conjugated to a capture antibody specific for a particular analyte. When mixed with test samples or calibrated standards, the capture beads specifically bind and localize standard or test analytes to their surfaces. PE-labeled detection antibodies bind to another site on the analyte. Excitation of capture bead dyes by the red (635 nm) laser allows the identification of each set of capture beads based on its unique fluorescence intensities in the red (660 nm) and near-infrared (680 nm) channels. Beads with different two-color fluorescence positions can be combined to create relatively high content multiplex assays, such as the 30-plex assay shown (Panel B). Blue-laser (488 nm) excitation of the PE-labeled detection antibodies produces signal intensities commensurate with the amount of bound analyte. The flow cytometric data for each capture bead set can be analyzed to generate standard curves and to quantify the levels of specific analytes in test samples. Standard curves generated from a 15-plex Cytokine BD CBA Flex Set analysis are shown (Panel C).
|
The past decade has also produced substantial advances in conventional flow cytometry instrumentation (70). In addition to the development of new lasers and improved capabilities for instrument calibration and standardization, a clear trend towards the production of small, affordable, and easy-to-use cytometers has emerged (70,71). Additionally, the development of flow cytometers tailored to novel applications has produced powerful analyses of unusual sample types (72,73). Along with parallel enhancements in technologies for sample preparation, gene expression, and fluorescent probes, advances in flow cytometry hardware and accessibility have allowed flow cytometry to be adapted to the analysis of a wide variety of cells and particles across multiple fields of study. Flow cytometry has been applied to analysis of tiny particles including chromosomes, microparticles, and marine microbes, while also being adapted to the analysis and fluorescence-activated sorting of live, multicellular organisms ranging from 250 to 2,000 µm in size (72-74). In addition to providing insight into immunity and hematological malignancies, multiparameter flow cytometry has become a useful tool for investigating the biology of solid cancers, stem cells, plants, reproduction, and microbes (75-79).
Go to :
CONCLUSIONS
Over the past 40 years, flow cytometry has developed into a leading technology that supports many applications designed to study the nature of individual cells within homogeneous or mixed cell populations. Ongoing development of new lasers, fluorescent probes, and standardization reagents; automated sample preparation and delivery; digital signal generation; and data acquisition and analysis capabilities have contributed to significant improvements and extensions of flow cytometry into many fields of study. These advances have enabled high-throughput and high-content flow cytometric determination of molecular and cellular networks that underlie complex biological systems in health and disease. This continual progress has driven flow cytometry to emerge as a critical tool in the systems biological approach to research.
Go to :
 XML Download