

 PDF
PDF ePub
ePub Citation
 Print
Print


Abbreviations
PrPc
cellular prion protein
PrPSc
scrapie prion protein
IKK
IKB kinase
SEAP
secreted embryonic alkaline protease
HEK
human embryonic kidney
HEK 293E
HEK293 cells stably expressing the Epstein-Bar virus nuclear antigen 1
mRFP
monomeric red fluorescence protein
Syk
spleen tyrosine kinase
Pyk2
protein tyrosine kinase 2
INTRODUCTION
The cellular prion protein (PrPC) is a 32 kDa glycosylphosphatidylinositol (GPI)-anchored glycoprotein found in specific structures of the cell membrane called lipid rafts (1). The N-terminal half of PrPC is largely unstructured and is composed of a signal peptide and five octapeptide-repeat regions known to be binding sites for Cu2+ (2). The C-terminal half of PrPC is folded into three alpha helices and two short beta-strands containing two oligosaccharide chains and a GPI-anchor at the end (3,4). Conformational conversion of PrPC to a misfolded protein termed scrapie prion protein (PrPSc) is a major pathogenesis of transmissible spongiform encephalopathies (TSE), or the prion diseases, in animals and humans (5,6).
PrPC is highly expressed in the central nervous system (CNS) and this is the major site of prion pathology (7). PrPC is also expressed in many types of immune cells including lymphocytes, natural killer (NK) cells, monocytes, dendritic cells (DCs), macrophages, and follicular dendritic cells (8-12). In addition, PrPC is known to be proteolytically shed by metalloproteinase (13,14), and a substantial amount of soluble PrPC is found in the culture medium of splenocytes and in human serum (15). However, the function of membranebound PrPC or soluble PrPC in regulation of immune cells remains to be elucidated.
Physiological roles for PrPC in monocytes and macrophages have been reported in several studies (16,17). Originally, PrPC was proposed to be a negative regulator of phagocytosis as macrophages from PrPC-deficient mice showed greater phagocytic activity than macrophages from wild-type mice (18); however, recent studies with another line of PrPC-deficient mice demonstrated that PrPC enhanced phagocytic activity of macrophages (19,20). In addition, pseudopodium extension arrest and cell detachment were observed in macrophages from PrPC-deficient mice (19). The effects of soluble PrPC protein has also been studied (21). In this regard, it was found that soluble PrPC protein activated several signaling proteins in mouse monocyte/macrophage cells, including ERK-1/2 and Akt kinase which are known to regulate phagocytosis, migration, and cytokine production by monocytes (21).
In the present study, we further investigated a role for PrPC in regulation of monocyte function. In particular, the effect of a soluble form of PrPC on monocytes was studied. To this end, we prepared a recombinant form of soluble human PrPC as a fusion protein with the Fc portion of human IgG1 (designated as soluble PrPC-Fc). We demonstrated that soluble PrPC-Fc induced differentiation of monocytes to macrophage-like cells, and enhanced adherence and phagocytic activity of monocytes. In addition, soluble PrPC-Fc stimulated monocytes to produce pro-inflammatory cytokines such as TNF-α, IL-1β, and IL-6. We also demonstrated that soluble PrPC-Fc exerted its effects on monocytes via activation of the ERK and NF-κB signaling pathways.
MATERIALS AND METHODS
Reagents
LPS was purchased from Invivogen (San Diego, CA). PMA was purchased from Sigma-Aldrich (St. Louis, MO). PD98059, SN50, and SB203580 were purchased from Calbiochem-Behring (La Jolla, CA). FITC-conjugated Abs against CD1a and CD11b, and control IgG were purchased from BD Biosciences (San Jose, CA). Abs against ERK-1/2, IKK, IκB, and the phosphorylated form of each protein were purchased from Cell Signaling Technology (Beverly, MA).
Cells and cell culture
Human monocytic leukemia THP-1 cells were obtained from American Type Culture Collection (Manassas, VA). Human primary monocytes were obtained from PBMCs of normal donors. Primary monocytes were isolated from PBMCs with CD14 magnetic beads (Miltenyi Biotec, Auburn, CA). The purity of the isolated monocytes was verified with anti-CD14-FITC Ab (BD Biosciences) staining and flow cytometric analysis. The purity of isolated human monocytes was typically 90~94%. THP-1 Blue™ cells, which are THP-1 cells with an NF-κB-inducible secreted embryonic alkaline phosphatase (SEAP) reporter, were purchased from Invivogen. Cell culture was maintained in RPMI-1640 medium supplemented with 10% heat-inactivated FBS, penicillin G (100 IU/ml), streptomycin (100µg/ml), L-glutamine (2 mM), HEPES (10 mM), and sodium pyruvate (1.0 mM).
Production of recombinant soluble human PrPC-Fc
A recombinant form of soluble human PrPC protein consists of amino acids 21~229 of human PrPC fused with the Fc portion of human IgG1 at the C-terminus. Soluble PrPC-Fc was expressed in HEK 293E cells and purified on a protein A-Sepharose column (Amersham Biosciences, Sunnyvale, CA) according to the manufacturer's instructions. Human IgG1 Fc without the PrPC protein was also expressed and purified using the same methods, and was used as a negative control. The purified recombinant protein was dialyzed with PBS, analyzed by SDS-PAGE, and then analyzed with the Limulus Amebocyte Lysate Test Kit (Cape Cod, East Falmouth, MA) to determine the endotoxin level. The endotoxin level in the recombinant protein preparations was less than 10 EU/ml.
Soluble PrPC binding assays to monocytes
Human primary monocytes were fixed with 4% paraformaldehyde for 10 min and blocked with 5% normal goat serum for 30 min. They were then incubated with control Fc or with soluble PrPC-Fc at various concentrations, followed by labeling with FITC-conjugated anti-human IgG. Flow cytometry was performed using LSRII (BD Biosciences), and the data were analyzed using FlowJo software (Treestar, San Carlos, CA).
Cell adherence assay and phagocytosis assay
Cell adhesion assay was performed as described previously (22). Briefly, ten thousand THP-1 cells were plated in each well of a 96-well culture plate and treated with soluble PrPC-Fc for 30 min. The plate was then washed three times with PBS, and microscopic photographs were taken. The cells were fixed in methanol, stained with a 10% (v/v) solution of Giemsa (Sigma-Aldrich), and the number of adherent cells was evaluated over 10 fields. For each well, the ratio between the number of cells in 10 fields after plating (NT) and the number of adherent cells in 10 fields after culturing and washing (NA) was defined as the percent adherence (NA/NT X 100). To measure phagocytosis, primary monocytes were differentiated for 48 h in the presence of soluble PrPC-Fc. Then, cells were incubated for 6 h with Escherichia coli that expressed monomeric red fluorescent protein (mRFP). The cells were washed with cell culture medium without FBS, and the fluorescence intensity was assessed by flow cytometry.
Quantification of cytokine production
Primary monocytes were incubated with soluble PrPC-Fc for 36 h. The culture supernatants were collected, and the concentrations of TNF-α, IL-1β, and IL-6 were determined using the Quantikine Assay Kit (R&D Systems, Minneapolis, MN) according to the manufacturer's instructions. For inhibition of specific signaling pathways, PD98059 (20µM), SN50 (10µM), or SB203580 (10µM) were added to monocyte cultures 1 h before soluble PrPC-Fc treatment.
Western blot
To analyze levels of ERK-1/2, IKK, IκB, and the phosphorylated form of each protein, cells were lysed in ice-cold lysis buffer (50 mM Tris-HCl, pH 7.4, containing 150 mM NaCl, 1% Nonidet P-40, 0.1% SDS, 0.1% deoxycholate, 5 mM sodium fluoride, 1 mM sodium orthovanadate, 1 mM 4-nitrophenyl phosphate, 10µg/ml of leupeptin, 10µg/ml of pepstatin A, and 1 mM 4-(2-aminoethyl) benzenesulfonyl fluoride). Cell lysates were centrifuged at 15,000 g for 5 min at 4℃. The supernatant was mixed with SDS sample buffer, boiled for 5 min, and then separated by 12% SDS-PAGE. The protein was transferred to nylon membranes by electrophoretic transfer. The membrane was blocked in 5% skim milk, rinsed, and incubated with a specific Ab in PBST overnight at 4℃. The membrane was rinsed four times in PBST, and incubated with 0.1µg/ml peroxidase-labeled secondary Ab for 1 h. After rinsing three times in PBST, specific bands were visualized by enhanced chemiluminescence.
SEAP reporter assay
THP-1 Blue™ cells contain a reporter plasmid that expresses a secreted embryonic alkaline phosphatase (SEAP) under the control of NF-κB and AP-1 transcription factors. THP-1 Blue™ cells were incubated with soluble PrPC-Fc for 48 h. To quantify secreted SEAP, the culture supernatant was incubated with QUANTI-Blue™ colorimetric assay reagent (Invivogen) for 24 h at 37℃. The OD at 655 nm was measured with a VERSAmax Tunable microplate reader (Molecular Devices, Toronto, Ontario, Canada). All assays were run in triplicate.
RESULTS
Soluble PrPC-Fc binds to the cell surface of human monocytes
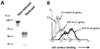
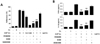
To study the function of soluble PrPC on monocytes, we prepared a recombinant form of soluble human PrPC (PrPC-Fc). PrPC-Fc consists of amino acids 21-229 of human PrPC fused to the Fc portion of human IgG1 at the C-terminus. Soluble PrPC-Fc was expressed in HEK293E cells, purified from culture supernatant, and analyzed by SDS-PAGE (Fig. 1A). First, we evaluated whether soluble PrPC-Fc bound to the cell surface of human monocytes. Flow cytometric analysis showed dose-dependent binding of soluble PrPC-Fc to human monocytes (Fig. 1B). This result indicates that human monocytes express a putative binding partner of soluble PrPC-Fc on their cell surface.
Soluble PrPC-Fc induces differentiation of monocytes into macrophage-like cells
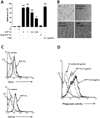
We next studied the effects of soluble PrPC-Fc on monocytic cell function. We found that soluble PrPC-Fc induced adherence of THP-1 monocytic cells within 30 minutes in a dosedependent manner that was comparable to adherence induced by treatment with PMA (Fig. 2A). Notably, THP-1 cell adherence was not induced by heat-denatured PrPC-Fc (Fig. 2A). Moreover, after two days of culture with soluble PrPC-Fc, THP-1 cells became flattened and exhibited a macrophagelike morphology, similar to that seen with PMA treatment (Fig. 2B). The expression of CD1a and CD11b on the cell surface of human monocytes was also significantly increased in response to soluble PrPC-Fc (Fig. 2C). Next, we studied phagocytic activity by co-culturing human monocytes with mRFP-expressing E. coli. As measured by flow cytometry, we found that after 48 hours of culture with soluble PrPC-Fc, phagocytic activity of human monocytes was significantly enhanced in a dose-dependent manner (Fig. 2D). Taken together, soluble PrPC-Fc induces monocytes to acquire a macrophage-like phenotype including increased cell adherence, macrophage-like morphology, expression of cell surface markers such as CD1a and CD11b, and enhanced phagocytic activity.
Soluble PrPC-Fc stimulates monocytes to produce pro-inflammatory cytokines
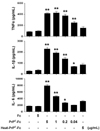
We investigated whether soluble PrPC-Fc stimulated monocytes to produce pro-inflammatory cytokines. Human monocytes were cultured in the presence or absence of soluble PrPC-Fc for 36 hours, and the concentrations of TNF-α, IL-1β, and IL-6 were measured in culture supernatants. The production of TNF-α, IL-1β,, and IL-6 was stimulated by soluble PrPC-Fc in a dose-dependent manner, but not by heat-denatured PrPC-Fc (Fig. 3).
Soluble PrPC-Fc activates signaling pathways for ERK and NF-κB
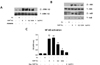
Next, we studied whether soluble PrPC-Fc activates intracellular signaling pathways in THP-1 cells. In particular, we investigated activation of ERK and NF-κB, which are known to regulate differentiation of monocytes and production of pro-inflammatory cytokines (23). Following soluble PrPC-Fc treatment, phosphorylation of ERK-1/2 was increased while the total amount of ERK-1/2 remained unchanged (Fig. 4A). A MEK-specific inhibitor, PD98059, abrogated ERK-1/2 phosphorylation induced by soluble PrPC-Fc (Fig. 4A). In addition, soluble PrPC-Fc increased phosphorylation of IKK and IκBα in monocytes (Fig. 4B), suggesting that the NF-κB pathway is also activated in response to PrPC-Fc treatment. We further evaluated NF-κB activity using a SEAP reporter assay in which THP-1 Blue™ cells secrete SEAP into the culture supernatant upon NF-κB activation. We found that NF-κB activity was increased in response to soluble PrPC-Fc in a dose-dependent manner, but not by heat-denatured PrPC-Fc (Fig. 4C).
Monocyte adherence and cytokine production by soluble PrPC-Fc depend on ERK and NF-κB signaling
As soluble PrPC-Fc activates ERK and NF-κB in monocytes, we studied whether ERK or NF-κB signaling is responsible for the downstream effects stimulated by this protein. To elucidate the role of each signaling pathway, we treated cells with specific signaling inhibitors including PD98059 to inhibit the ERK pathway and SN50 to inhibit the NF-κB pathway, one hour before soluble PrPC-Fc treatment. SB203580 was also used to inhibit the p38 signaling pathway. First, we found that THP-1 cell adherence induced by soluble PrPC-Fc was significantly inhibited by PD98059 and by SN50, but not by SB203580 (Fig. 5A). Pro-inflammatory cytokine production by monocytes was also studied. Similar to cell adherence, soluble PrPC-Fc-induced production of TNF-α and IL-1β was significantly inhibited by PD98059 and by SN50, but not by SB203580 treatment (Fig. 5B). Taken together, soluble PrPC-Fc induces adherence and cytokine production of monocytes via activation of ERK and NF-κB.
DISCUSSION
PrPC is a GPI-anchored protein found in lipid rafts of the cell membrane and expressed in immune cells as well as cells of the central nervous system. While PrPC is known to be proteolytically shed by metalloproteinase (13,14), and a substantial amount of soluble PrPC is found in the culture medium of splenocytes and in human serum (15), the precise function of soluble PrPC in immune regulation is unknown. In the present study, we investigated the roles for the soluble form of PrPC in the regulation of monocytes and found that this molecule enhanced the adherence and phagocytic activity of these cells. Furthermore, soluble PrPC stimulated monocytes to produce pro-inflammatory cytokines such as TNF-α, IL-1β, and IL-6.
The effect of soluble murine PrPC protein on monocytes was previously examined. In this study, a recombinant murine PrPC-Fc fusion protein was generated in a manner similar to the one we used to generate recombinant human PrPC-Fc (21). Soluble murine PrPC-Fc protein bound to the surface of mouse monocyte/macrophage cells, and activated Src-like kinases as well as Syk and Pyk2. In addition, ERK-1/2 and Akt were activated, suggesting a role for soluble PrPC in phagocytosis, migration, and cytokine production by monocytes (21). In the current study, we also found activation of ERK and NF-κB pathways in human monocytes in response to soluble PrPC-Fc treatment. Furthermore, ERK and NF-κB signaling pathways were found to be required for soluble PrPC-Fc-induced adherence and cytokine production by monocytes. Further studies will be required to elucidate the precise role of each signaling pathway in the regulation of monocyte function by soluble PrPC protein.
Although binding of soluble PrPC to the cell surface of monocytes was demonstrated in the current study (Fig. 1B) and in a previous study (21), we did not identify a binding partner for soluble PrPC on the surface of monocytes. PrPC is known to bind to the neural cell adhesion molecule (N-CAM) (24), and to the laminin receptor and laminin receptor precursor protein (25-27). A putative role for a homotypic interaction between soluble PrPC and membrane PrPC also needs to be investigated. All these possibilities need to be investigated in future studies.
Physiological roles of PrPC in monocytes and macrophages have been studied in PrPC knockout mice. Originally, PrPC was proposed to act as a negative regulator of phagocytosis because macrophages from PrPC-deficient mice showed higher phagocytic activity than those from wild-type mice (18). In contrast, recent studies with another line of PrPC-deficient mice demonstrated that PrPC enhanced phagocytic activity of macrophages (19,20). In addition, pseudopodium extension arrest and cell detachment were observed in macrophages from PrPC-deficient mice (19). In the present study, we focused on the effects of the soluble form of PrPC on monocytes and showed that soluble PrPC protein enhanced cell adherence and phagocytic activity of monocytes. Our results are consistent with the more recent studies with PrPC knockout mice (19,20), however, membrane-bound PrPC and soluble PrPC need to be considered separately when data from PrPC knockout mice are interpreted.
In conclusion, we studied the function of soluble PrPC protein in regulation of monocyte function using a recombinant form of soluble human PrPC fused with the Fc portion of IgG1. We found that soluble PrPC-Fc enhanced adherence, phagocytosis, and cytokine production by monocytes via activation of the ERK and NF-κB signaling pathways. Detailed mechanisms for the action of soluble PrPC on monocytes will be further investigated in subsequent studies.
 XML Download