

 PDF
PDF ePub
ePub Citation
 Print
Print


INTRODUCTION
Toll-like receptors (TLRs) are representative pattern recognition receptors (PRRs), which recognize specific pathogen-associated molecular patterns (PAMPs) such as bacterial diacyl/triacyl lipopeptides, peptidoglycan, lipoteichoic acid (LTA), lipopolisaccharide (LPS), flagellin, unmethylated DNA (CpG), viral ssRNA/dsRNA, and fungal zymosan. In general, it is well known that TLRs are expressed on innate immune cells, macrophages and dendritic cells, and trigger innate immune response (1). However, recent studies have revealed that PAMPs-PRRs responses link between innate and adaptive immune system (2).
It has been demonstrated that BCR cross-linking with Ag, B cell-T cell (CD40-CD40L) interaction, and optimal TLR stimulation of B cells are sufficient for B cell activation, proliferation, isotype switching, and differentiation to memory B cells and plasma cells expressing high-affinity antibodies (Abs) (3,4). On the other hand, cytokines produced by other immune cells such as T cells and macrophages directly help B cell to activate and undergo isotype switching. In addition, it has been suggested that dendritic cells (DCs) stimulation with TLR ligands, CpG and poly I:C, specifically induces APRIL production by DCs and this APRIL activates B cells in T cell-independent (TI) pathway (5).
Immunoglobulin (Ig) class switch recombination (CSR) is a mechanism that causes the production of antibodies to change from IgM or IgD to the other Ab isotypes which determine functions of humoral immunity. T cell-dependent (TD) B cell Ab responses require approximately a week, which is too much of a delay to defense fast-replicating pathogens such as pathogenic E. coli and influenza virus. To overcome this limitation, extrafollicular B cells rapidly undergo CSR, seemingly through TLR-mediated TI pathway (6). As a result, class switched-IgG, IgE, and IgA as well as IgM are produced. Consistent with the concept, it is demonstrated that naïve B cells proliferate and secrete Ab to a variety of TLR agonists in vitro, in the absence of B cell receptor cross-linking or T cell help (7). Mouse and human B cells are known to express various TLRs, TLR1~9 and TLR11 (4,7-9).
The CpG motifs of bacterial DNA, an agonist of TLR9, plays an important role in early Ab responses against pathogens. CpG DNA induces mouse and human to B cell to proliferate and secrete Ig in vitro and in vivo (10-12). In addition, CpG DNA markedly augments the proliferation and generation of plasma cells from naïve and memory B cells and dramatically increases plasma cell generation from germinal center B cells in human (13). Several studies have demonstrated that CpG directly induces expression of the transcription factor T-bet which requires CpG-induced IgG2a expression but inhibits IgG1 and IgE switching in B cells (14-16). In addition, CpG directly stimulates B cells to undergo isotype switching to IgG2a (17) and CpG redirects Igs production by mouse B cells to "Th1-like" Ig isotypes (IgG2a, IgG2b, and IgG3) while suppressing Th2 isotypes (IgG1 and IgE) (18).
Thus, CpG directly affects B cell proliferation, isotype switching, and differentiation. Nevertheless, the detailed role of CpG in B cell growth and Ig production and the cooperative effects between CpG and other TLR agonists on B cell activation is still not fully understood. In this study, we analyzed the effect of CpG on the kinetics of mouse B cell viability, proliferation, and Igs production. In essence, we found that doses of TLR9 agonist CpG and TLR4 agonist LPS are important in B cell proliferation and differentiation and that these two PAMPs can cooperate leading to Igs production.
Go to : 
MATERIALS AND METHODS
Animals
BALB/c mice were purchased from Damool Science (Daejeon, Korea) and maintained on an 8:16 h light:dark cycle in an animal environmental control chamber. Eight- to twelve-week-old mice were used, and animal care was in accordance with the institutional guidelines of Institutional Animal Care and Use Committee of Konyang University.
Cell culture and reagents
Untouched mouse spleen resting B cells were obtained by depletion of CD43+ cells using anti-CD43 microbeads and high-gradient magnetic cell separation (MACS; Miltenyi Biotec, Bergisch Gladbach, Germany) according to manufacturer's instructions. Briefly, BALB/c mouse spleen cell suspensions were washed with HBSS (WelGENE, Daegu, Korea) and treated with 0.83% ammonium chloride to lyse red blood cells. Spleen cells were treated with anti-mouse CD43 microbeads and depleted with LS column and MACS Separator (Miltenyi Biotec). The purity of resting B cells (CD43-B220+) assessed by FACSCalibur (BD Biosciences, San Jose, CA, USA) following staining of the cells with anti-CD43 FITC (eBioscience, San Diego, CA, USA) and anti-B220 PE (BD Biosciences). Cells were cultured at 37℃ in a humidified CO2 incubator (Forma Scientific, Marietta, OH, USA) in RPMI-1640 medium (WelGENE) supplemented with 10% fetal bovine serum (PAA Laboratories, Etobicoke, ON, Canada). Cells were stimulated with CpG ODN1826 (Invivogen, San Diego, CA, USA), LPS (12.5µg/ml, E. coli 0127:B8, Sigma, St. Louis, MO, USA), TGF-β1 (0.2 ng/ml, R&D Systems, Minneapolis, MN, USA), and retinoic acid (20 nM, Sigma).
Cell viability and proliferation assays
Cell viability was determined by EZ-Cytox cell viability assay kit (Daeil Lab Service Co, Seoul, Korea) according to the manufacturer's instructions. Briefly, 20µl of EZ-Cytox kit reagent was added to each cell cultured well of a 96-well microplate and then incubated at 37℃ in a humidified CO2 incubator for 3 h. After incubation, optical density (OD) was measured at a wavelength of 450 nm using an Absorbance Microplate Reader (BioTek Instruments, Inc., Winooski, VT, USA). For cell proliferation assay, purified mouse resting B cells were labeled with CFSE (eBioscience) and then added with stimuli (CpG, LPS, TGF-β1, and retinoic acid). Dilution of CFSE was measured by counting 10,000 cells with a FACSCalibur.
Isotype-specific ELISA
Antibodies produced in B cell cultures were detected by using isotype-specific ELISA. Affinity purified anti-isotype specific antibodies were added at 1.2µg/ml in 0.05 M sodium bicarbonate buffer (pH 9.3) to 96-well U bottomed polyvinyl microplates (Falcon, Becton Dickinson & Co., Oxnard, CA, USA). Plates were washed with PBS containing 0.05% Tween-20 (PBST) followed by overnight incubation at 4℃, and blocked for 1 h with 0.5% BSA solution. After washing, 50µl of standard myeloma proteins and culture supernatants were added to each well and incubated for 1 h at 37℃. After washing, horseradish-peroxidase (HRPO) conjugated anti-isotype specific antibodies (Southern Biotechnology, Birmingham, AL, USA) were added to each well and incubated for 1 h. Plates were then washed and TMB substrate (BD Biosciences) was added. After incubation, 0.05 M sulfuric acid was added to each well and colorimetric reaction was measured at 450 nm with an Absorbance Microplate Reader.
Statistical analysis
Statistical differences between experimental groups were determined by analysis of variances. Values with p<0.05 by an unpaired two tailed Student's t test were considered significant.
Go to :
RESULTS AND DISCUSSION
CpG induces mouse B cell growth and Igs production in a dose-dependent manner
To elucidate the direct effect of CpG on B cell activation and differentiation, we used untouched resting B cells (CD43-B220+) from mouse spleen in this study. As shown in Fig. 1A, purity of the resting B cells assessed by flow cytometric analysis was higher than 97%. To determine the basic property of CpG in mouse B cell activation, we first examined the effect of CpG on mouse B cell growth. As shown in Fig. 1B, CpG constantly increased cell growth up to 2 days and dose-dependently sustained cell viability on day 3 of culture. Overall cell viability on day 3 was lower than day 2. This seems due to the exhaustion of nutrients in the culture media. In addition, we observed that CpG induces cell proliferation in a dose-dependent manner (Fig. 1C). Thus, CpG can act as a potent B cell mitogen and this is consistent with an earlier report that CpG induces B cell cycle entry and cell survival (19). Since CpG strongly increased B cell proliferation, it was important to explore whether it affects Igs production. As shown in Fig. 1D, CpG dose-dependently increased all Ig isotypes production and this function was consistent with results from cell growth.
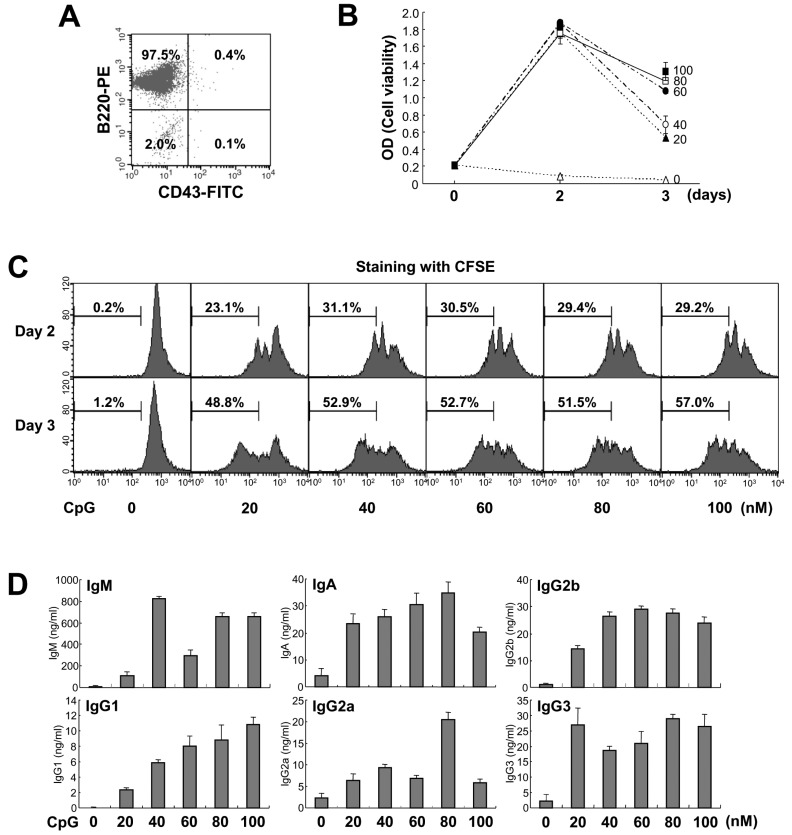 | Figure 1Effect of CpG on mouse B cell growth and Igs production. (A) Purified mouse spleen resting B cell population (CD43-B220+) was measured by flow cytometric analysis. Data shown are representative of all the experiments carried out in this study. (B) Resting B cells were stimulated with the indicated doses of CpG (0 nM, open triangle; 20 nM, closed triangle; 40 nM, open circle; 60 nM, closed circle; 80 nM, open square; 100 nM, closed square). After 2 and 3 days of culture, cell viability was measured by EZ-Cytox cell viability assay. Data are averages of duplicate samples with ranges (bars). (C) Culture conditions were the same as in (B). After 2 and 3 days of culture, cell proliferation was measured by the dilution of CFSE. The percentage indicates cells (%) with low level of CFSE intensity. (D) Culture conditions were the same as in (B). After 7 days of culture, supernatants were harvested and the levels of Igs production were determined by isotype-specific ELISA. Data represent means±SEM of triplicate samples.
|
CpG is more potent than LPS in cell proliferation but lesser in Igs production
LPS is a well-known mitogen for mouse B cells and a stimulant for TLR4 (20,21). Therefore, we next compared the effects of CpG and LPS on B cell growth and Igs production. Along with LPS, we adopted TGF-β1 to determine whether CpG can support TGF-β1-induced IgA expression. TGF-β1 is a well-known IgA class switching factor in mouse B cells (22,23). Here, we used 100 nM CpG because this dosage showed great B cell viability and proliferation as shown in Fig. 1B and C. CpG enhanced cell viability and proliferation and this effect was greater than that of LPS on day 2 of culture (Fig. 2A and B). In addition, we found that these two stimuli have neither additive nor synergetic effect on cell viability. As previously shown by other (24), TGF-β1 markedly inhibited the increase of cell viability and proliferation caused by LPS on day 2 of culture (Fig. 2A and B). However, TGF-β1 did not inhibit CpG-induced cell viability and had a little effect on inhibiting CpG-induced cell proliferation. This different effect of TGF-β1 between LPS and CpG is likely to arise because mitogenic potency of CpG is greater than that of LPS. As for Ig production, CpG was less stimulatory than LPS, especially IgM and IgG2b isotypes (Fig. 2C). Interestingly, CpG decreased LPS-induced IgM production (Fig. 2C) although the cell viability and proliferation were not decreased under the same conditions (Fig. 2A and B). On the other hand, CpG was unable to support TGF-β1-induced IgA and IgG2b production (Fig. 2C). This result is sharply contrasted to that of LPS. In addition, CpG also down-regulated TGF-β1-induced IgA/IgG2b production in the presence of LPS. We assumed that this effect of CpG is attributed to its excessive mitogenic property. To resolve these unexpected results, we decided to test low doses of CpG in cell viability and cell proliferation. As shown in Fig. 3, we observed that 10 nM CpG looks sufficient for supporting cell viability and proliferation. Therefore, 10 nM CpG was used for further experiments.
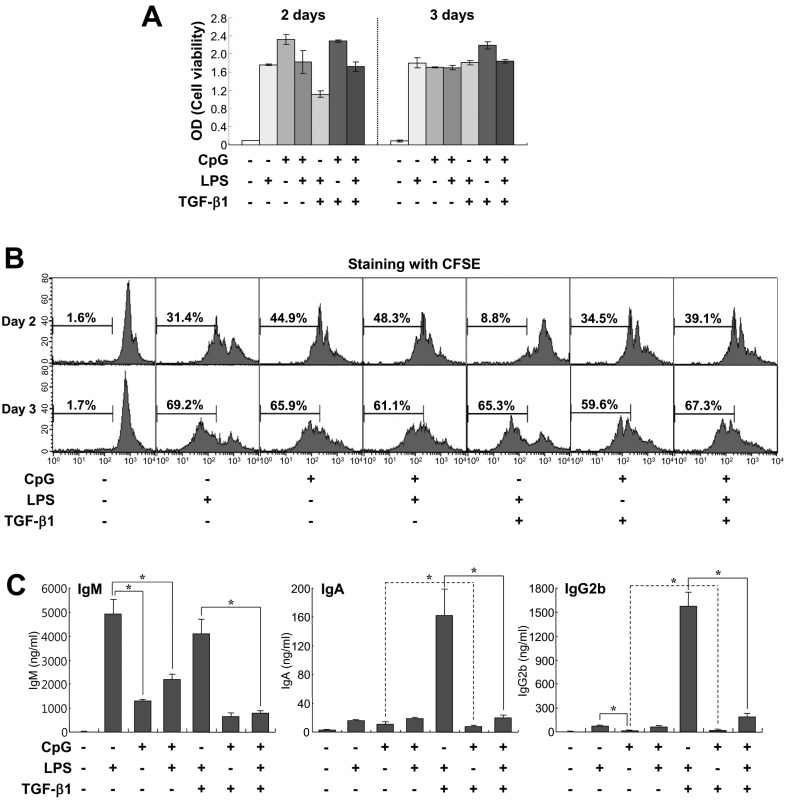 | Figure 2Comparison of effects of CpG and LPS on B cell growth and Igs production. Mouse spleen resting B cells were stimulated with CpG (100 nM), LPS (12.5µg/ml), and TGF-β1 (0.2 ng/ml). (A) After 2 and 3 days of culture, cell viability was measured by EZ-Cytox cell viability assay. Data are averages of duplicate samples with ranges (bars). (B) After 2 and 3 days of culture, cell proliferation was measured by the dilution of CFSE. (C) After 7 days of culture, supernatants were harvested and the levels of Igs production were determined by isotype-specific ELISA. Data represent means±SEM of triplicate samples. *p<0.05.
|
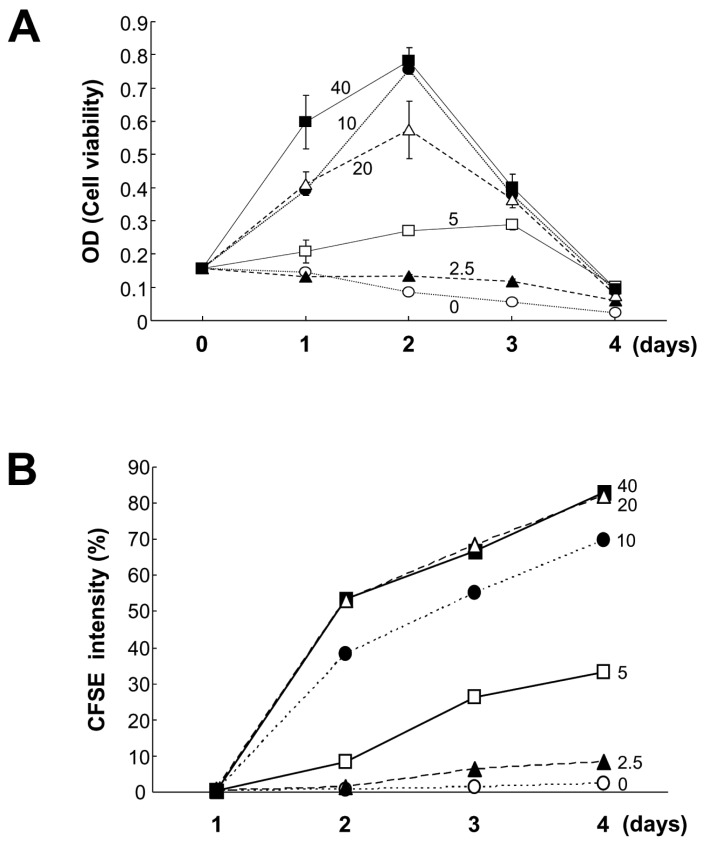 | Figure 3Effects of lower doses of CpG on B cell viability and proliferation. Mouse spleen resting B cells were stimulated with the indicated doses of CpG (0 nM, open circles; 2.5 nM, closed triangles; 5 nM, open squares; 10 nM, closed circles; 20 nM, open triangles; 40 nM, closed squares). After 1, 2, 3, and 4 days of culture, cell viability was measured by EZ-Cytox cell viability assay (A), and cell proliferation was measured by the dilution of CFSE (B). CFSE intensity (%) of panel B represents the percentage of cells with a low level of CFSE intensity. Data are averages of duplicate samples with ranges (bars).
|
Effect of low dose CpG on TGF-β1- and RA-induced Igs production
Next, we tested the effect of 10 nM CpG on Igs production in parallel with LPS. We used TGF-β1 and retinoic acid (RA) as anti-proliferative agents to alleviate the excessive proliferative activity of CpG. It was reported that RA specifically induces IgA expression (25,26). As shown in Fig. 4, 10 nM CpG was still less stimulatory than LPS in IgM and IgA production as seen in high concentration of CpG. LPS supported TGF-β1-induced IgA secretion but not CpG (Fig. 4). Interestingly, CpG supported RA-induced IgA production. This different action of CpG may be caused by different anti-proliferative effects of TGF-β1 and RA to properly regulate B cell growth and differentiation into cells producing Abs. In addition, unlike 100 nM CpG, 10 nM CpG did not reduce LPS/TGF-β1-induced IgA production. Moreover, when RA was added on day 0, CpG substantially increased LPS/RA-induced IgA production (Fig. 4). These results suggest that CpG can regulate the mouse B cell proliferation and differentiation and that optimum dosage of CpG can cooperate with LPS to produce Igs.
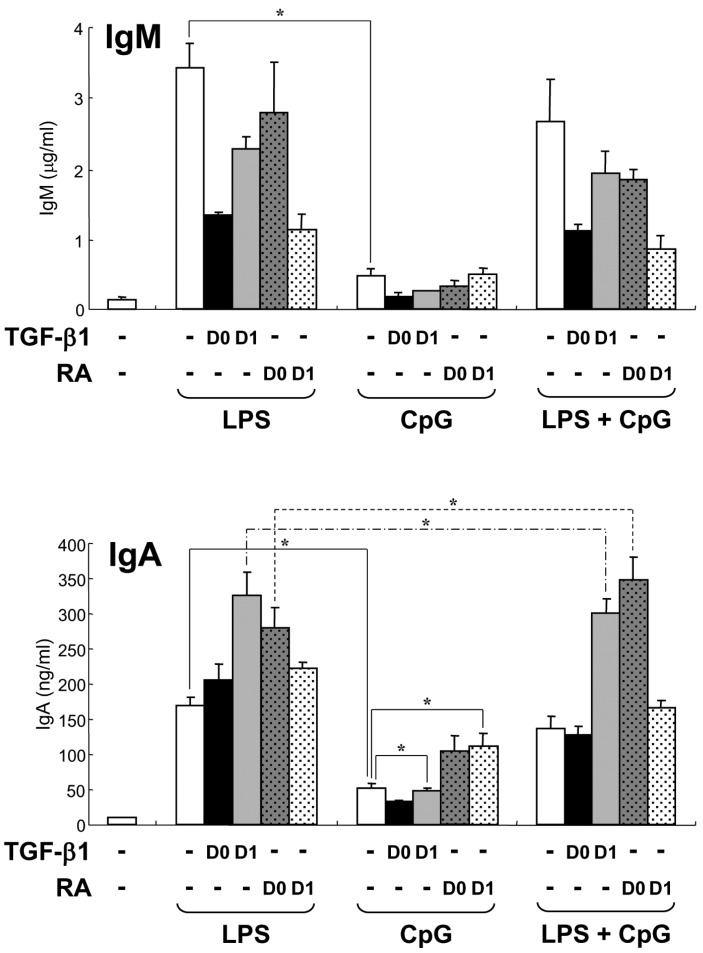 | Figure 4Effect of low dose CpG on TGF-β1- and RA-induced Igs production. Mouse spleen resting B cells were stimulated with CpG (10 nM) and LPS (12.5µg/ml). TGF-β1 (0.2 ng/ml) and retinoic acid (RA, 20 nM) were added on day 0 (D0) or day 1 (D1). After 7 days of culture, supernatants were harvested and the levels of IgM and IgA production were determined by isotype-specific ELISA. Data represent means±SEM of triplicate samples. *p<0.05.
|
Concluding remarks
In the present study, we found that CpG, a TLR9 stimulant, shows a powerful mitogenic potency for mouse spleen B cells, which was greater than LPS, a well-known mouse B cell polyclonal activator. Nevertheless, CpG was less stimulatory than LPS in all Ig isotypes production. Surprisingly, CpG down-regulated the LPS-stimulated Igs production. It is assumed that this function of CpG is attributed to the excessive mitogenic property. When low concentration of CpG was used, it supported RA-induced IgA production and did not down-regulate LPS/TGF-β1-induced IgA production. Moreover, CpG further augmented LPS/RA-induced IgA production. In conclusion, our results indicate that the optimal dose of TLR9 agonist CpG and TLR4 agonist LPS cooperate to direct stimulate B cells to proliferate and differentiate into cells producing Igs.
Go to :
 XML Download