

 PDF
PDF ePub
ePub Citation
 Print
Print


INTRODUCTION
Allograft rejection is the major barrier for the success of solid tissue and stem cell transplantation. Major risk factor for the rejection is mismatch at MHC locus between donor and recipient. Allograft rejection, however, still occurs even after MHC-matched transplantation for incompatibility of minor histocompatibility (H) antigens (1). Minor H antigens are peptide fragments derived from polymorphic proteins in association with MHC class I and II, able to induce CD4 and CD8 T cell responses (2). Considering the disparities at multiple minor H antigens upon the transplantation between MHC-matched but background-mismatched individuals, antigenic complexity could be enormous but, in reality, immune response focuses on a few dominant H antigens, exhibiting the phenomenon of immunodominance (3,4). In B6 anti-BALB.B system, a multiple minor H antigen-mismatched case, immune responses against a few dominant minor H antigens, H60, H28, H4, and H7, account for more than 85% of total CD8 T cells response and, among those dominant minor H antigens, H60 is dominant over all other minor H antigens, with high frequency of reactive CD8 T cells detected in blood during the B6 anti-BALB.B response (4).
Not only for the dominancy of specific CD8 T cell response, also for its hematopoietic cell-restricted expression, H60 has been paid attention to and considered as an ideal model antigen for study on graft-versus-leukemia (GVL) effect (5). T cells originated from hematopoietic stem cell donor recognize and react against allo-minor H antigens expressed in leukemic tumor cells residing in the recipient of the stem cells, exerting GVL effect, in addition to their capability to induce graft-versus-host disease (GVHD) through the allo-reaction against minor H antigens expressed on tissues (6-9). In this respect, CD8 T cells reactive to dominant and hematopoietic cell-restricted H60 would be exploited for tumor therapy and, for this, H60-specific CD8 T cell clones would be useful tool for modeling GVL effect in mouse.
The H60-specific response is initiated by the recognition of 8-a.a. peptide (LTFNYRNL) in the context of H-2Kb by TCR expressed on CD8 T cells (5). H60 peptide/MHC complexes induce specific CD8 T cell response in CD4 help dependent manner. The help is mediated via CD40-CD40L interaction and is required not only for the induction of primary response but also for the memory cell expansion (10). The dominance of H60-specific response has been ascribed to high precursor frequency of the reactive CD8 T cells and the frequency was estimated to be one out of 10,000~20,000 cells (11). Spectratyping and sequencing of the CD8 T cells participating in H60-specific responses revealed the involvement of T cells with wide variety of TCRs (12). Based upon these results, we decided to establish CD8 T cell clones reactive to H60 and identify the TCR sequences of the clones, which would be basis for modeling of GVL and generating TCR transgenic mouse, a useful tool for detailed analysis on the mechanism of the GVL effects. In order to do this, we established and characterized H60-specific CTL clones. And the TCR usages of those were identified.
MATERIALS AND METHODS
Mice and immunization
C57BL/6 (B6) mouse was purchased from The Jackson laboratory (Bar Harbor, ME, USA). H60 congenic mouse (B6.C-H60c/DCR) was a kind gift from Dr. Roopenian (The Jackson Laboratory). The mice were bred and kept under specific pathogen free (SPF) condition at the center for animal resource development of Seoul National University College of Medicine. To induce H60-specific CD8 T cell response in the B6 mice, splenocytes from male H60 congenic mice were injected into female B6 mice via intraperitoneal route (2×10⁷ cells/mouse).
Antibodies and flow cytometry
Peripheral blood lymphocytes and splenocytes from immunized mice, MLC cells, CTL lines, or CTL clones were incubated at 4℃ for 30 min in staining buffer (1×PBS containing 0.1% bovine serum albumin and 0.1% sodium azide) containing PE-labeled H60-tetramer and FITC-labeled CD11a (M17/4; eBioscience, San Diego, CA) and APC-labeled CD8 (53-6.7; eBioscience) antibodies. The stained cells were analyzed using a FACSCalibur equipped with CellQuest software (BD Pharmingen, San Diego, CA).
Generation of CTL clones
H60-specific CTL lines were established through mixed lymphocyte culture (MLC) of splenocytes obtained from the immunized B6 mice with those from H60 congenic mouse after irradiation (2,000 cGy) and regular re-stimulation with irradiated H60 congenic splenocytes afterward in DMEM media supplemented with 5% FBS and IL-2 (50 U/ml). Limiting dilution was performed with the H60-specific CTL lines at the 5th passage to obtain the H60-specific CTL clones. Then the established clones were maintained through regular re-stimulation with irradiated H60 congenic cells.
Proliferation assay of H60-specific CTL clones
CTL clones (5×10⁴ cells) were cultured with irradiated H60 congenic splencoytes (5×10⁵ cells) in the presence of 5 U/ml and 20 U/ml of IL-2. After 48 hr, the co-culture was added with 3H and further incubated for 18 hr. Then, the cells were harvested and the incorporation of 3H was measured.
Cell-mediated lysis assay
The standard 51Cr release assay was performed as described previously (4). In brief, 51Cr-labeled T2-Kb cells were incubated with 1µM concentration of synthetic peptides (LTFNYRNL for H60 and RGYVYQGL for VSV) for 30 min at 37℃ for peptide loading onto the target cells and then co-incubated at 37℃ with CTL clones (effectors) at E:T cell ratios of 2:1 and 10:1. Lysis of target cells was measured as specific lysis based on the levels of 51Cr released by H60-loaded target cells relative to those by VSV-loaded target cells.
Inverse RT-PCR and identification of TCR usage of H60-specific clones
Total RNA was isolated from H60-speicific CTL clones and 2 µg were used for 1st strand synthesis of cDNAs corresponding to TCR alpha chain using a primer 5'-CTGGTTGCTCCAGGCAATGGCCCCATT-3' (TCRαR), and beta chains using a primer 5'-AGGATTGTGCCAGAAGGTAGCAGAGAC-3' (TCRβR). Second strand synthesis was done with E. coli DNA polymerase (Koschem, Daejon, Korea) and E. Coli RNAse H (Koschem). For circularization, the ds cDNAs were incubated with T4 DNA ligase at 16℃ for overnight. The ligation mixtures were used for PCR amplification using the Cα-specific primers, TCRAinvF (5'-TCTGGAACGTTCATCACTGACAAA ACT-3') and TCRAinvR (5'-GGTGCT GTCCTGAGACCGAGGATC-3'), and Cβ-specific primers TCRBinvF (5'-TACAAGGAGAGCAATTATAGCTACTGC-3') and TCRBinvR (5'-GCTTTTGATGGCTCAAACAAGGAGAC-3'). 35 cycles at an annealing temperature of 60℃ were performed. Products of the inverse PCR were then cloned to pGEM-T vector and subsequently subjected to sequence analysis. The TCR usages were identified according to the IMGT database.
Determination of relative avidity
CTL clones were labeled with 50µg/ml of PE-labeled H60-tetramer, incubated at 4℃ for 1 hr in FACs buffer and, then, washed extensively. Following this initial tetramer binding, an aliquot of 105 cells was chased in FACs buffer with incubation at 37℃ for indicated times. The clones were also stained with FITC-labeled anti-TCRβ antibody to monitor TCR levels. Cells were analyzed by flow cytometry. Mean fluorescence intensity (MFI) values of binding of tetramer and anti-TCRβ antibody were plotted. The t1/2 of TCR-peptide/MHC interaction was calculated from specific mean fluorescence intensity using nonlinear regression analysis fitted to classical Michaelis-Menten Kinetics (Prism version 5, GraphPad, San Diego, CA).
RESULTS AND DISCUSSION
Generation of H60 specific CTL clones
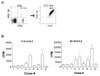
Female B6 mice were immunized with male H60 congenic splenocytes and, on day 14 post-immunization, mixed leukocyte culture (MLC) was set up with irradiated H60 congenic splenocytes. Through five rounds of re-stimulation of the MLC cells with irradiated H60 congenic splenocytes, H60-specific CTL line was established (Fig. 1A). While the frequency of H60-specific CD8 T cells was in ranges of 5~10% of CD8 T cells in blood of the immunized B6 mice at the peak of response, 99% of the established CTL line was positive for H60-tetramer as shown by flow cytometry analysis (Fig. 1A). With this CTL line at the 5th passage, limiting dilution was performed to obtain H60-specific CTL clones. Then, CTL clones, each of which was originated from a single cell via the limiting dilution, were maintained through re-stimulation with irradiated H60 congenic cells on weekly basis and 24 CTL clones reactive to H60 were established.
CTL clones have different capacity of proliferation
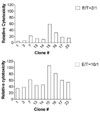
Among the initial 24 CTL clones obtained, finally, nine CTL clones (#1, 3, 7, 13, 14, 15, 16, 17, and 23) were able to be maintained beyond the passage seven and subjected to clonal characterization. First, each CTL clone was tested for proliferation capacity in response to stimulation with irradiated H60 congenic cells. When 3H-incorporation by the CTL clones during the stimulation was measured, clone #14 and #17 proliferated relatively highly (Fig. 2), even when the concentration of supplemented IL-2 was limiting (5 U/ml). The other cells, clone #1, #3, #7, #15, and #23, showed rather minimal, but enough to be maintained for next passage, proliferation by the stimulation. These data demonstrated that even though they were all H60-specific, each clone showed a different level of proliferation capacity in reaction to the H60-stimulation.
Different capacity of CTL activity of the H60-specific CTL clones
Next, we examined whether cytotoxic activity of the H60-specific CTL clones would be different. In order to do this, the nine CTL clones were subjected to cell mediated lysis (CML) assay by incubating with 51Cr-labeled and H60-peptide loaded T-2Kb target cells at two different effector/target ratios of 2:1 and 10:1. In overall, cytotoxicity of the nine CTL clones was higher at the E:T ratio of 10:1 than 2:1 and, among the clones, clone #15 was distinguished for its high CTL activity against H60-loaded T-2Kb cells. The clone #14, which showed the second highest proliferation activity in reaction to stimulation with H60 congenic cells (Fig. 1B), belonged to the group with low CTL activity. This result combined with that from proliferation assay demonstrated that even though all the CTL clones were specific for H60, they possessed different levels of proliferation capacity and cytotoxicity.
Different binding affinity of H60-specific CTL clones for peptide/MHC complexes
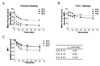
Then, we wondered whether CTL clones would show different levels of TCR affinity to cognate ligand, H60-peptide/H-2Kb complexes. To examine this, the affinity was empirically measured via determining t1/2 of H60-peptide/H-2Kb-TCR interactions. We selected CTL clone #14, #15, and #23 based upon the clonal characteristics, for high proliferation capacity (#14), high cytotoxicity activity (#15), and low activities in both aspects (#23), respectively. The CTL clones were stained with saturating amount (50µg/ml) of H60-teramer for 1 hr and, after washing, the cells were incubated at 37℃ for indicated time period and examined for falling-off the tetramers from their TCR by flow cytometry analysis, measuring the mean fluorescence intensity. To see whether TCR expression itself was influenced, the cells were also stained with anti-TCRβ antibody before flow cytometry analysis. When the mean fluorescence intensity (MFI) values of H60-tetramer and anti-TCRβ antibody staining were plotted, we found that initial MFI values of tetramer staining were different among the three CTL clones (Fig. 3A). The initial MFI value was highest with clone #15 (82) and lowest with clone #23 (30) with #14 in the intermediate (58), even though the TCR level on the cell surfaces were not significantly different in a range of 28~33 MFI values (Fig. 3B). This demonstrated that the three CTL clones, #14, #15, and #23, bound to H60-tetramer with different avidities. When the t1/2 of H60-peptide/H-2Kb-TCR interactions was calculated (Fig. 3C), the duration of the interaction was shortest in clone #14 (4.87 minutes) and longest in clone #23 (13.93 minutes), demonstrating that even though the TCR of clone #23 has very low initial avidity to the H60-peptide/H-2Kb, the interaction is stable. Moreover, the results demonstrate that TCR of clone #14, which has high proliferation capacity, has modest initial binding avidity to H60-peptide/H-2Kb but the duration of the binding is short. In the case of clone #15, the TCR interaction with H60 peptide/H-2Kb initiated with high avidity and the interaction was rather stable with about 7 minutes of t1/2. All these results showed that each clone has its own TCR binding avidity to the specific ligand as well as proliferation and cytotoxic capacities.
Identification of TCR sequences of the H60-specific CTL clones
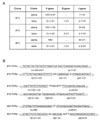
Then we thought that such clonal differences in proliferation activity, cytotoxicity, and TCR binding avidity to H60 peptide/H-2Kb would reflect different TCR usages of the clones. To identify the sequences encoding the TCRs expressed by clone #14, #15, and #23, inverse PCR was performed with the RNAs extracted from each clone and the PCR products were cloned to pGEM-T vector and analyzed for sequence (Fig. 4). The sequence analysis revealed that the three CTL clones had different usages of TCRα and TCRβ. TCR complex of CTL clone #14 consists of Vα12D-3-01 and Jα11-01 for TCRα chain and Vβ12-1-01, Dβ1-01, and Jβ2-7-01 for TCRβ chain. CTL clone #15 consists of Vα13D-1-02 and Jα 34-02, and Vβ13-1-02, Dβ2-01, and Jβ2-7-01 for TCRα and β chains, respectively. TCR α and β chains of Clone #23 consists of Vα16D and Jα45-01, and Vβ12-1-01, Dβ 1-01, and Jβ2-5-01, respectively. Based upon the sequence analysis data, we could suggest that the different TCR usages by each clone would have been reflected to differences in the clonal characteristics.
From an antigenic standpoint, H60 has been found to recruit CD8 T cells with diverse TCRs into the specific response, after primary challenge as well as after memory expansion stimulation (12). The results from this study through a series of clonal characterization showed that the CD8 T cells recruited to H60-specific CD8 T cells responses would have each different capacity, in terms of proliferation, cycotoxicity, and TCR avidity to the cognate ligand H60 peptide/H-2Kb. And the H60-specific CTL clones and TCR information obtained in this study would be useful for understanding the cellular mechanism of graft rejections and GVHD, and also for modeling the GVL effect under MHC-matched transplantation condition.
 XML Download