Abstract
Purpose
Methods
Results
References
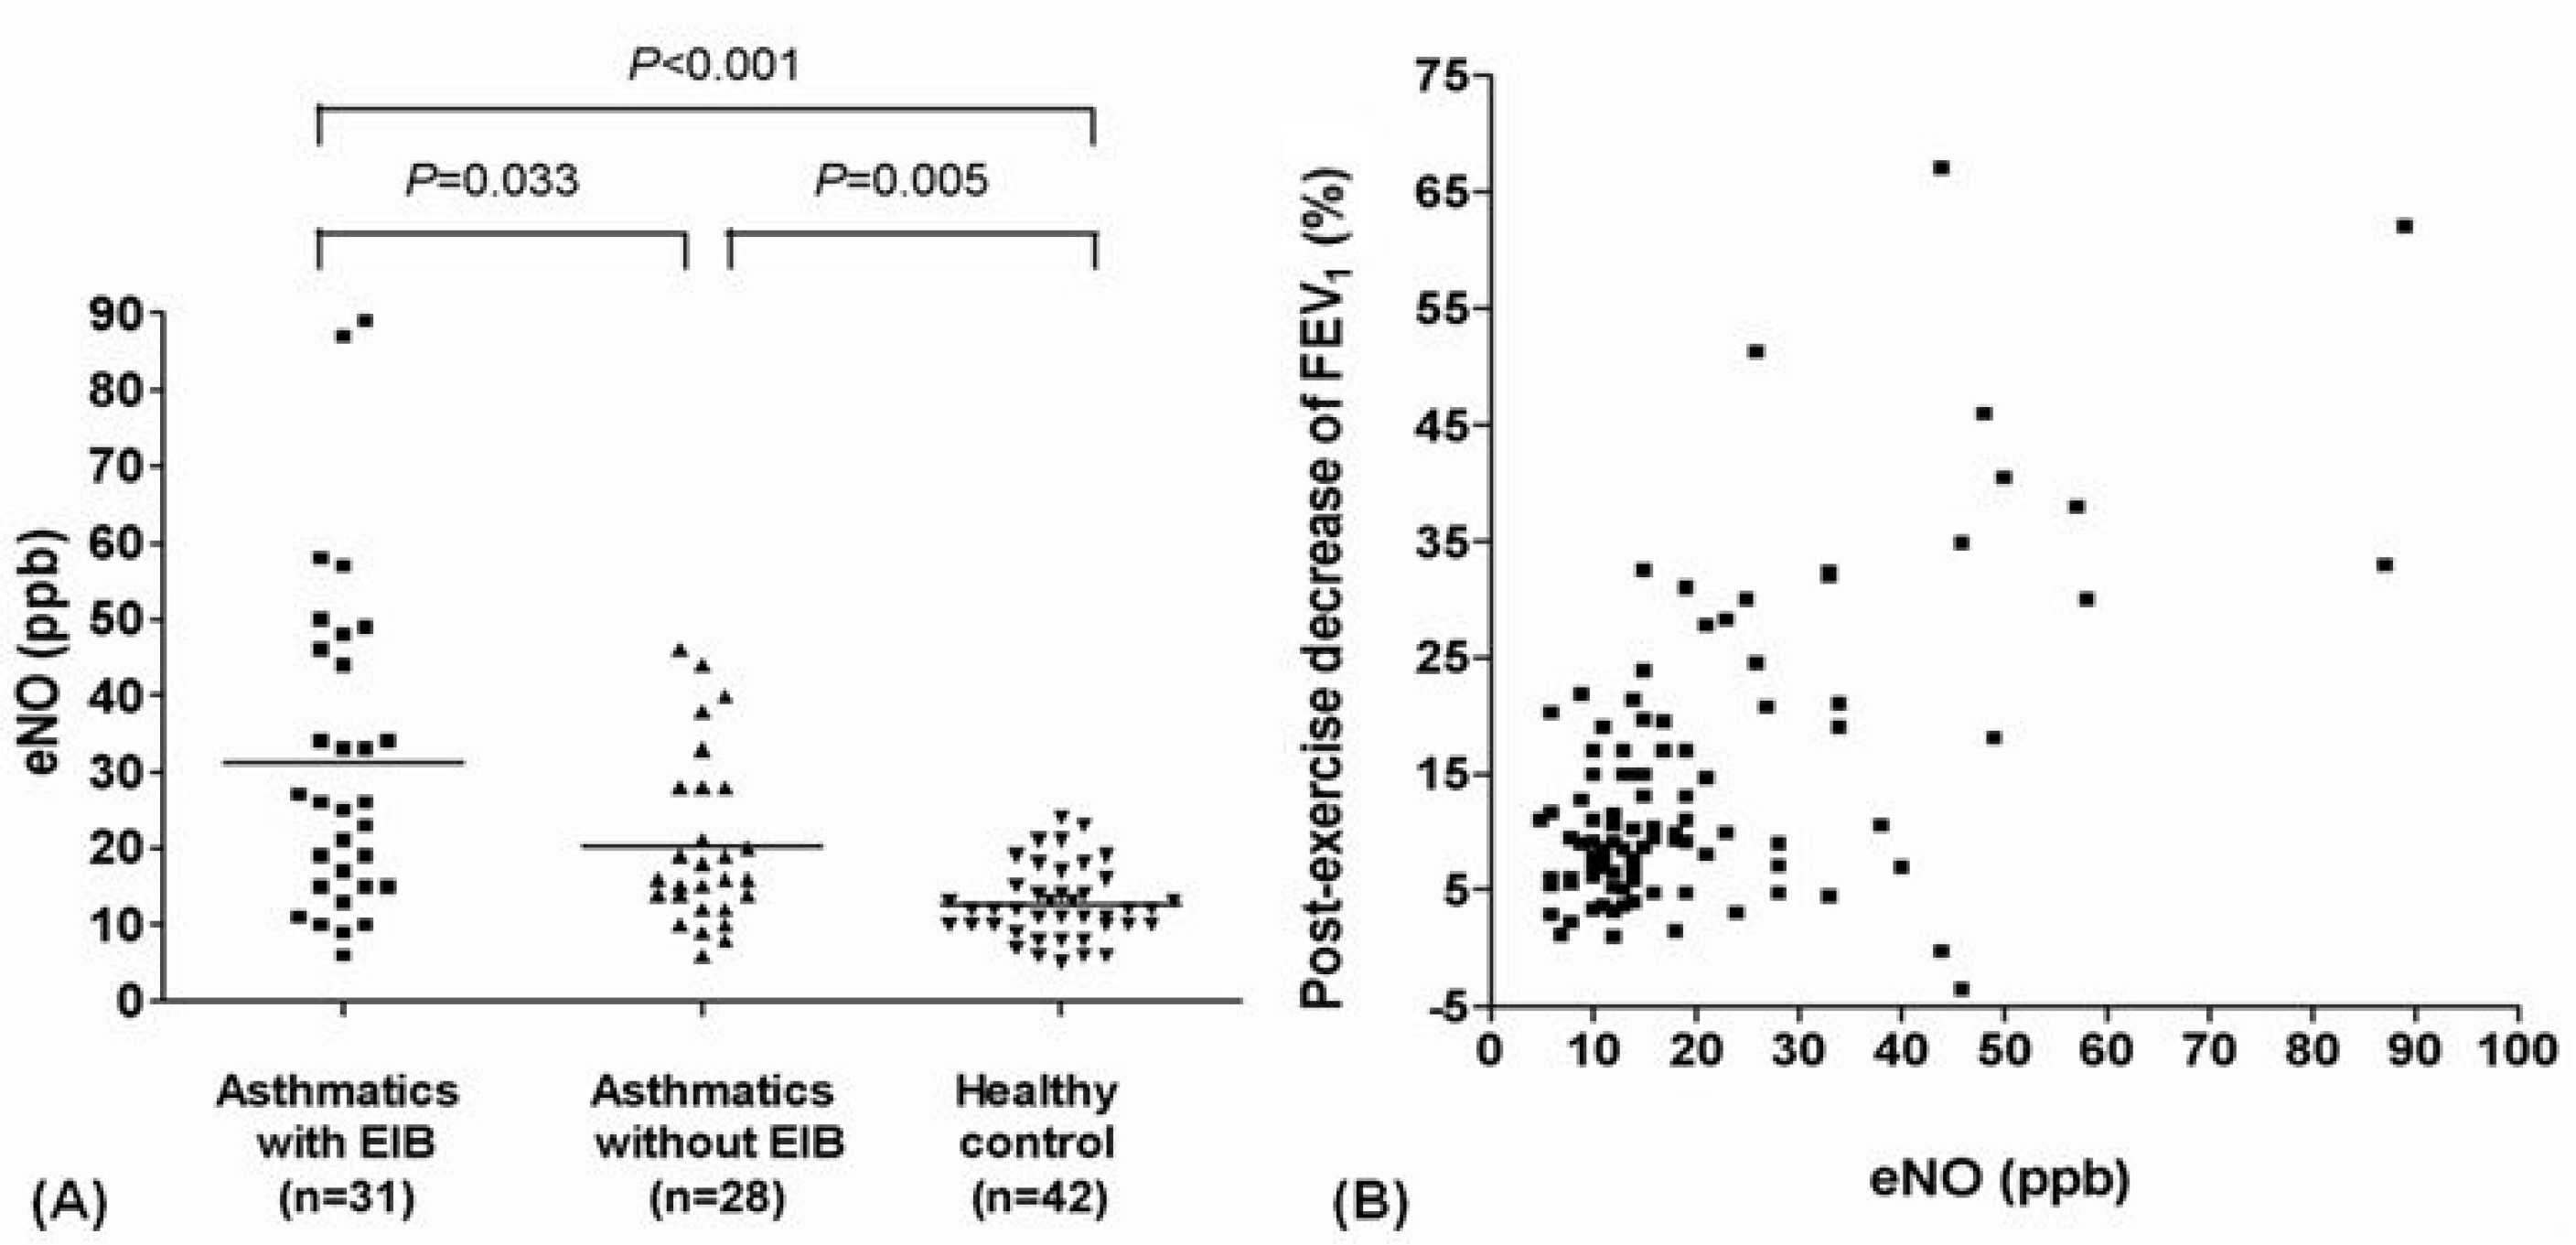
 | Fig. 1.(A) Exhaled nitric oxide (eNO) levels of study subjects. (B) Association between post-exercise decrease of forced expiratory volume in 1 second (FEV1) and eNO levels (r=0.637, r=partial correlation coefficient adjusted for age and height, P <0.001). ppb, parts per billion; EIB, exercise-induced bronchoconstriction. |
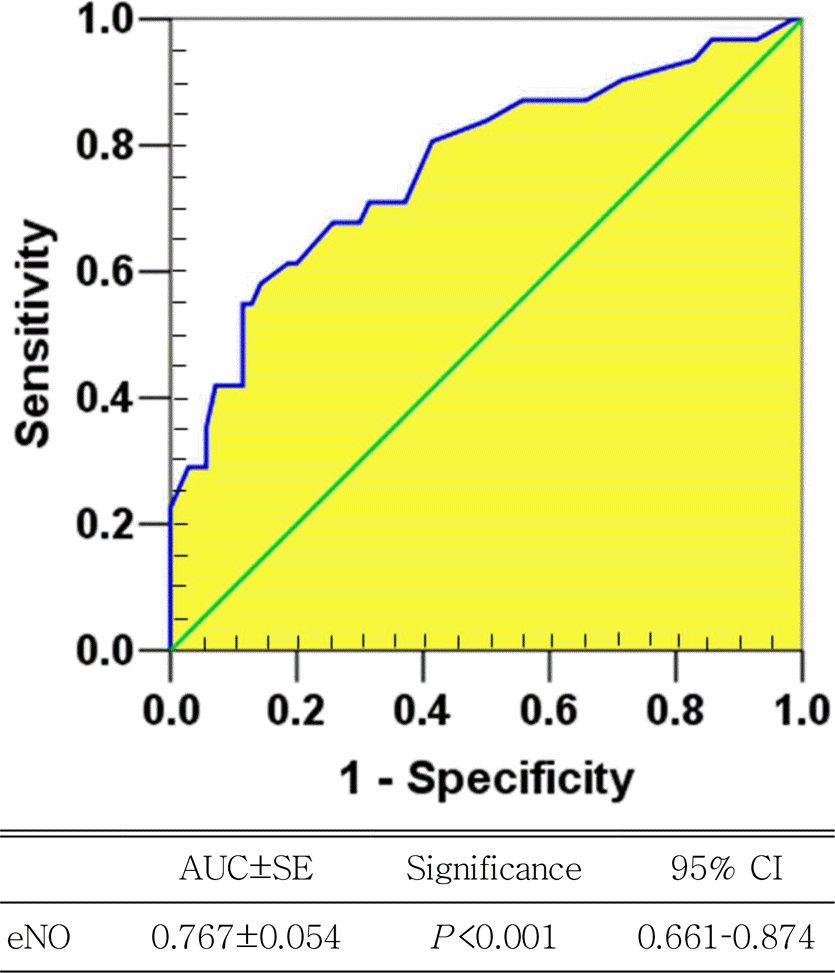
 | Fig. 2.Receiver operating characteristic curve for exhaled nitric oxide (eNO) predicting exercise-induced bronchoconstriction with representative values. AUC, area under curve; SE, standard error; CI, confidence interval. |
Table 1.
| Asthmatics | Healthy controls (n=42) | P -value∗ | ||
|---|---|---|---|---|
| With EIB (n=31) | Without EIB (n=28) | |||
| Age (yr) | 10.3 2.0 ± | 9.6 2.6 ± | 9.9 2.2 ± | 0.970 |
| Sex, male (%) | 68.4 | 69.6 | 56.4 | 0.312† |
| Parental smoking (%) | 19.3 | 16.7 | 14.3 | 0.124‡ |
| Clinical features (%) | ||||
| Prior ICS use | 54.8 | 46.4 | NA | 0.078‡ |
| Allergic rhinitis | 61.3 | 50.0 | NA | 0.097‡ |
| Atopy | 84.2 | 82.6 | NA | 0.707‡ |
| Baseline | ||||
| FEV1, pred % | 86.2 14.9 ± | 84.3 21.1 ± | 99.3 11.8 ± | 0.548 |
| FVC, pred % | 98.7 9.5 ± | 95.5 11.3 ± | 97.5 12.4 ± | 0.029 |
| FEV1/FVC ratio | 80.0 9.2 ± | 83.8 16.5 ± | 92.0 5.3 ± | 0.019 |
| FEF25-75, pred % | 68.3 23.2 ± | 72.0 27.2 ± | 92.5 15.0 ± | <0.001 |
| Postbronchodilator FEV ∆ 1, pred % | 11.2 5.3 ± | 11.7 5.9 ± | NA | 0.964§ |
| PC20, mg/mL | 4.8 4.9 ± | 11.7 5.9 ∫ | NA | <0.001§ |
| Post-exercise decrease in FEV1 | 27.7 (19.6–32.9)∫ | 9.0 (4.7–10.6) | 7.7 (5.1–10.0) | <0.001 |
| PB eosinophil, /mL | 480 (245–780) | 300 (140–467) | 125 (95–175) | 0.002 |
| ECP, ng/mL | 33.2 (23.5–63.4) | 23.7 (14.1–51.2) | 11.1 (5.6–23.1) | <0.001 |
| Total IgE, IU/mL | 446.9 (205.3–995.0) | 225.0 (80.0–394.3) | 55.9 (28.2–141.5) | 0.002 |
EIB, exercise-induced bronchoconstriction; ICS, inhaled corticosteroid; FEV1, forced expiratory volume in 1 second; pred %, predicted %; FVC, forced vital capacity; FEF, forced expiratory flow, midexpiratory phase; PC20, provocative concentration of methacholine inducing a 20% fall in FEV1; PB, peripheral blood; ECP, eosinophil cationic protein; NA, not applicable.
Table 2.
| Exhaled nitric oxide (ppb) | ||
|---|---|---|
| r∗ | P -value | |
| FEV1, pred % | 0.160 | 0.227 |
| FVC, pred % | –0.111 | 0.537 |
| FEV1/FVC ratio | –0.307 | 0.018 |
| FEF25-75, pred % | –0.369 | 0.002 |
| Postbronchodilator FEV ∆ 1, pred % | 0.322 | 0.029 |
| Methacholine PC20, mg/mL | –0.223 | 0.132 |
| PB eosinophil, /mL | 0.508 | <0.001 |
| ECP, ng/mL | 0.202 | 0.138 |
| Total IgE, IU/mL | 0.475 | <0.001 |
ppb, parts per billion; FEV1, forced expiratory volume in 1 second; pred %, predicted %; FVC, forced vital capacity; FEF25–75, forced expiratory flow, midexpiratory phase; PC20, provocative concentration of methacholine inducing a 20% fall in FEV1; PB, Peripheral blood; ECP, eosinophil cationic protein.


 PDF
PDF ePub
ePub Citation
 Print
Print


 XML Download