

 PDF
PDF ePub
ePub Citation
 Print
Print


INTRODUCTION
Myelodysplastic syndrome (MDS) is a preleukemic condition that transforms into acute myeloid leukemia (AML) in approximately 30-40% of cases. MDS-associated leukemia is rarely cured by chemotherapy, and patient prognosis is typically poor [1]. MDS represents an excellent model of leukemic development with progressive increases in blastic bone marrow involvement; however, the genetic events underlying this evolution remain poorly understood.
MDS is separated into subtypes based on bone marrow blast and dysplasia. Among the MDS subtypes, refractory anemia with excess blast (RAEB) is the most common pre-leukemic type and is associated with poor prognosis. Thus, the focus of the present study is on the bone marrow blast subtype of MDS, specifically on different DNA methylation profiles between the subtypes morphologically affected.
A whole genome-wide DNA microarray technique was used in the present study to assess the DNA methylation profiles between RAEB and refractory cytopenia with multilineage dysplasia (RCMD). Genes displaying different DNA methylation patterns were identified using Ingenuity Pathway Analysis (IPA) tools. In this study, we aimed at identifying genes that were hypermethylated in RAEB but not in RCMD.
MATERIALS AND METHODS
1. Sample collection
This study included 20 patients with primary MDS. As per the WHO criteria, 11 patients had RCMD and 9 had RAEB. The study was approved by the ethics committee of Dong-A University Hospital, and informed consent was obtained from each participant. Following consent, a bone marrow aspirate was collected from each patient, and peripheral blood samples were harvested from 4 healthy volunteers. Density gradient centrifugation was used to separate mononuclear cells from bone marrow or peripheral blood specimens. Genomic DNA was extracted using the QIAmp DNA MiniKit (Qiagen, Valencia, CA, USA).
2. DNA methylation array
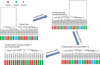
Methylation levels were detected using the Infinium Methylation Assay (Illumina, San Diego, CA, USA) according to the manufacturer's protocol. Briefly, DNA was treated with sodium bisulfate from an Illumina-specified kit (Zymo Research, Orange, CA, USA), which converted unmethylated cytosine to uracil and left methylated cytosine unchanged. For each CpG site, 2 pairs of probes were designed that corresponded to either the methylated or unmethylated state of the CpG site. Polymerase chain reaction (PCR) templates were generated via allele-specific extension and ligation. These templates were PCR amplified using fluorescent-labeled common primers. The resulting PCR products hybridized to a bead array at sites with complementary sequences, and the fluorescent label of the hybridized targets denoted a methylated or unmethylated state for a given locus. The methylation status of the interrogated CpG site-the β-value-was represented by the ratio of fluorescent signal from 1 allele relative to the sum of both methylated and unmethylated alleles. The β-value provided a continuous measure of DNA methylation at a CpG site and ranged from 0 (no methylation) to 1 (complete methylation). The overall average β-value was provided for all 27,578 CpG sites found in the 14,495 genes analyzed from a particular sample. In this study, the methylation status of CpG sites in both groups was assessed based on the median β-value (0.5). The β-value of hypermethylated genes was greater than 0.5 in the RAEB group samples and less than 0.5 in the RCMD group samples. The significance of the difference in methylation status between RAEB and RCMD was assessed by 4 different methods. The Mann-Whitney and Kruskal-Wallis tests were used for nonparametric analysis, and the t-test and ANOVA were used for parametric analysis.
3. IPA
IPA tools were used to conduct a bioinformatics evaluation of methylated candidates [2]. The core bioinformatics analyses were performed using the Pathway Studio V.5.0 (Ariadne Genomics, Rockville, MD, USA). IPA contains a knowledge repository of oncological networks and biological relationships that have been encoded systematically based on more than 200,000 original peer-reviewed articles. Details and technical requirements are available from either the IPA Website (www.ingenuity.com) or the supplemental methods in the online appendix. A graphical representation shows the IPA-generated hypothetical networks based on the molecular relationships, interactions, and pathway associations among methylated candidate genes. In this study, IPA tools were used to analyze significant differences in gene methylation and select genes with different methylation levels in RAEB and RCMD.
4. Methylation-specific PCR (MSP) analysis
MSP was used to validate candidate methylated genes in samples obtained from the same set of 20 MDS patients [3]. Genomic DNA (200 ng) was modified by using the Sigma Imprint™ DNA modification kit (Sigma-Aldrich, St. Louis, MO, USA) according to the manufacturer's instructions. For the 5 genes found identified in the IPA analysis, the DNA sequences flanking the transcription start sites (-1000 to +300 bp), which usually contain a promoter region, were obtained from the Illumina Infinium database. Methylation-specific PCR primers were designed using the Methyl Primer Express Software V.1.0 (Applied Biosystems, Foster City, CA, USA). The modified DNA from each gene was amplified by 2 different primer pairs specific to unmethylated or methylated sequences. The primer sequences used to amplify the CpG regions of each gene are listed in Table 1. PCR conditions were optimized for accurate and efficient amplification. Generally, amplification was carried out in a 25-µL reaction mixture that contained 2 µL bisulfite-modified DNA, 0.4 µM of each forward and reverse primer, 10 mM Tris-HCl (pH 8.3), 50 mM KCl, 1.5 mM MgCl2, 200 µM dNTPs, and 2.5 units of Taq DNA polymerase (Qiagen). PCR conditions included initial activation and denaturation at 95℃ for 15 min, 35 cycles of amplification (95℃ for 45 sec, annealing temperature for 45 sec, and 72℃ for 1 min), and a final extension at 72℃ for 10 min. The amplified products were resolved on a 2% agarose gel and stained with ethidium bromide to enable visualization by ultraviolet light.
RESULTS
1. Patient characteristics
Genomic DNA was extracted from the bone marrow aspirate samples for initial diagnosis. Table 2 lists patient characteristics (N=20) in this study. The median age was 58.5 years (range, 16-75), and 13 patients (54.2%) were men. Characteristics like sex and age did not differ between the RAEB and RCMD groups.
2. Different methylation profiles between RAEB and RCMD
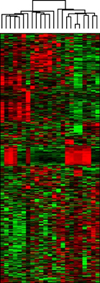
According to hierarchical clustering, RCMD patient MDS 13 had to be excluded from statistical analysis because of the extreme value (Fig. 1). In addition, hierarchical analysis revealed no meaningful hypermethylated gene cluster patterns (Fig. 2). The Mann-Whitney and Kruskal-Wallis tests were used to identify 1,311 and 1,381 statistically significant genes (P<0.05), respectively. A bootstrap t-test and ANOVA analysis revealed 1,527 and 821 statistically significant genes (P<0.05), respectively. The investigators identified 320 overlapping genes that displayed significantly different DNA methylation patterns between RAEB and RCMD samples. Among the 320 genes, RAEB genes exhibited a β-value greater than 0.5, whereas RCMD genes exhibited a β-value less than 0.5. Based on any of the 4 statistical models, 69 genes exhibited significant differences in the methylation status.
3. IPA-based selection of candidate genes
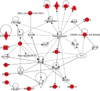
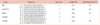
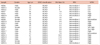
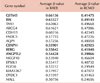
The 69 significant genes were mapped to 5 different networks according to IPA scores (Table 3) as follows: network 1: gene expression, cancer, and cell cycle; network 2: organismal injury and abnormalities, cellular function and maintenance, and cell death; network 3: cardiovascular disease, cancer, and cellular movement; network 4: amino acid metabolism, post-translational modification, and small molecule biochemistry; and network 5: cancer, genetic disorder, and hematological disease. Network 1 had a top score of 34 and is presented in Fig. 3; it includes the associated genes, which are denoted in red and white and burrowed to form the disease network construct. In total, 16 network 1 genes were analyzed (Table 4). These genes included several potential links to disease progression in malignancy, and of these, 5 candidate genes were selected for further evaluation: glutathione S-transferase mu 5 (GSTM5); BCL2-interacting killer (BIK); centromere protein H (CENPH); ras-related, estrogen-regulated growth inhibitor (RERG); and angiopoietin-like protein 2 (ANGPTL2).
4. Validation of candidate genes by MSP analysis
To validate the results obtained through methylation microarray, we used methylation-enriched PCR to detect methylation levels of candidate genes in RCMD and RAEB. The 5 aforementioned genes were evaluated by MSP analysis. Table 1 lists the primer sequences, the optimized annealing temperature for each primer pair, and the PCR product lengths. The primers were designed to detect the methylated and unmethylated DNA sequences of each gene. To ensure accurate and efficient amplification of methylated DNA by the methylation-specific primers, we optimized the annealing temperatures for these primer pairs by using the human leukemic-60 cell line as a positive control and peripheral blood from healthy volunteers as a negative control. CpG lesions of the CENPH gene did not result in methylated PCR products following reactions with the specific primer pair, as compared to the other 4 genes.
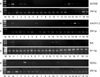
The MSP methylation results of each gene are shown in Fig. 4. RCMD patients were designated numbers 1-10 and RAEB patients, 11-19. In the GSTM5 promoter, 2 of the 10 RCMD samples (20%) and 5 of the 9 RAEB samples (55.5%) were shown to harbor different levels of methylation sites. In the ANGPTL2 promoter, 1 of the 10 RCMD samples (10%) and 4 of the 9 RAEB samples (44.4%) were shown to harbor methylation sites. The BIK promoter exhibited methylation in 2 of the 9 RAEB samples (22%). The RERG promoter exhibited methylation in 3 of the 10 RCMD samples (30%) and 2 of the 9 RAEB samples (22%).
DISCUSSION
DNA methylation is associated with the transcriptional silencing of genes in cell differentiation, apoptosis, growth regulation, cell signaling, detoxification, and tumor invasiveness and thus confers a selective growth advantage to malignant cells [4]. AML and MDS are diseases associated with aberrant methylation in a number of genes [5, 6]. Hypermethylation of genes involved in cell-cycle control and apoptosis is observed commonly in these diseases, particularly high-risk MDS. Transcription of the p15 gene often is silenced due to abnormal methylation of its promoter region, and several studies have indicated that approximately 50% of MDS patients exhibit this alteration [7, 8]. Other genes frequently affected by hypermethylation in MDS are cancer 1 (HIC1), E-cadherin (CDH1), and estrogen receptor (ER) [9].
The hypermethylation of promoters from a set of cancer-related genes has been linked to the progression of MDS [10]. By examining 1,505 CpG sites in 807 genes using microarray technique and a high-density single nucleotide polymorphism array, Jiang et al. reported that aberrant hypermethylation is associated with disease stage in MDS. The ubiquity, extent, and progression of aberrant hypermethylation in the disease stage suggests that hypermethylation is the primary source of tumor suppressor gene silencing and clonal variation in the neoplastic evolution of myeloid disease.
The present study focuses on bone marrow blast in primary MDS because increased numbers of bone marrow blasts occur during disease progression and are linked to an increased risk for transformation to AML. The hypothesis that drove the present study was that the mechanism of increased bone marrow blast will provide clues to the neoplastic evolution of MDS and may be associated with aberrant DNA methylation. Based on the WHO classification, 9 patients of the RAEB subtype and 11 patients of the RCMD subtype were selected and used to determine the different patterns of gene methylation status between the 2 subtypes.
The use of complimentary DNA microarray technology in MDS has demonstrated a high level of gene expression heterogeneity among MDS patients [11]. However, the profiling of DNA methylation in MDS by the microarray technique has not been studied yet. The advent of microarray technology has provided new opportunities for high-throughput study on DNA methylation [12]. The whole genome-wide microarray approach has been used to study the mechanisms of cancer disease progression and prognosis. Thus, the present study investigated DNA methylation in MDS by using a commercial whole-genome-wide DNA microarray technique. The Infinium Methylation Assay is a new technology that differs from the Goldengate Methylation Assay in terms of whole-genome-wide content, but not cancer/custom content. It still is not practical to use genome-wide sequencing of individual tumors to assess the entire mutation spectrum. Similarly, research that uses the genome-wide DNA methylation assay is in its early stages and expensive for use. These considerations underlie the decision to limit the assay to 20 MDS patients in this initial study.
Among the 14,495 genes, 69 were hypermethylated in RAEB and hypomethylated in RCMD. The DNA methylation profile of the 20 samples exhibited a high level of heterogeneity. The small sample size limited identification of different patterns between subtypes based on hierarchical clustering. Furthermore, this study was conducted on mononuclear nonadherent bone marrow cells from routine aspirates. These samples represented a non-homogeneous pool of different maturation stages, which resulted in heterogeneity.
It is a daunting task to use microarray studies to discover biological links between these genes and disease progression and to integrate them within a connected network. The present study utilized IPA software to analyze the candidate genes further. The IPA-computed score of each network indicates the likelihood that input genes in the network will be found together due to random chance. The 69 candidate genes analyzed using IPA mapped in 5 networks (see Table 3). The top scoring network (network 1) was selected for further study.
Although the functions of the 5 candidate network genes (GSTM5, BIK, CENPH, RERG, and ANGPTL2) were not determined, previous studies have provided sufficient evidence that links these genes with malignancy. The methylation status of each gene was validated by MPS analysis on both subtypes.
The GSTM5 gene encodes a GST that belongs to the mu class of enzymes, which conjugates with glutathione to detoxify electrophilic compounds, including carcinogens, therapeutic drugs, environmental toxins, and products of oxidative stress. Genetic variation in mu genes can change an individual's susceptibility to carcinogens and toxins and also affect the toxicity and efficacy of certain drugs [13]. Expression of mu class GST has been associated with a poor prognosis in acute lymphoblastic leukemia that results from cytotoxic drug resistance [14, 15]. Recently, Peng et al. [16] reported that DNA hypermethylation regulates the expression of mu-class GST in Barrett's adenocarcinoma. In the present study, MSP analysis results indicated that the GSTM5 gene was methylated more frequently in RAEB patients than in RCMD patients (55.5% vs. 20%, respectively). However, in comparison with the normal control, slightly methylated products were also noted by MSP. Although the possible role for GSTM5 in the development of cancer remains uncertain, the hypermethylation of GSTM5 may be associated with the function of other members of the mu-class GSTM family and may change individual susceptibility to carcinogens and toxins, thereby resulting in secondary MDS mutations that underlie disease progression.
The ANGPTL2 gene encodes angiopoietin-like protein 2, a secreted protein belonging to the angiopoietin family. Kikuchi et al. [17] have reported that ANGPTL2 frequently is silenced in ovarian cancer cell lines via DNA methylation of sequences around the CpG-island that exhibit promoter activity. Zhang et al. [18] reported that ANGPTL2 and ANGPTL3 proteins stimulate ex vivo expansion of hematopoietic stem cells. Here, the ANGPTL2 gene displays a slightly higher methylation status in RAEB patients than in RCMD patients (44.4% versus 10%, respectively), but both subtypes exhibited less DNA methylation. Although the physiologic and pathologic functions of ANGPTL2 remain to be discovered, epigenetic silencing by hypermethylation of the ANGPTL2 promoter may lead to a loss of ANGPTL2 function and affect hematopoietic stem cells in the bone marrow. ANGPTL2 may function differently in leukemic and myelodysplastic cells.
Ectopic expression of BIK induces apoptosis in numerous tumor types, including colon, prostate, breast, melanoma, and glioma cells [19-21]. BIK interacts with Bcl-xL and Bcl-2 and triggers apoptosis in a Bak-dependent manner [20]. BIK may be a tumor suppressor gene that is downregulated by hypermethylation or histone deacetylation of the promoter [22, 23]. In this study, a methylated allele of BIK was observed in 2 samples of RAEB, but not in any RCMD samples. In other studies, increased apoptosis has been documented within CD34+ bone marrow cells in patients with MDS [24]. Increased apoptosis appears to be the highest in patients with refractory anemia and is associated with early stage MDS [25, 26]. Although methylation of the BIK gene was detected less frequently in RAEB patients, it is possible that BIK expression may be downregulated by promoter hypermethylation. Decreased levels of apoptosis in advanced MDS may be associated with BIK expression.
RERG is a novel gene that was first reported in breast cancer following microarray analysis [27]. Gender-dependent expression of RERG in hepatocellular carcinoma and its regulation by histone deacetyltransferases (HDACs) have been reported previously [28]. In this study, the RERG gene was selected as a different candidate gene between RCMD and RAEB samples, but no specific pattern was noted upon MSP analysis. The Ras family has been studied in MDS and leukemogenesis, and some of these mutations may influence the course of disease. Therefore, the RERG gene may be associated with myeloid disorder and regulated by multiple pathways, including the HDAC-related signaling pathway.
The methylated primers, which were biased to detect methylated alleles, detected alleles that were 100% hypermethylated. Because MSP analysis allows for only a small number of individual CpG dinucleotides to be sampled, a negative result does not exclude methylation elsewhere in the CpG island [29]. Thus, it was necessary to conduct bisulphate sequencing analysis of the CpG island to determine the methylation status of each gene.
In this study, the whole-genome-wide DNA microarray technique and IPA were used to determine the differing states of DNA methylation between RAEB and RCMD; 16 genes were shown to exhibit increased hypermethylation in RAEB samples compared to RCMD samples. Among the 16 genes, GSTM5, ANGPTL2, and BIK promoters exhibited methylation more frequently in RAEB than in RCMD samples. Although the functions of these genes remain unknown, their state of DNA methylation may induce epigenetic silencing and contribute to increasing blasts, which results in the disease progression of MDS. Additional studies focusing on epigenetic silencing by various detection modalities are required.

 XML Download