

 PDF
PDF ePub
ePub Citation
 Print
Print


INTRODUCTION
Malignant lymphomas are classified on the basis of morphology, immunohistochemistry, and genetic and molecular biological features. Morphology is considered as the most important and basic feature [1]. Morphologically, lymphoma cells can be classified by their size as small, medium, or large cells. The nuclear size of the endothelial cells of small vessels and benign histiocytes may be used as an internal control [2]. However, the criteria tend to be subjective and only a few objective quantitative studies using image analysis have been published [3]. Recently, an image and morphometric study of thyroid aspiration samples was reported [4]. In lymphomas, Kim et al. [5] previously performed an image study to measure the nuclear size in cytological smear preparations. However, no study has described the use of paraffin-embedded tissues yet.
Mantle cell lymphoma (MCL) is known to be a relatively monotonous tumor. We used a user-controlled image-analyzer to evaluate the reactive mantle cells and MCL cells. The aim of this study was to evaluate the usefulness of an objective approach based on quantitative measurements between reactive mantle cells and MCL cells and to obtain mathematical values of those cells.
MATERIALS AND METHODS
Twenty cases of MCL were collected from Eulji University Hospital, Daejeon, Korea and Asan Medical Center, Seoul, Korea from January 2005 to March 2009. As a control group, 2 cases of normal tonsils containing reactive lymphoid follicles were included. Hematoxylin-eosin-stained slides were reviewed and the diagnosis of MCL was confirmed by histopathologic findings of medium-sized monotonous tumor cells with irregular nuclear membrane and immunohistochemical reactivity of cyclin D1, CD5, and CD20. The reactive mantle cells were selected at the mantle cell layers of lymphoid follicles of the tonsils.
Slides were reviewed on an Olympus BX51 microscope (Olympus Corporation, Tokyo, Japan) with×40 magnification of the objective lens and a 0.85 numeric aperture. In each case, 2 representative areas were digitally captured with an image size of 1,360×1,024 pixels using an Olympus DP71 distal camera (Olympus Corporation) and saved in the JPEG format. The resulting images were magnified twice for detailed tracing. Monotonous cells comprised the majority of the tumor cells. We selected those with clear nuclear membrane and well preserved intranuclear chromatin for analysis. Cells were excluded, if they showed nuclear pyknosis, nuclear overlapping, or degeneration.
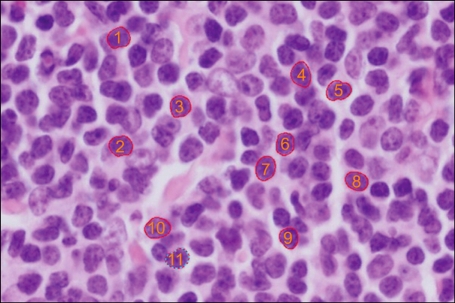
The outline of each nucleus was traced manually by 3 observers who used the spline method on an i-solution image analyzer (Daejeon, Korea) and a computer mouse with an average of 12 pauses (Fig. 1). In each case, approximately 100 to 160 nuclei were traced. The mean area of the nuclei was analyzed using the i-solution image analyzer. We discarded the data of the maximum and minimum 5% of each case to reduce the intra- and inter-observer variations. The resulting values were rounded off to the nearest numbers of hundredths. Comparison of the values was carried out with ANOVA and Student's t-test. The statistical analysis was performed using SPSS statistical software program (version 18.0, SPSS Inc, Chicago, IL). A P-value<0.05 was considered statistically significant.
RESULTS
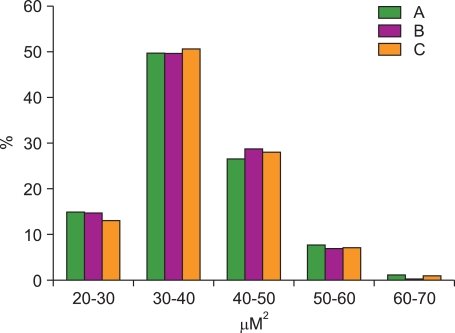
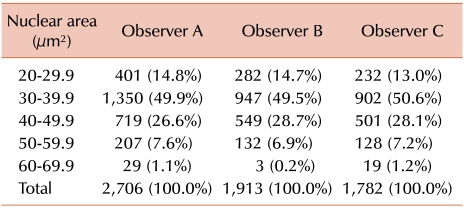
The nuclear area of 6401 MCL cells and 743 normal mantle cell of reactive tonsils were analyzed by 3 pathologists using a user-controlled image analyzer. The first, second, and third pathologist analyzed 2,706, 1,913, and 1,782 MCL cells and 309, 254, and 180 cells of the mantle zone of reactive tonsils, respectively. Thirty red blood cells were randomly selected and analyzed as control group. The mean diameter and mean area of the red blood cells was 6.2 [0.3] µm (average [standard deviation]) and 31.2 [2.0] µm2, respectively. The nuclear areas of MCL cells as measured by the first, second, and third pathologist were 37.9 [7.9] µm2, 37.9 [7.2] µm2, and 38.2 [7.7] µm2, respectively. The nuclear areas of normal mantle cells in reactive tonsils were 28.6 [2.3] µm2, 28.8 [2.0] µm2, and 27.0 [3.0] µm2 as measured by the first, second, and third pathologist, respectively. The distribution of the nuclear area of MCL cells as found by the 3 pathologists is summarized in Table 1 and compared in Fig. 2. Generally, about half of the MCL cells had a nuclear area of 30.0 - 39.9 µm2 and no significant difference was found when comparing the results of the 3 pathologists. The mean value of the inter-observer variation regarding nuclear size was 2.7 [1.7] µm2 (range: 0.04-5.4 µm2). The proportion of the difference of the mean value among the 3 pathologists was as follows. The proportion of cases with a difference in the mean value of less than 1.0 comprised 20%, between 1.0-3.0 comprised 40%, between 3.0-5.0 comprised 25%, and more than 5.0 comprised 15% (Fig. 3). The proportion of difference in the standard deviation of the nuclear size was as follows: less than 1.0 was 30%, 1.0-2.0 was 65%, and more than 2.0 was 15%. The nuclear area of MCL cells was considerably larger than that of mantle cells of reactive tonsils (P<0.001, Student's t-test). The inter-observer variation among the 3 observers showed no significant difference (P=0.580, ANOVA).
DISCUSSION
Lymphoma is a proliferative lesion originating from a neoplastic lymphocyte clone. It has been classified into small or large cell lymphoid lesions according to the nuclear size of normal macrophages, vascular endothelial cells, or surrounding mature lymphocytes. However, the usefulness or reproducibility of this traditional classification is not always guaranteed [1, 2]. We believe that with the increasing knowledge of information technology, many morphologic findings can be objectively interpreted and translated into numeric values.
To obtain more correct and reproducible data of nuclear size, we took pictures of the MCL cells and measured the nuclear area of these cells using an image-analyzer program. Although some morphometric studies had been performed using an automatic analyzer with the colors red, green, and black [6], a limitation was noted in the setting of the standard color for analysis due to inhomogeneous nuclear chromatin patterns. In our study, using the spline method, we outlined the nuclear membrane with an average of 12 pauses and measured the nuclear area. With this method, the problem with the standard color has been solved, but the nuclear irregularity and form factor could not be sufficiently evaluated. We observed a tendency to select round to ovoid cells rather than elongated cells. A few studies on the nuclear size of MCL cells have been reported so far, because around 1984, when image analysis studies have been intensively performed, the Revised European American Lymphoma (REAL) lymphoma classification was not popular and cyclin D1 studies providing the most pathognomonic findings had not been done routinely [7-12]. In our results, the nuclear area of MCL cells was 37.9 µm2, 37.9 µm2, and 38.2 µm2 as measured by 3 pathologists who outlined the nuclear membrane. These values were smaller than those reported by Kim et al. (46 µm2) [5] and larger than those reported by van der Valk et al. (20 µm2) [13] in centrocytic lymphoma and intermediate-sized lymphoma. Such discrepancy can be explained by the cytologic preparation used in Kim's study [5] and the methyl methacrylate (embedding material) and Giemsa staining used in van der Valk's study [13]. The results of cellular morphometric study can be affected by the fixation solution, fixation time, cutting thickness of the tissue, and staining solution [14]. In our study, the traditional routine tissue processing was performed, including 10% neutral formalin fixation, paraffin embedding, 4-µm tissue cutting thickness, and hematoxylin-eosin staining. Thus, our data are relatively representative for typical MCL. In this study, the most important factor for determining the nuclear size was the selection of the cells in the pictures of MCL. We have tried to select the majority of cells or the largest cells in order or 80 cells randomly. The difference between the 3 observers in random selection was very small but the difference between the tumor cells was large (data not shown). However, we decided to select cells that represent the majority because when we make a diagnosis, the major component is considered the most representative and the most important. To evaluate the relatively homogeneous cells, we discarded the values of the maximum 5% and minimum 5%. The discrimination of MCL cells from reactive lymphocytes is sometimes difficult because of the similar size of the cells (small to intermediate). Some morphometric studies were performed after immunostaining to confirm MCL cells [6]. When we tried to analyze the slides after immunostaining, the nuclear margins became fuzzy and blurred. Therefore, we performed routine hematoxylin-eosin staining.
When 3 persons measured the same images, we found an inter-observer difference of an average of 2.7 µm2. This difference was not statistically different. On the basis of our results, it is possible to obtain relatively constant and reproducible values in cases of monotonous lymphoid lesions such as MCL or chronic lymphocytic lymphoma/leukemia.
Comparison of the nuclear area of MCL cells with that of normal mantle zone lymphocytes revealed a larger value in MCL (by 9.6 µm2), but this difference was not significant enough to make a differential diagnosis among other lymphomas. We could easily detect lymphocytes in the range of 35-40 µm2 in a non-neoplastic reactive condition, which can be induced by differentiation after antigen exposure. However, we think it is important to measure the nuclear area of MCL cells, which is well-known monotonous lymphoma cells and to use reproducible numerical values instead of traditional ambiguous descriptions such as small or large cells.
 , author A;
  , author B;
  , author C. No significant difference was found by ANOVA (P=0.580). N1, normal mantle cells of tonsil 1; N2, normal mantle cell of tonsil.
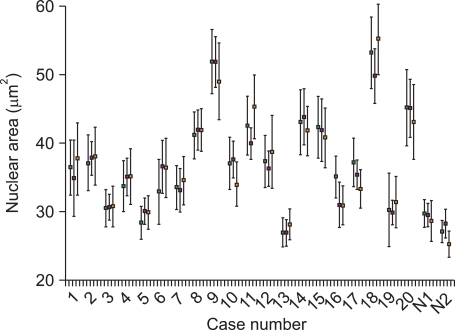
 XML Download