Abstract
Background:
Methods:
Results:
Conclusion:
REFERENCES
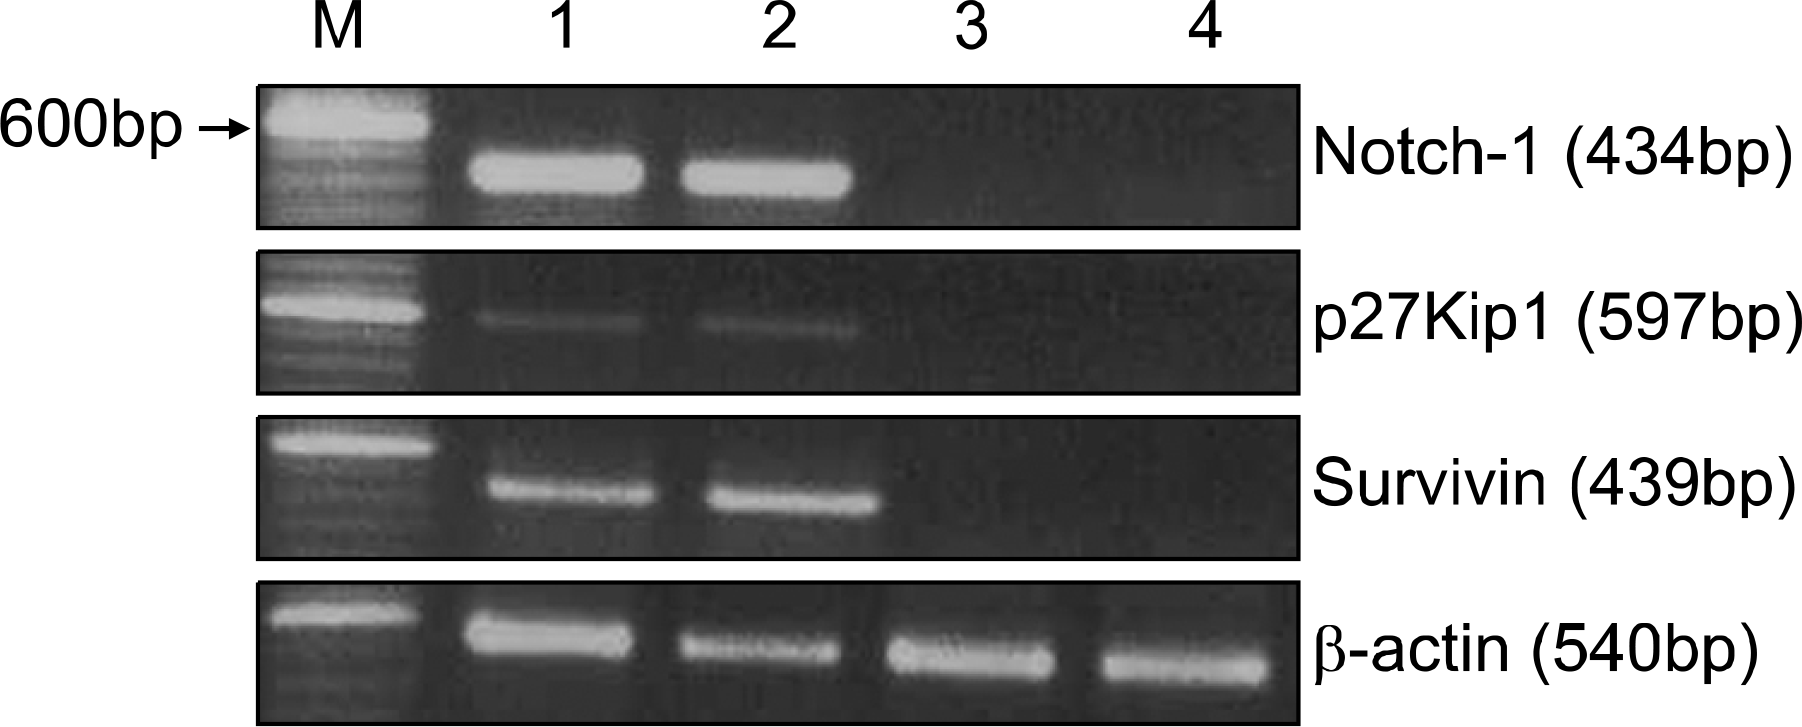
 | Fig. 1RT-PCR analysis of Notch1, survivin, and p27Kip1 expression in representative AML samples. RT-PCR was performed with specific primers described in Materials and Methods. PCR products derived from 1μg of total RNA were applied to each lane. Lane 1, 100-bp molecular weight marker. Cases expressing Notch1 transcript (lanes 2∼3) demonstrate both of survivin and p27Kip1 transcripts. Survivin and p27Kip1 transcripts are not expressed in two cases that do not express Notch1 transcript (lanes 4∼5). |
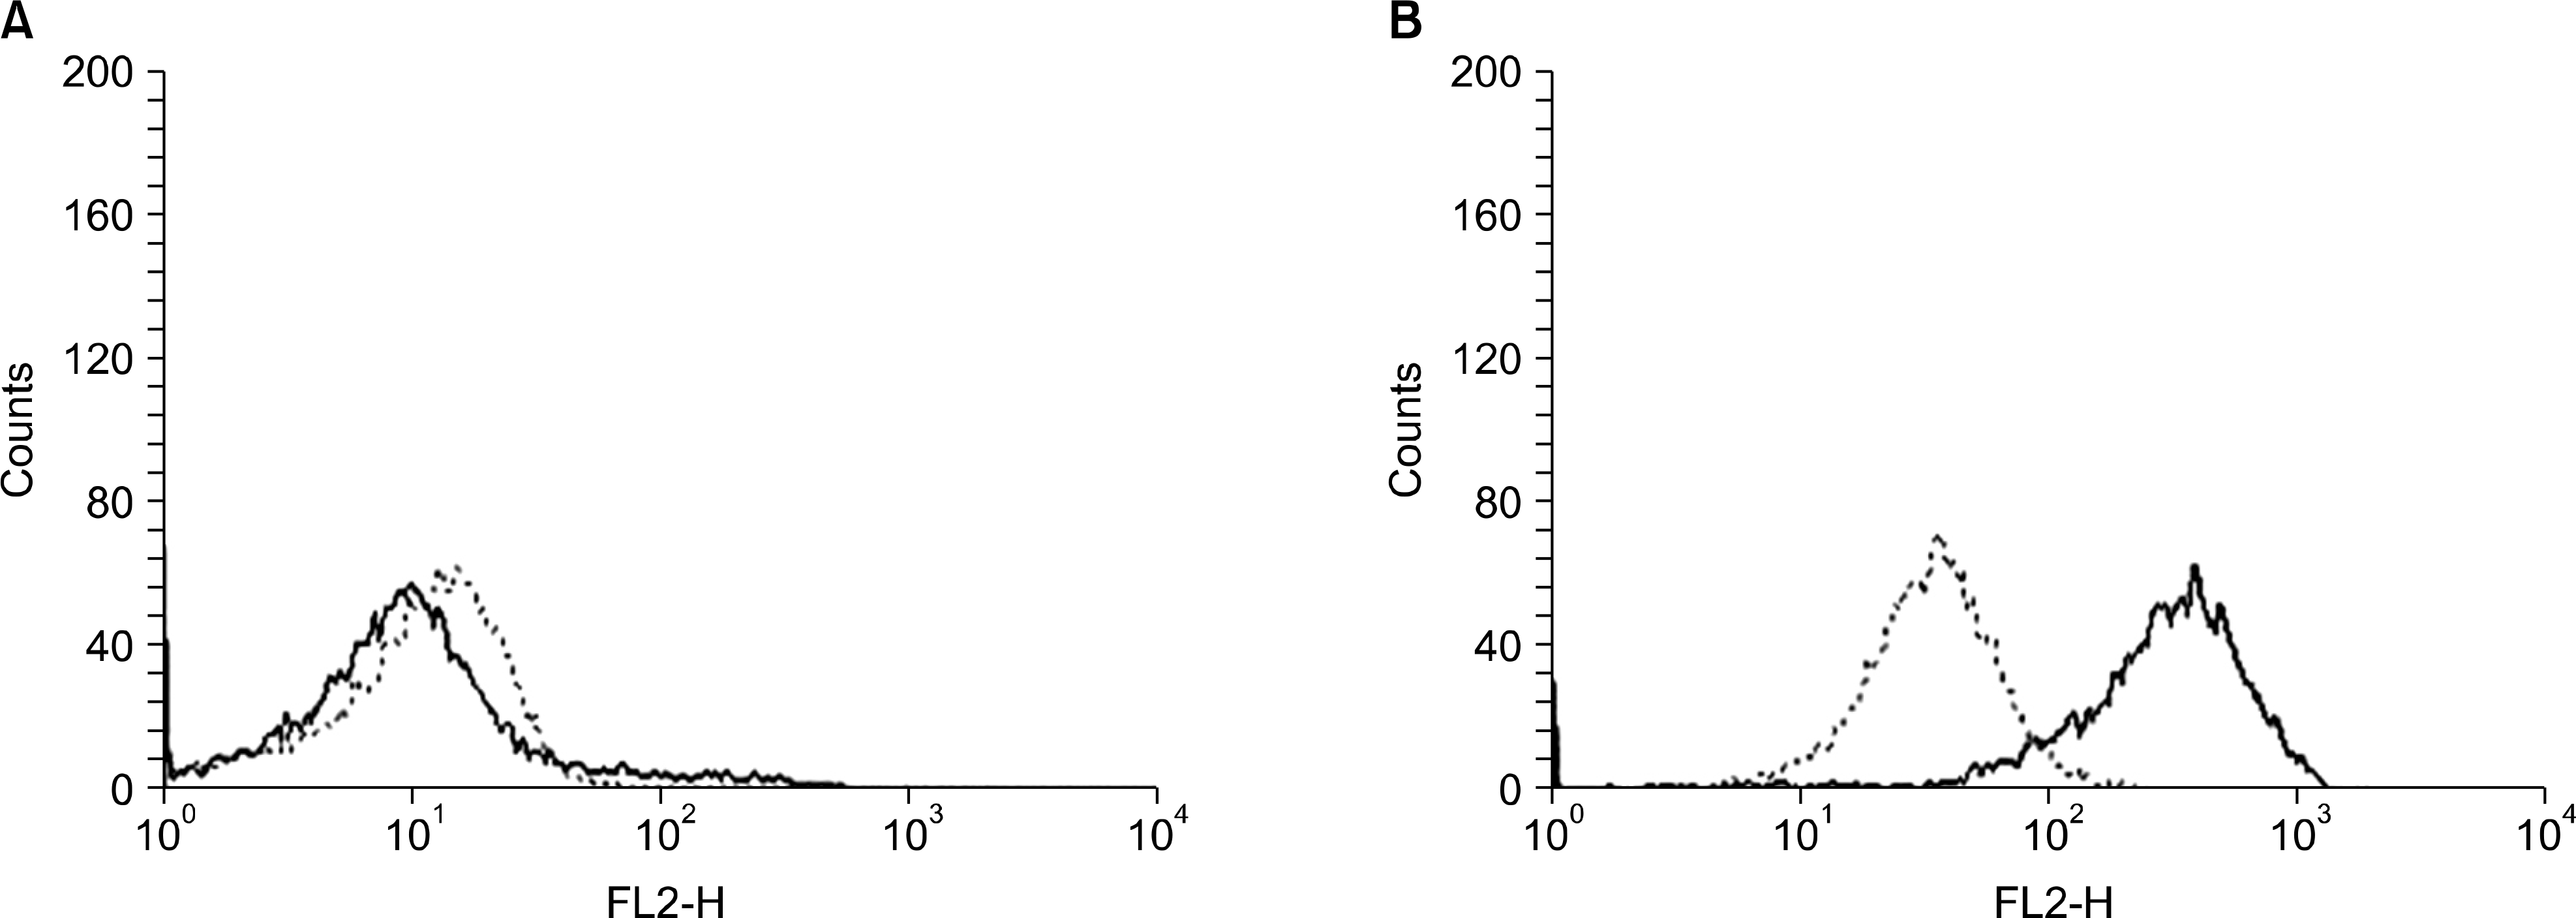
 | Fig. 2Expression of Notch1 by AML cells. Fluorescence histograms of permeabilized AML cells show no shift in the fluorescent intensity after staining with Notch1 antibody in a representative case, indicating absence of Notch1 (A), and a homogenous shift in the fluorescent intensity curve in another case, indicating a high expression of Notch1 (B). The y-axis represents cell number, and the x-axis represents log fluorescence intensity. The solid line indicates staining with mouse anti-human Notch1 monoclonal antibody, and the dashed line represents staining with an isotype-matched control antibody of irrelevant specificity. |
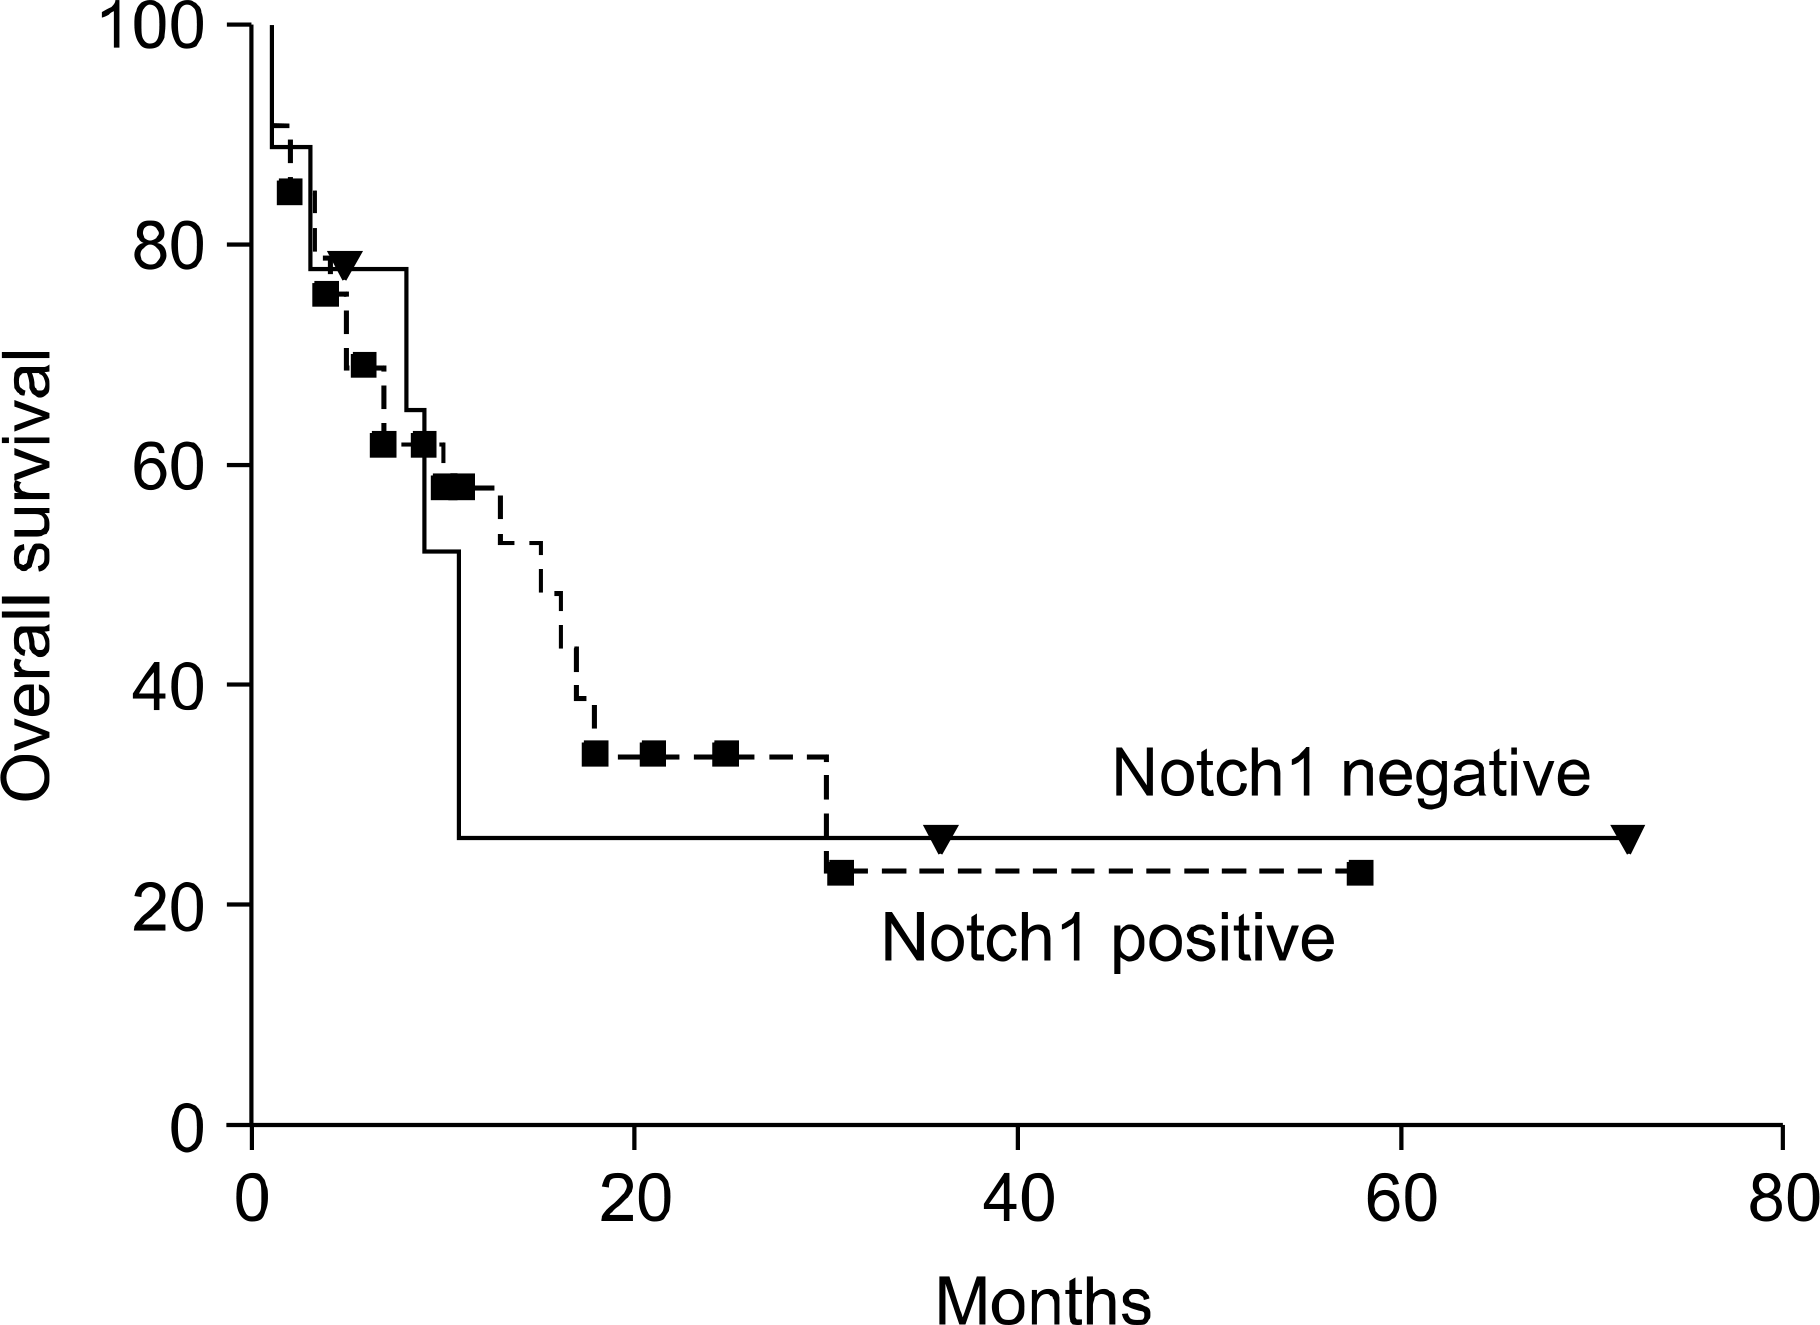
 | Fig. 3Kaplan-Meier survival curves for AML patients according to the Notch1 expression. The dotted line represents AML cases that expressed Notch1, and the solid line represents AML cases that did not express Notch1. Squares and triangles represent censored patients. The difference between the curves is not statistically significant (P=.83 for overall survival by log-rank analysis). |
Table 1.
Notch1 expression in AML cells was evaluated by RT-PCR analysis. Notch1 (−), cases did not express Notch1 transcript; Notch1 (+), cases expressed Notch1 transcript. Abbreviations: AML, acute myeloid leukemia; WBC, white blood cell; NS, not significant. Favorable cytogenetics include t(8;21), and inv (16). Intermediate cytogenetics include normal 46XX or 46XY. Unfavorable cytogenetics include 5-, 7-, 5q-, 7q- or of exaggerated hyperdiploidy, trisomy 8, t(6;9), trisomy 11, & multiple chromosomal abnormalities. ∗Data represent the mean value±standard deviations.
Table 2.
| G0/G1 phase | S phase | G2/M phase | |
|---|---|---|---|
| Notch1 (+) (n=40) | 86.1±5.4 | 7.3±2.1 | 6.4±2.9 |
| Notch1 (−) (n=10) | 74.2±5.9 | 15.6±3.7 | 10.2±4.5 |
| P value | <0.05 | <0.05 | <0.05 |
Table 3.
Numerical data represent the number of cases showing the respective pattern of expression. Survivin & p27Kip1 positive, cases coexpressing survivin and p27Kip1 mRNA; Survivin & p27Kip1 negative, cases lacking both of survivin and p27Kip1 mRNA. Correlation coefficiency between Notch1 and survivin expression, Notch1 and p27Kip1 expression, Notch1 and coex-pression of survivin/p27Kip1 was calculated using the Spearman's test.


 PDF
PDF ePub
ePub Citation
 Print
Print


 XML Download