Abstract
Background:
Urine/serum protein electrophoresis (PEP) and immunofixation electrophoresis (IEP) for monoclonal protein (M-protein) are used for initial evaluation in patients with multiple myeloma. We evaluated the prognostic significance of M-proteinuria status and its association with other prognostic factors.
Methods:
Between December 2002 and December 2004, 64 de novo symptomatic multiple myeloma patients with intact immunoglobulin (Ig) type were divided into two groups according to their initial urine PEP/IEP findings.
Results:
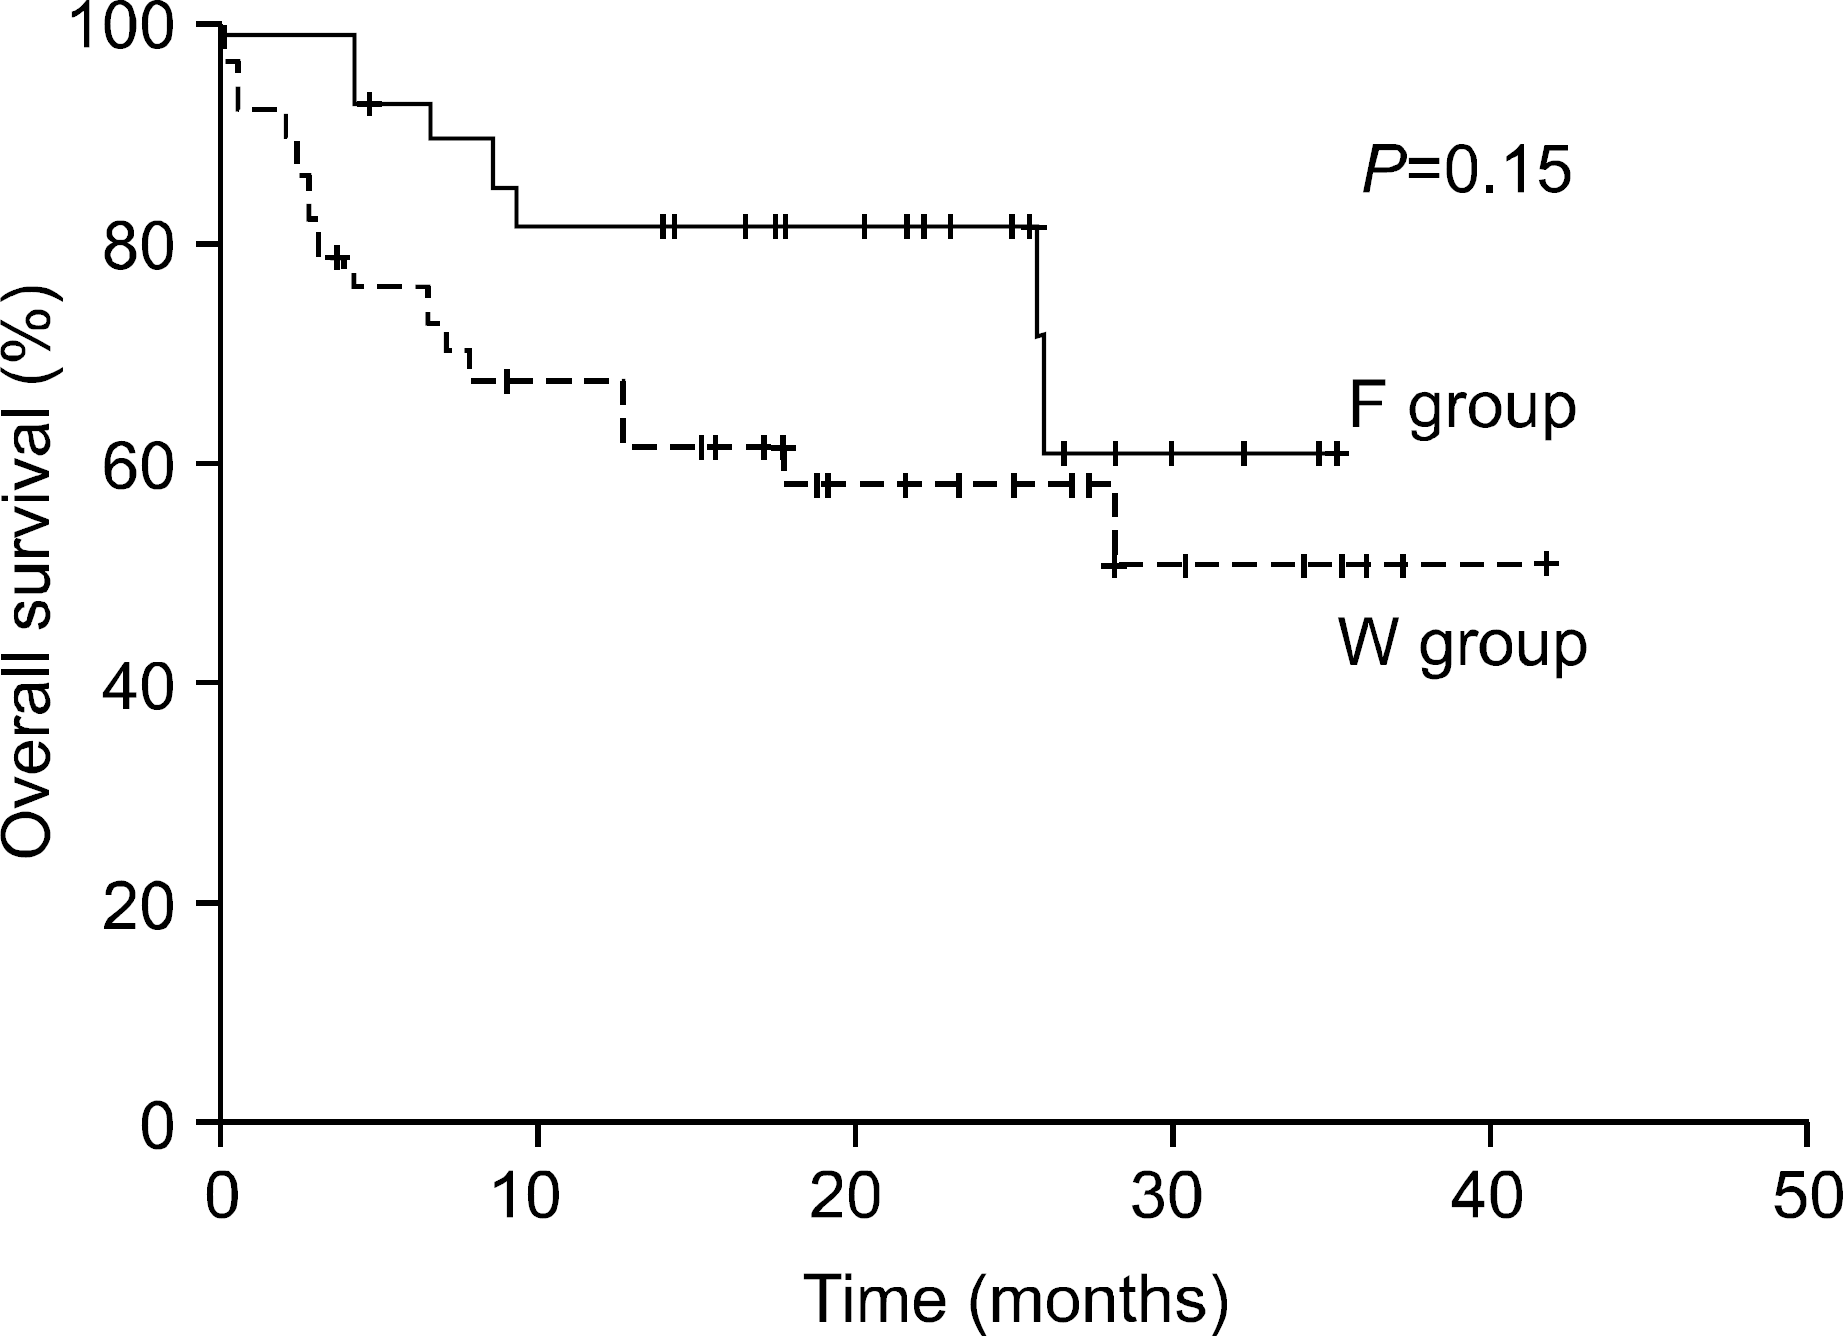
Twenty-seven patients with undetectable or free light-chains only were classified into F group, and 37 with whole Ig with or without light-chains were classified into W group. The two groups were similar in sex, age, performance, azotemia, β2-microglobulin, stage and treatment, but M-protein concentration was significantly higher in the W than in F group (5.1 vs 1.3g/dL, P<0.01). The overall response rate was significantly higher in F group than in W group (80.8% vs 63.6%, P=0.02), whereas the 2-year OS rate did not differ significantly between the groups (81.0% vs 57.7%, P=0.15).
Go to : 
REFERENCES
1). Clark AD., Shetty A., Soutar R. Renal failure and multiple myeloma: pathogenesis and treatment of renal failure and management of underlying myeloma. Blood Rev. 1999. 13:79–90.

2). Honkanen E., Pettersson T., Teppo AM. Urinary alpha 1- and beta 2-microglobulin in light chain proteinuria. Clin Nephrol. 1995. 44:22–7.
4). International Myeloma Working Group. Criteria for the classification of monoclonal gammopathies, multiple myeloma and related disorders: a report of the International Myeloma Working Group. Br J Hae-matol. 2003. 121:749–57.
5). Blade J., Samson D., Reece D, et al. Criteria for evaluating disease response and progression in patients with multiple myeloma treated by high-dose therapy and haemopoietic stem cell transplantation. Myeloma Subcommittee of the EBMT. European Group for Blood and Marrow Transplant. Br J Haematol. 1998. 102:1115–23.
6). Greipp PR., San Miguel J., Durie BG, et al. International staging system for multiple myeloma. J Clin Oncol. 2005. 23:3412–20.

7). Anagnostopoulos A., Gika D., Symeonidis A, et al. Multiple myeloma in elderly patients: prognostic factors and outcome. Eur J Haematol. 2005. 75:370–5.

8). Kyle RA. Multiple myeloma: review of 869 cases. Mayo Clin Proc. 1975. 50:29–40.
9). Knudsen LM., Hippe E., Hjorth M., Holmberg E., Westin J. Renal function in newly diagnosed multiple myeloma—a demographic study of 1,353 patients. The Nordic Myeloma Study Group. Eur J Haematol. 1994. 53:207–12.
10). Rota S., Mougenot B., Baudouin B, et al. Multiple myeloma and severe renal failure: a clinicopathologic study of outcome and prognosis in 34 patients. Medicine (Baltimore). 1987. 66:126–37.
11). Tricot G., Alberts DS., Johnson C, et al. Safety of autotransplants with high-dose melphalan in renal failure: a pharmacokinetic and toxicity study. Clin Cancer Res. 1996. 2:947–52.
12). Tosi P., Zamagni E., Ronconi S, et al. Safety of autologous hematopoietic stem cell transplantation in patients with multiple myeloma and chronic renal failure. Leukemia. 2000. 14:1310–3.

13). San Miguel JF., Lahuerta JJ., Garcia-Sanz R, et al. Are myeloma patients with renal failure candidates for autologous stem cell transplantation? Hematol J. 2000. 1:28–36.

14). BladéJ. Fernández-Llama P., Bosch F, et al. Renal failure in multiple myeloma: presenting features and predictors of outcome in 94 patients from a single institution. Arch Intern Med. 1998. 158:1889–93.
15). Knudsen LM., Hjorth M., Hippe E. Renal failure in multiple myeloma: reversibility and impact on the prognosis. Eur J Haematol. 2000. 65:175–81.

16). Bazzi C., Petrini C., Rizza V, et al. Urinary excretion of IgG and alpha(1)-microglobulin predicts clinical course better than extent of proteinuria in membranous nephropathy. Am J Kidney Dis. 2001. 38:240–8.
Go to : 
Table 1.
Patient demographic and clinical characteristics at baseline
Table 2.
Patient laboratory characteristics at baseline
Table 3.
Univariate and multivariate analysis of clinicopathologic factors associated with overall survival


 PDF
PDF ePub
ePub Citation
 Print
Print


 XML Download