Abstract
Introduction
This study compared the alveolar bone density of the mandible according to gender, age and position using Cone-beam computed tomography (CT).
Materials and Methods
The maxillofacial CT scan data was obtained from 60 Korean patients. In addition, the alveloar bone density of 5 males and 5 females with normal occlusion aged from 10 to 70 years was measured at the buccal cortical bone, cancellous bone and lingual cortical bone, as well as at the position of the incisors, canines, premolars and molars.
Results
The age-specific mean bone density was highest in patients in their third decade. The buccal cortical bone of the molars showed the highest bone density. Males in their fifties and sixties had a higher bone density in the cancellous bone in the region of the premolars and the buccal cortical bone of the molars, respectively, than females but there was no significant difference between males and females in the other parts. The cancellous bone density was highest in those in their twenties and thirties, and tended to decline up to their seventh decade.
References
1. Neufeld JO. Changes in the trabecular pattern of the mandible following the loss of teeth. J Pro Den. 1958; 8:685–97.

2. Denissen HW, Veldhuis HA, van Faassen F. Implant placement in the atrophic mandible: an anatomic study. J Prosthet Dent. 1984; 52:260–3.

3. von Wowern N, Stoltze K. Age differences in cortical width of mandibles determined by histoquantitation. Scand J Dent Res. 1979; 87:225–33.
4. von Wowern N, Stoltze K. Sex and age differences in bone morphology of mandibles. Scand J Dent Res. 1978; 86:478–85.
5. Lindh C, Petersson A, Klinge B, Nilsson M. Trabecular bone volume and bone mineral density in the mandible. Dentomaxillofac Radiol. 1997; 26:101–6.

6. Pouilles JM, Tremollieres F, Todorovsky N, Ribot C. Precision and sensitivity of dual-energy x-ray absorptiometry in spinal osteoporosis. J Bone Miner Res. 1991; 6:997–1002.

7. Berman CL. Osseointegration. Complications. Prevention, recognition, treatment. Dent Clin North Am. 1989; 33:635–63.
8. Kim HW, Huh KH, Park KS, Kim JH, Lee WJ, Huh MS, et al. Correlation of bone quality in radiographic images with clinical bone quality classification. Korean J Oral Maxillofac Radiol. 2006; 36:25–32.
9. Kim JD. Assessment of the measurement method of the bone mineral density on Cu-equivalent image. Korean J Oral Maxillofac Radiol. 2000; 30:101–8.
10. Lee BD. Diagnostic method of osteoporosis using dental radiographic images. J Korean Dental Assoc. 2004; 42:184–9.
11. Cameron JR, Sorenson J. Measurement of bone mineral in vivo. An improved method. Science. 1964; 142:230–2.

12. Engquist B, Bergendal T, Kallus T, Linden U. A retrospective multicenter evaluation of osseointegrated implants supporting overdentures. Int J Oral Maxillofac Implants. 1988; 3:129–34.
13. Jaffin RA, Berman CL. The excessive loss of Branemark fixtures in type IV bone: a 5-year analysis. J Periodontol. 1991; 62:2–4.

14. Payne JB, Reinhardt RA, Nummikoski PV, Patil KD. Longitudinal alveolar bone loss in postmenopausal osteoporotic/osteopenic women. Osteoporos Int. 1999; 10:34–40.

15. Sukovic P. Cone beam computed tomography in craniofacial imaging. Orthod Craniofac Res. 2003; 6(Suppl 1):31–6.

16. Christiansen C, Rödbro P, Jensen H. Bone mineral content in the forearm measured by photon absorptiometry. Principles and reliability. Scand J Clin Lab Invest. 1975; 35:323–30.

17. Lekholm U, Zarb GA. Patient selection and preparation. Branemark PI, Zarb GA, Albreksson T, editors. Tissue integrated prostheses: osseointegration in clinical dentistry. Chicago: Quintessence;1985. p. 199–209.
18. Misch CE. Density of bone: effect on treatment plans, surgical approach, healing, and progressive boen loading. Int J Oral Implantol. 1990; 6:23–31.
19. Carter DR, Hayes WC. Bone compressive strength: the influence of density and strain rate. Science. 1976; 194:1174–6.

20. Rice JC, Cowin SC, Bowman JA. On the dependence of the elasticity and strength of cancellous bone on apparent density. J Biomech. 1988; 21:155–68.

21. Duckmanton NA, Austin BW, Lechner SK, Klineberg IJ. Imaging for predictable maxillary implants. Int J Prosthodont. 1994; 7:77–80.
22. Norton MR, Gamble C. Bone classification: an objective scale of bone density using the computerized tomography scan. Clin Oral Implants Res. 2001; 12:79–84.

23. Misch CE, Kircos LT. Diagnostic imaging and techniques. Misch CE, editor. Contemporary implant dentistry. 2nd ed.St Louis: Mosby;1999. p. 73–87.
24. Ay S, Gursoy UK, Erselcan T, Marakoglu I. Assessment of mandibular bone mineral density in patients with type 2 diabetes mellitus. Dentomaxillofac Radiol. 2005; 34:327–31.

25. Bodic F, Hamel L, Lerouxel E, Baslé MF, Chappard D. Bone loss and teeth. Joint Bone Spine. 2005; 72:215–21.

26. Gorustovich AA, Espósito MA, Guglielmotti MB, Giglio MJ. Mandibular bone remodeling under a choline-deficient diet: a histomorphometric study in rats. J Periodontol. 2003; 74:831–7.

27. Elovic RP, Hipp JA, Hayes WC. Maxillary molar extraction causes increased bone loss in the mandible of ovariectomized rats. J Bone Miner Res. 1995; 10:1087–93.

28. August M, Chung K, Chang Y, Glowacki J. Influence of estrogen status on endosseous implant osseointegration. J Oral Maxillofac Surg. 2001; 59:1285–9.

29. Pasco JA, Henry MJ, Kotowicz MA, Collier GR, Ball MJ, Ugoni AM, et al. Serum leptin levels are associated with bone mass in nonobese women. J Clin Endocrinol Metab. 2001; 86:1884–7.

30. César-Neto JB, Benatti BB, Neto FH, Sallum AW, Sallum EA, Nociti FH. Smoking cessation may present a positive impact on mandibular bone quality and periodontitis-related bone loss: a study in rats. J Periodontol. 2005; 76:520–5.

31. Parfitt GJ. An investigation of the normal variations in alveolar bone trabeculation. Oral Surg Oral Med Oral Pathol. 1962; 15:145363.

32. Henrikson PA, Wallenius K. The mandible and osteoporosis. J Oral Rehabil. 1974; 1:67–74.
33. Ulm CW, Kneissel M, Hahn M, Solar P, Matejka M, Donath K. Characteristics of the cancellous bone of edentulous mandibles. Clin Oral Implants Res. 1997; 8:125–30.

34. Dutra V, Yang J, Devlin H, Susin C. Radiomorphometric indices and their relation to gender, age, and dental status. Oral Surg Oral Med Oral Pathol Oral Radiol Endod. 2005; 99:479–84.

35. von Wowern N. Bone mass of mandibles. In vitro and in vivo analyses. Dan Med Bull. 1986; 33:23–44.
36. Pavlova MN, Peliakov AN. Age changes in the mineralization of the human femur according to quantitative microradiographic data. Arkh Anat Gistol Embriol. 1971; 61:83–8.
37. Klemetti E, Vainio P, Kröger H. Muscle strength and mineral densities in the mandible. Gerodontology. 1994; 11:76–9.

38. Yong SJ, Lim SK, Huh KB, Park BM, Kim NH. Bone mineral density of normal Korean adults. J Korean Med Assoc. 1988; 31:1350–8.
39. Ding M, Dalstra M, Danielsen CC, Kabel J, Hvid I, Linde F. Age variations in the properties of human tibial trabecular bone. J Bone Joint Surg Br. 1997; 79:995–1002.

41. Park HS. An anatomical study on success rate of microscrew implants for orthodontic anchorage. Kor J Orthod. 2002; 32:435–41.
42. Goldsmith NF, Johnston JO, Picetti G, Garcia C. Bone mineral in the radius and vertebral osteoporosis in an insured population. A correlative study using 125-I photon absorption and miniature roentgenography. J Bone Joint Surg Am. 1973; 55:1276–93.
44. Mazess RB, Cameron JR. Bone mineral content in normal U.S. whites. Mazess RB, editor. International Conferece on bone mineral measurement. Washington, DC: NIH;1974. p. 675–683.
45. Riggs BL, Wahner HW, Seeman E, Offord KP, Dunn WL, Mazess RB, et al. Changes in bone mineral density of the proximal femur and spine with aging. Differences between the postmenopausal and senile osteoporosis syndromes. J Clin Invest. 1982; 70:716–23.
46. Aloia JF, Vaswani A, Ellis K, Yuen K, Cohn SH. A model for involutional bone loss. J Lab Clin Med. 1985; 106:630–7.
Fig. 1.
Windows of EZ3D (2009 Professional Version, Vatech, Hwaseong, Korea) program, sagittal views. Chul-Won Lee et al: The bone density of mandible as the aging process in Koreans. J Korean Assoc Oral Maxillofac Surg 2011
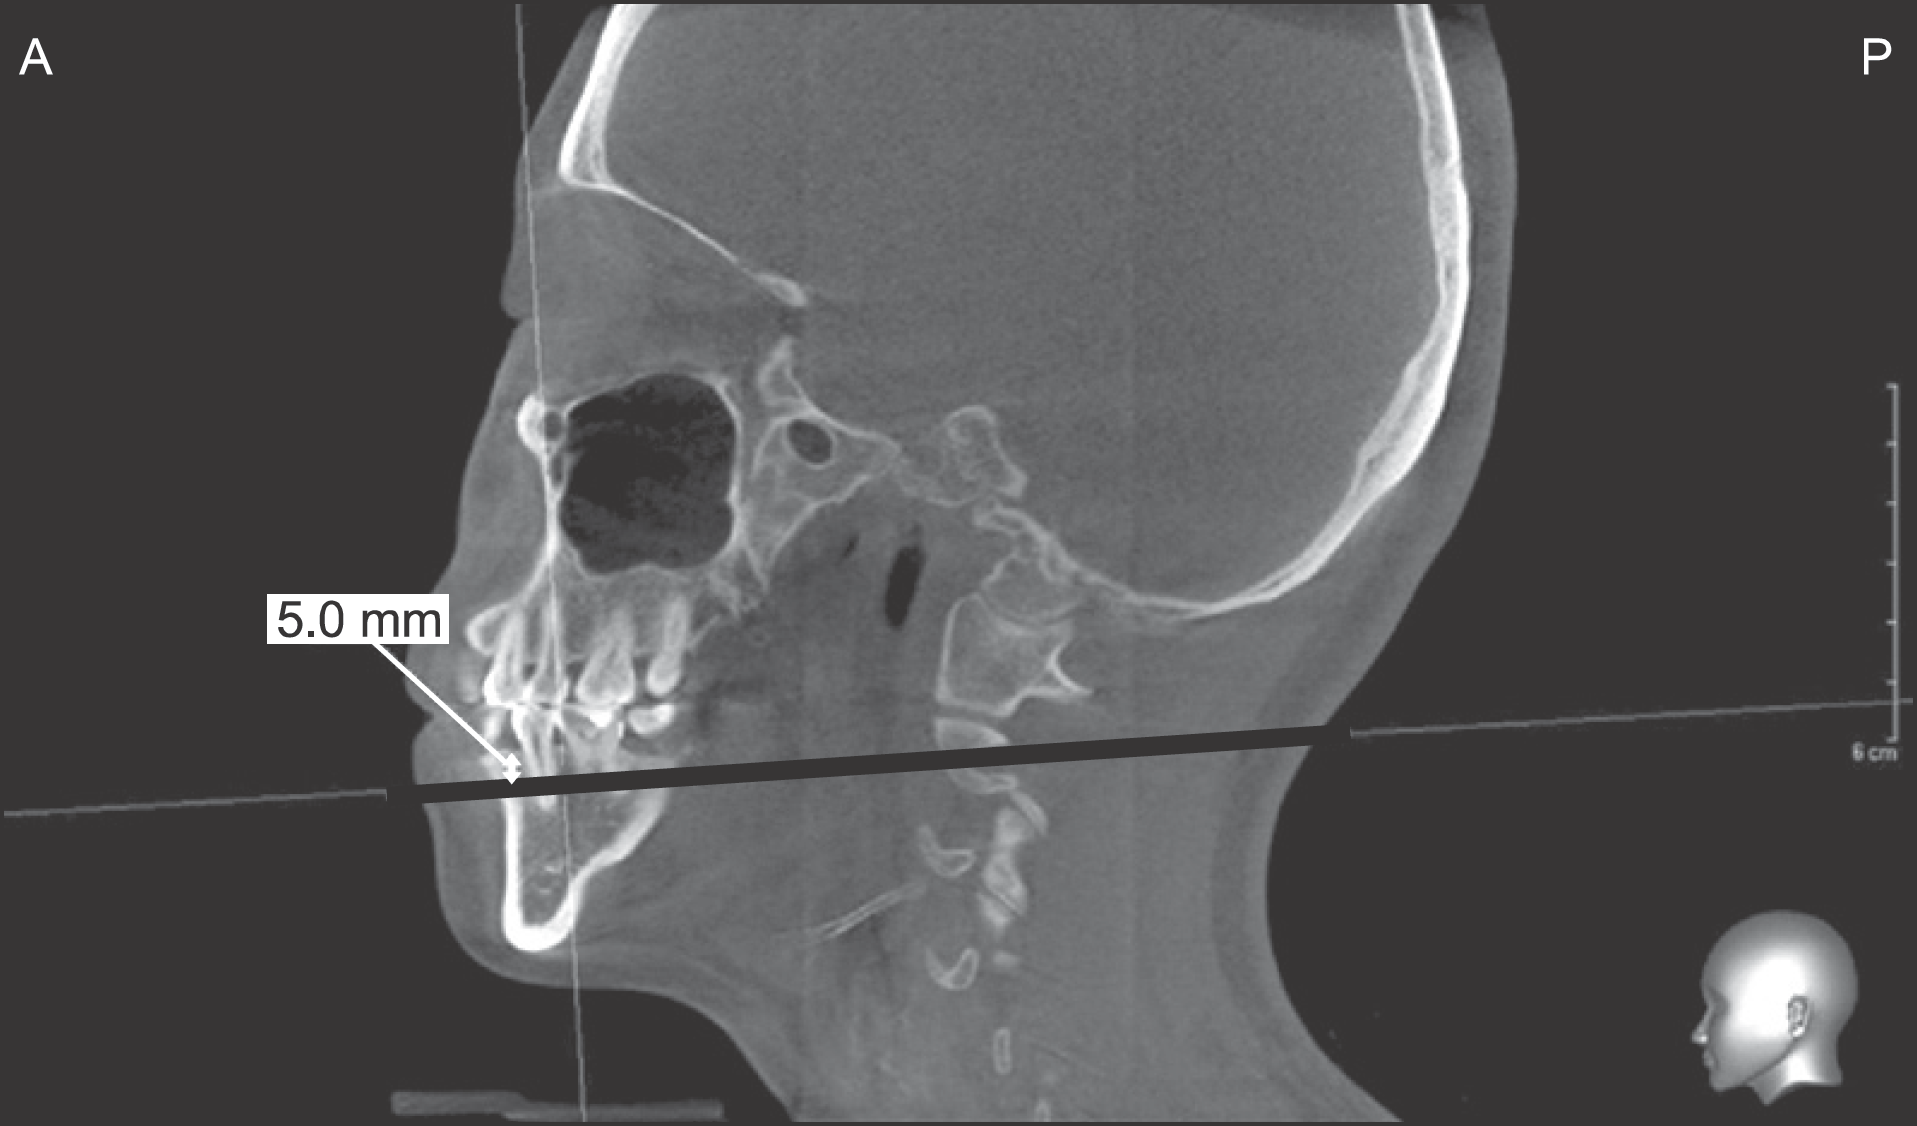
Fig. 2.
Tomography image showing the site of root in EZ3D (2009 Professional Version, Vatech, Hwaseong, Korea) program. Chul-Won Lee et al: The bone density of mandible as the aging process in Koreans. J Korean Assoc Oral Maxillofac Surg 2011
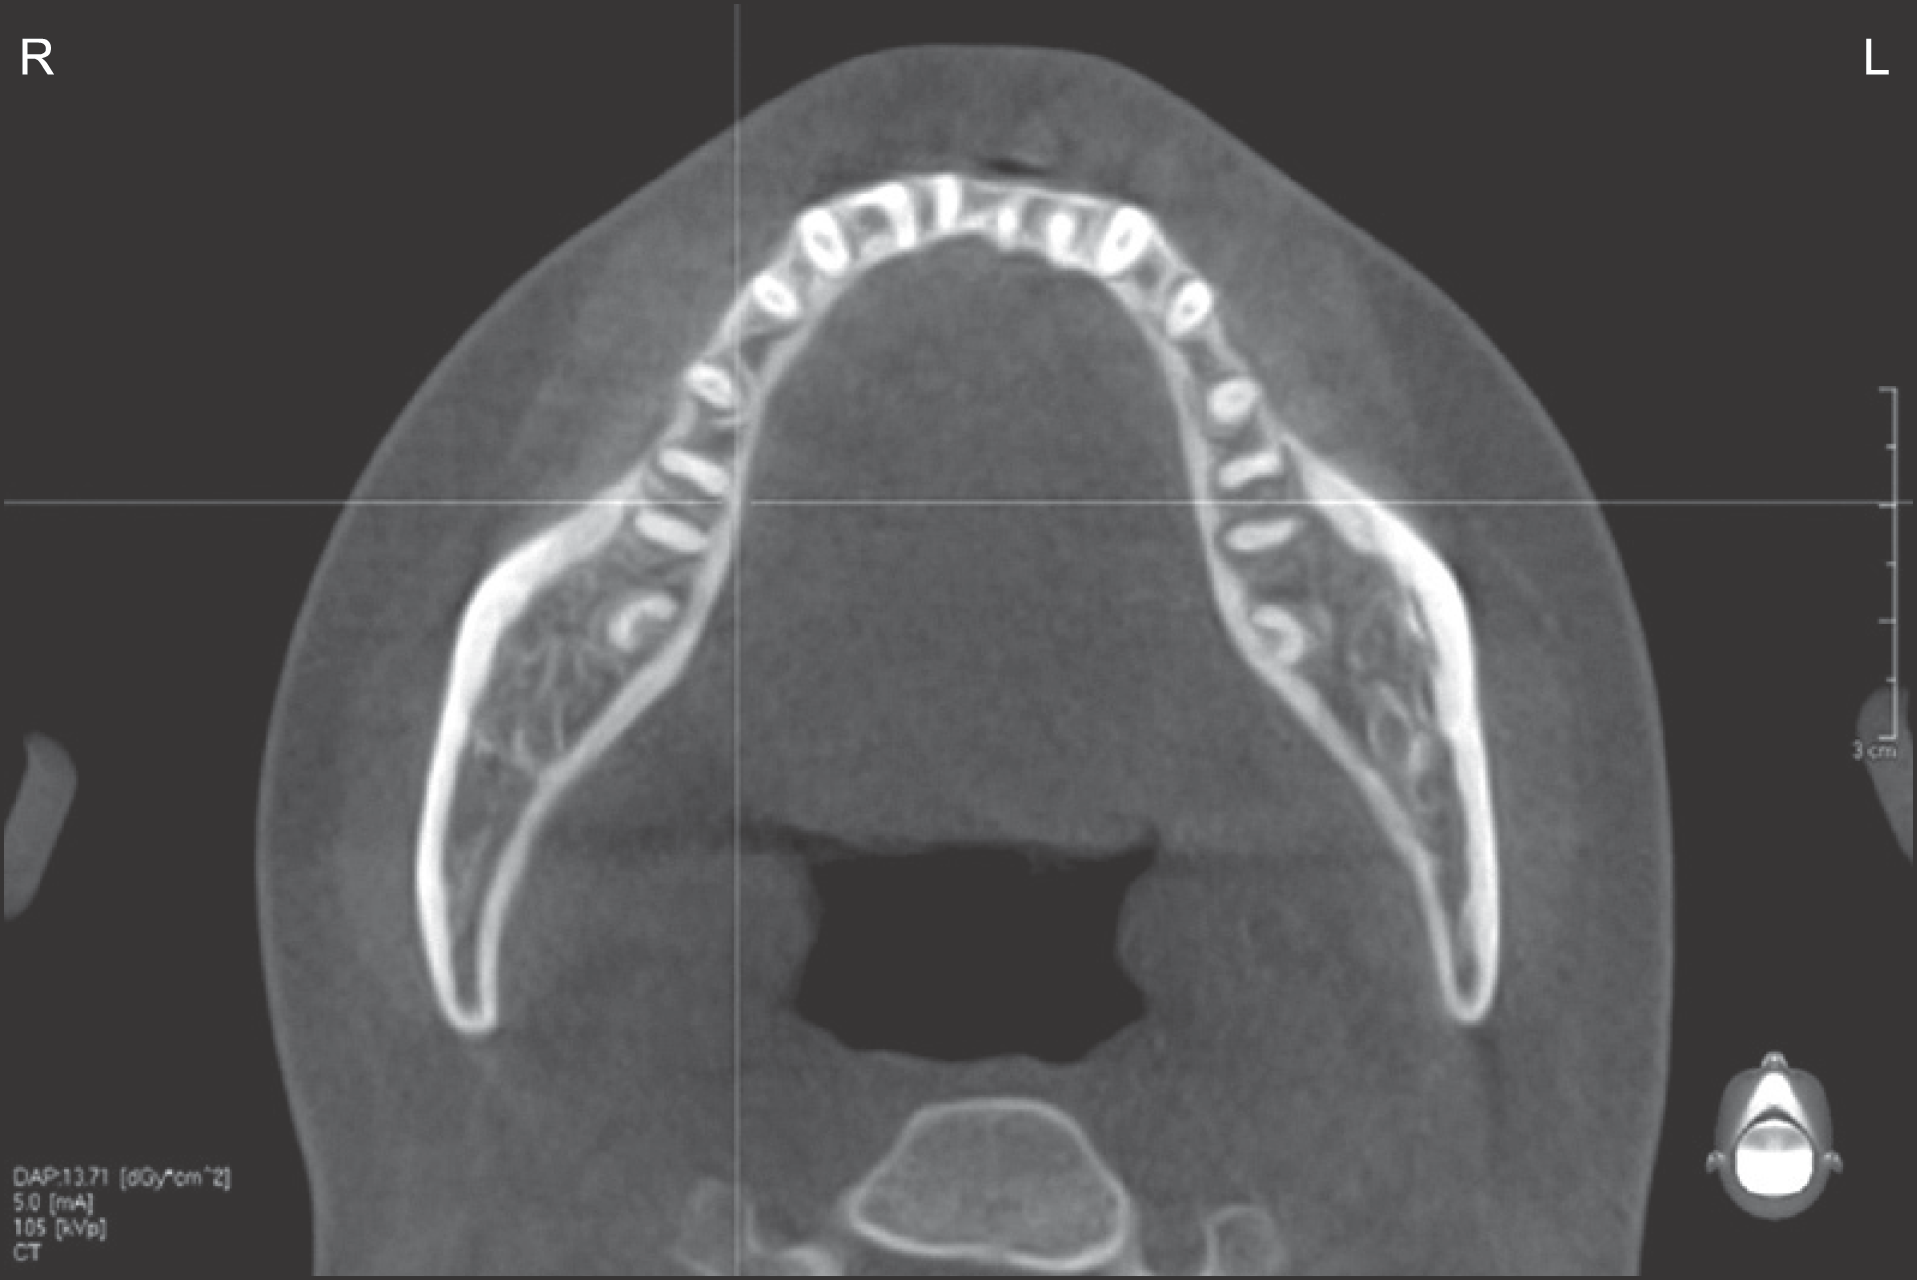
Fig. 3.
Incisor point (between 41 to 42), canine point (between 43 to 44), premolar point (between 44 to 45), molar point (between 46 to 47). Chul-Won Lee et al: The bone density of mandible as the aging process in Koreans. J Korean Assoc Oral Maxillofac Surg 2011
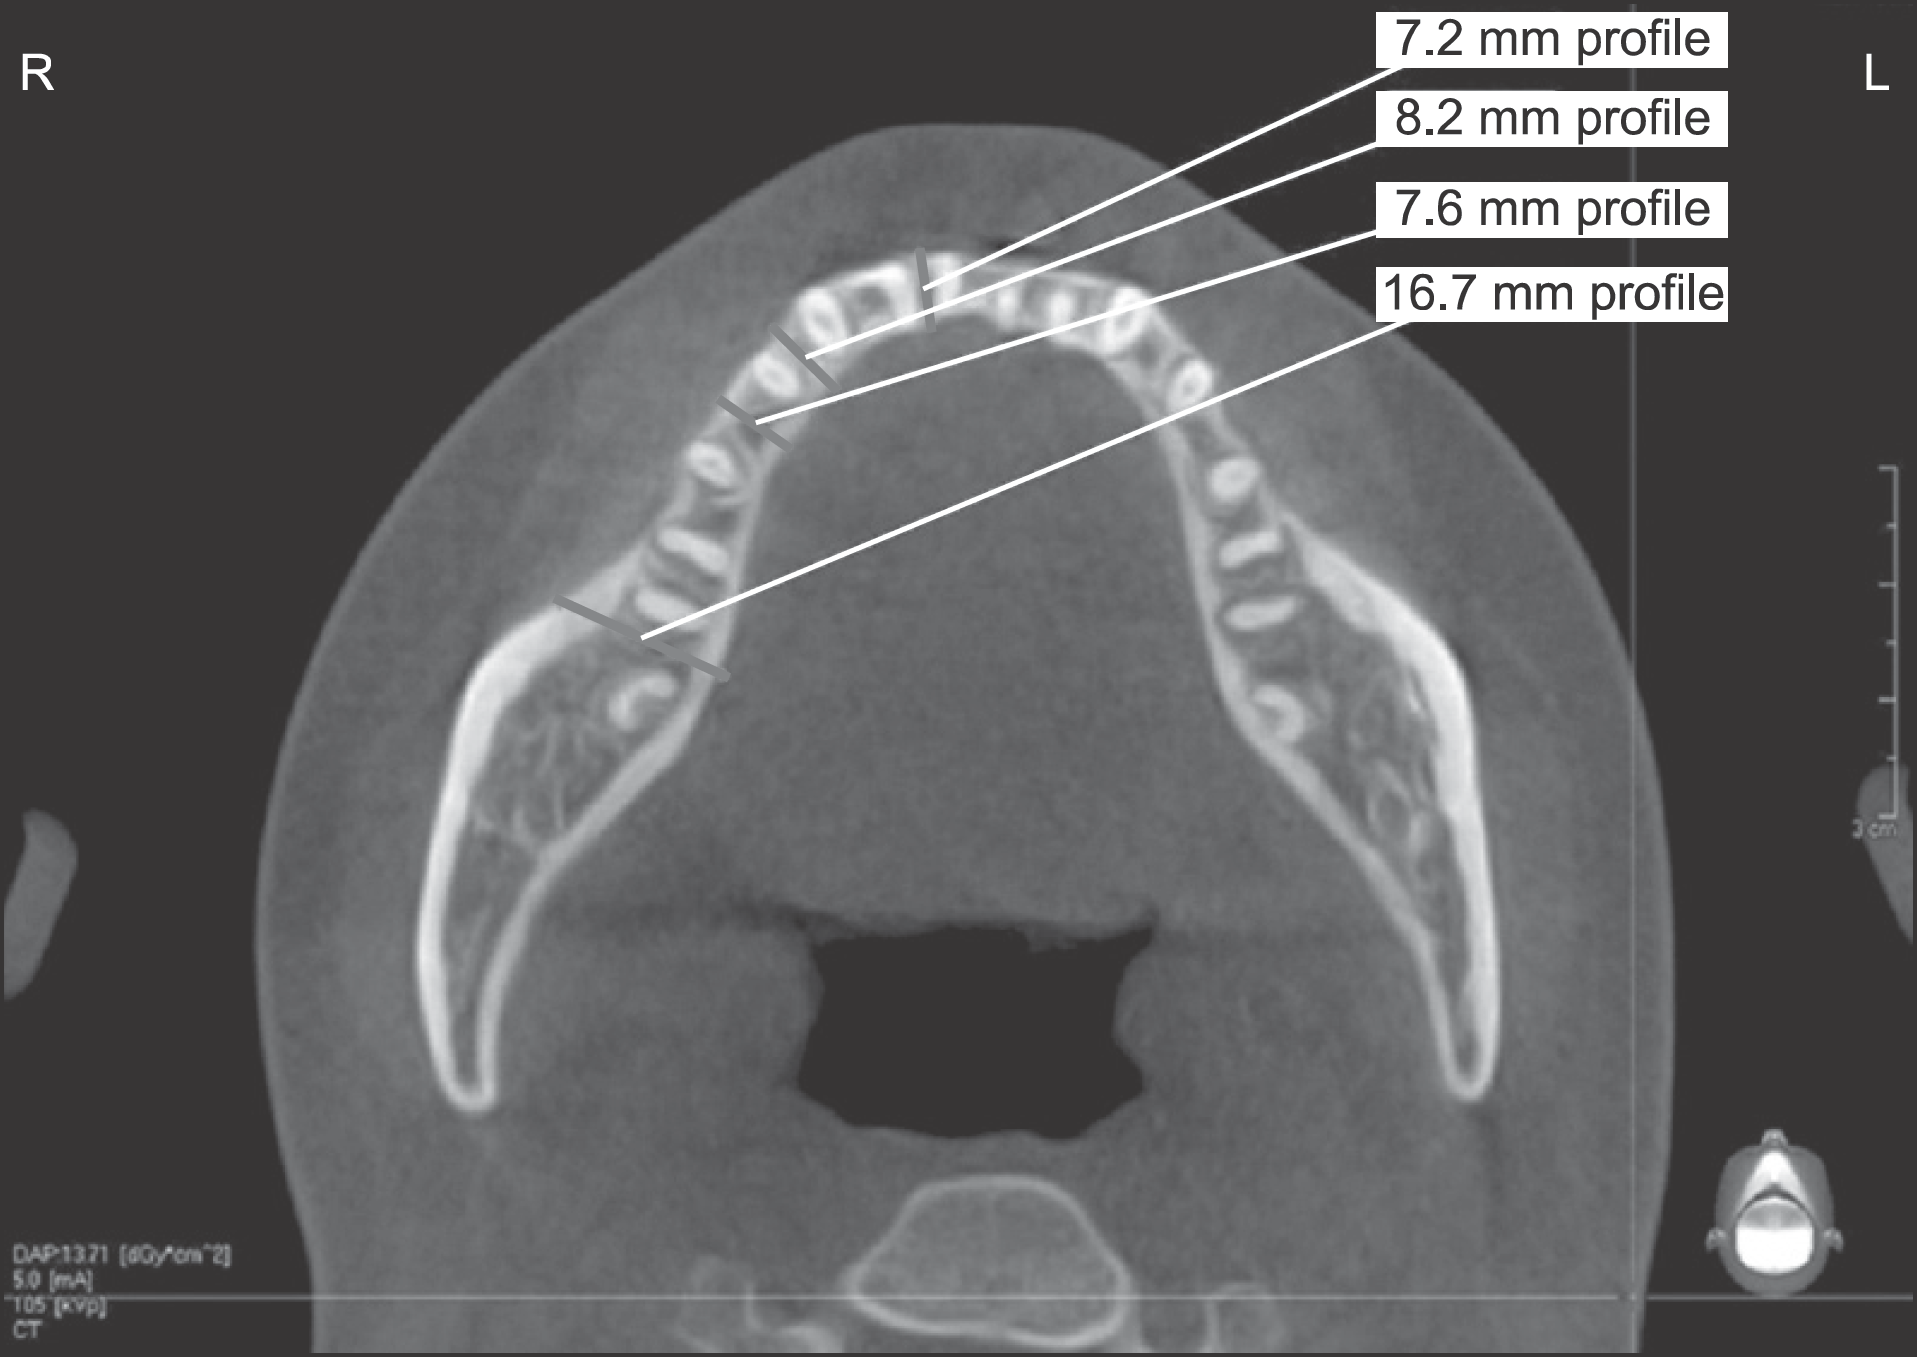
Fig. 4.
Bone density is expressed as hounsfield unit in EZ3D. This image showing in the area between 1st molar and 2nd molar of mandible. Chul-Won Lee et al: The bone density of mandible as the aging process in Koreans. J Korean Assoc Oral Maxillofac Surg 2011
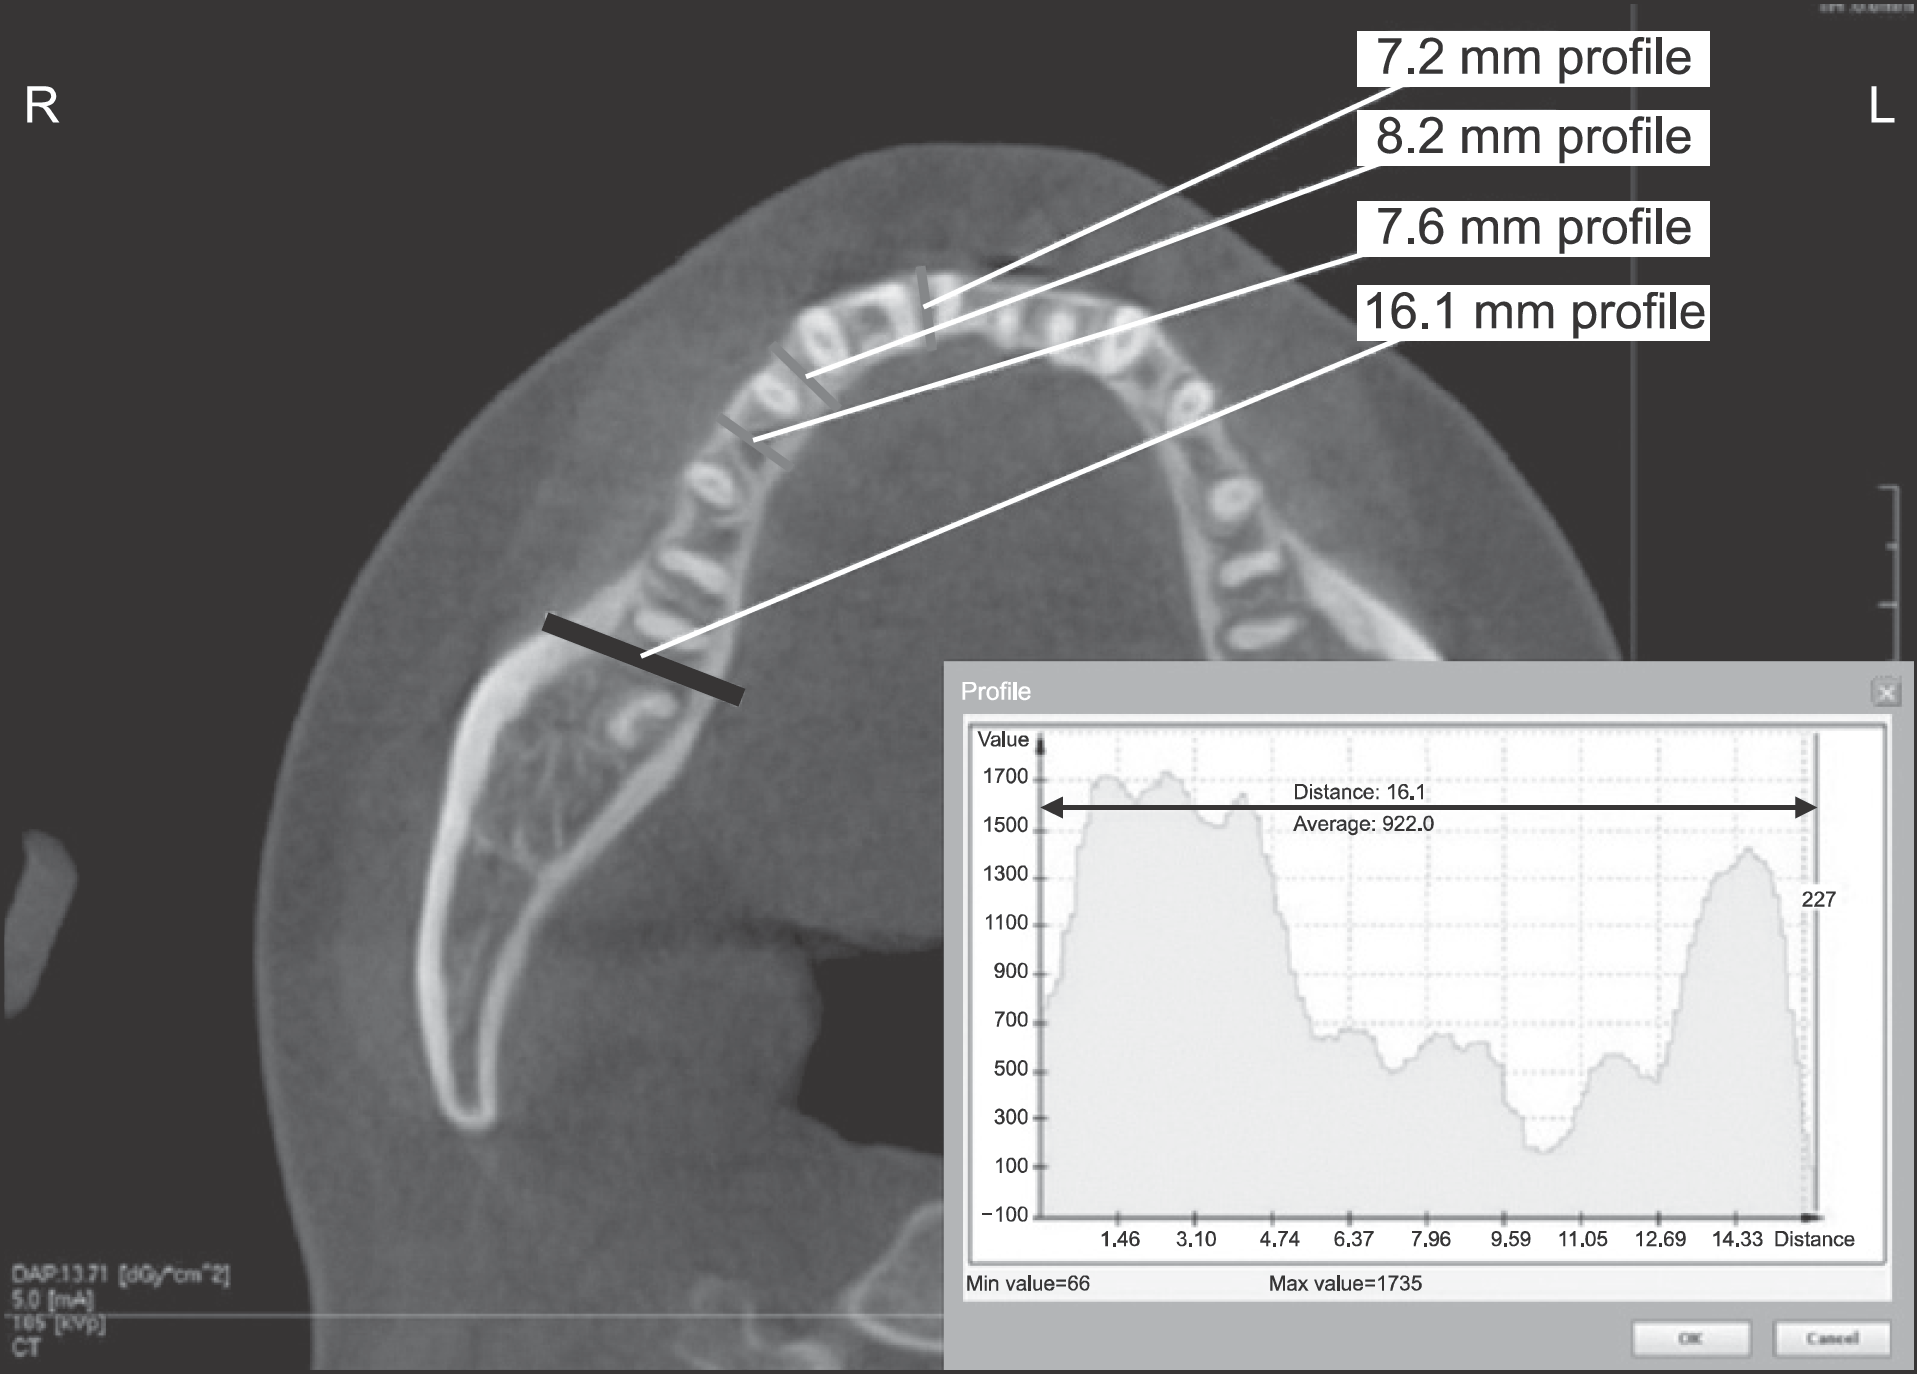
Fig. 5.
This image showing cancellous bone density in the area between 1st molar and 2nd molar of mandible. Chul-Won Lee et al: The bone density of mandible as the aging process in Koreans. J Korean Assoc Oral Maxillofac Surg 2011
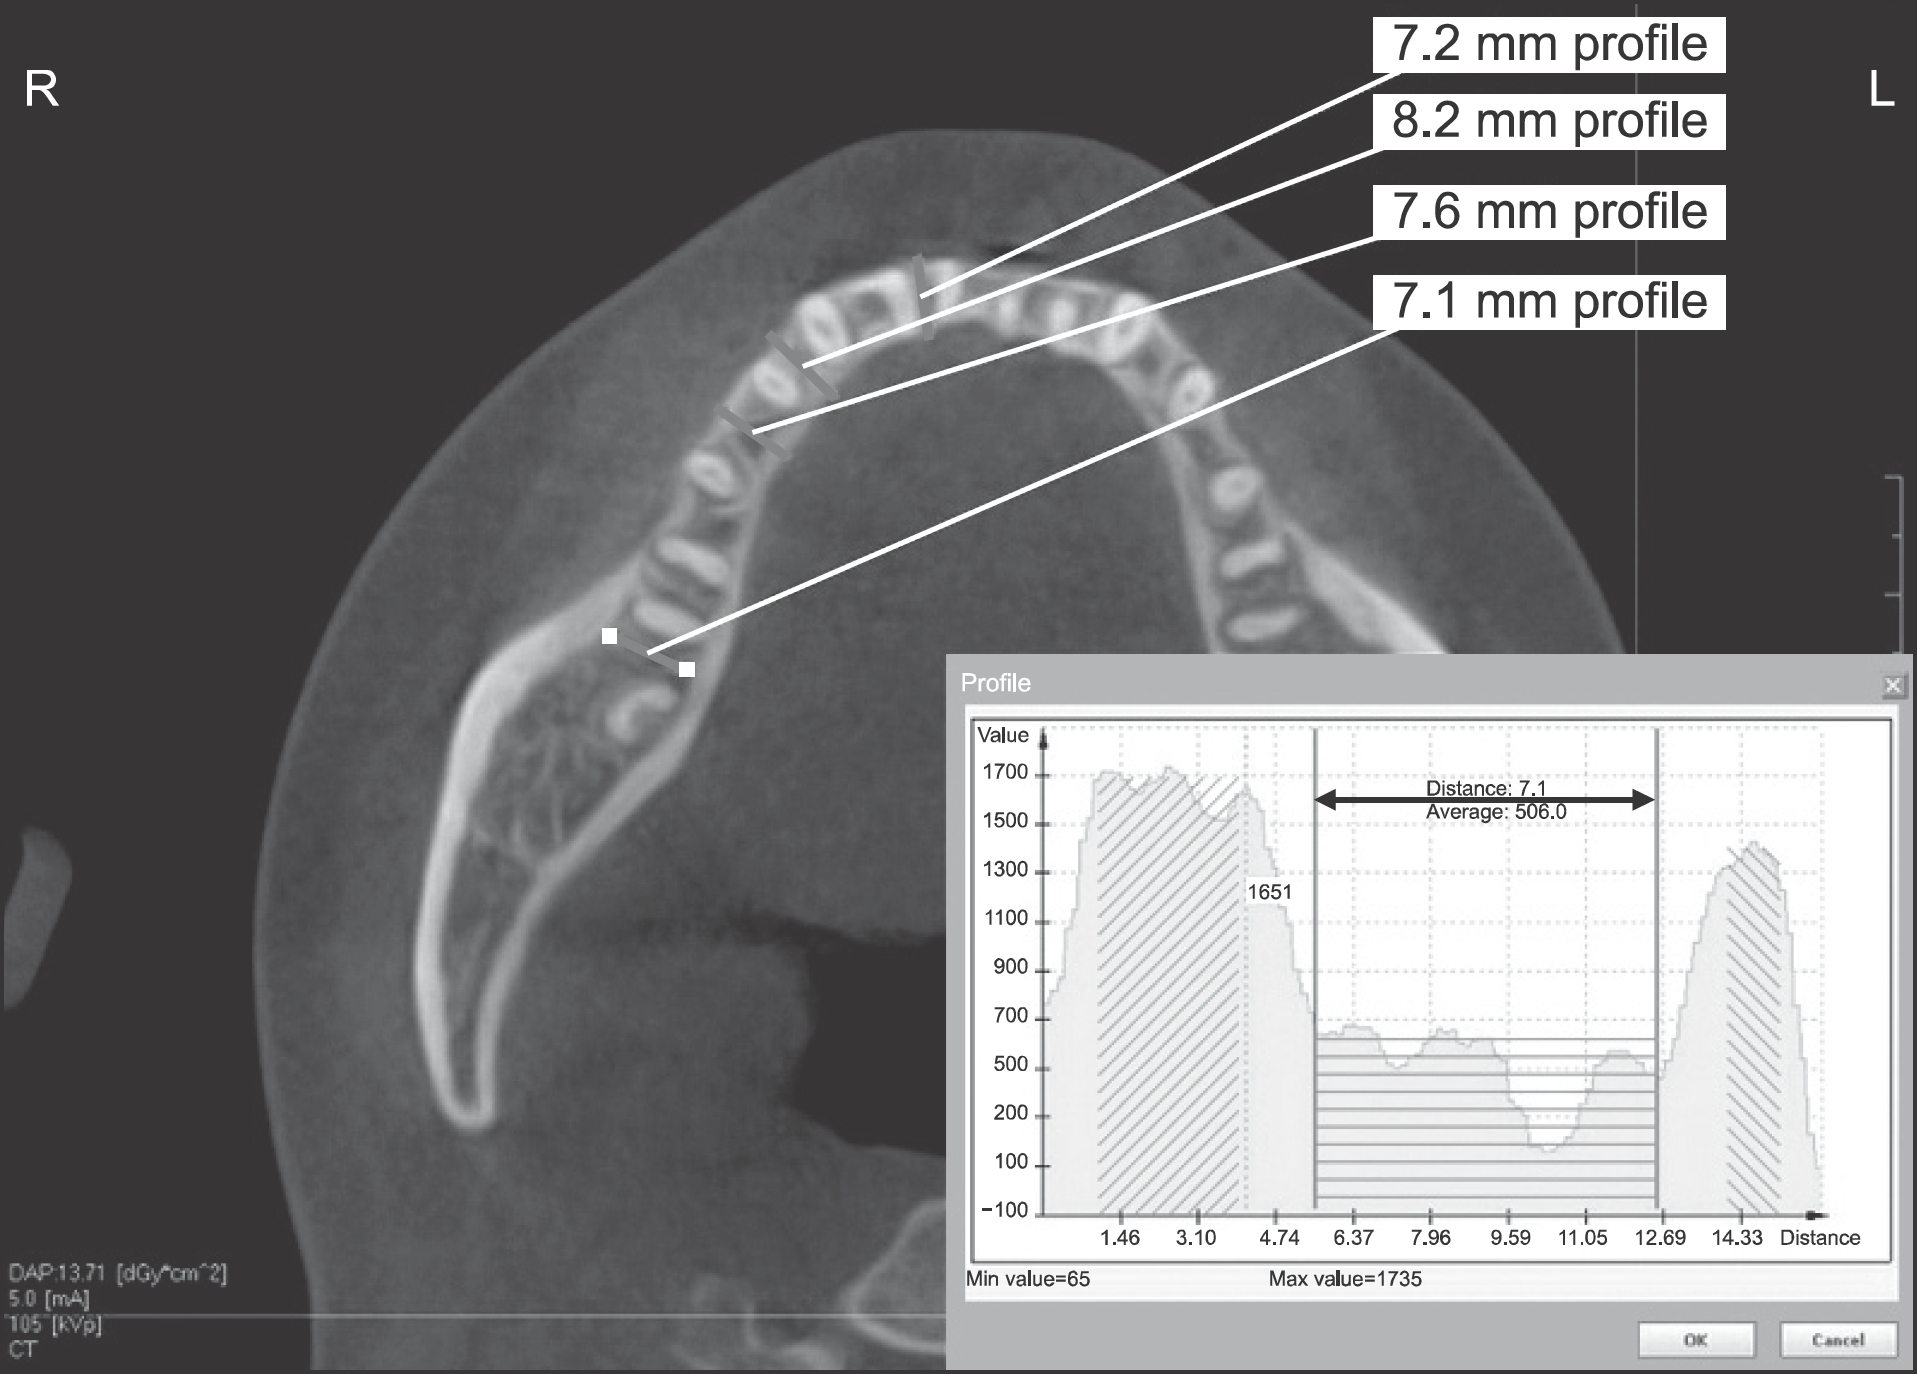
Table 1.
Patient distribution according to age and gender
Table 2.
Mean bone density of mandible (hounsfield unit, mean±standard deviation)
Table 3.
Statistical analysis of bone density and comparison between male and female (hounsfield unit, mean±standard deviation)
| Age (yr) Gender | 51–60 | 61–70 | |||||
|---|---|---|---|---|---|---|---|
| Male | Female | P-value | Male | Female | P-value | ||
| Incisor | B. cortical | 728±65 | 664±88 | NS | 614±64 | 615±43 | NS |
| Cancellous | 393±86 | 383±91 | NS | 190±13 | 179±18 | NS | |
| L. cortical | 724±76 | 669±86 | NS | 606±19 | 579±19 | NS | |
| Canine | B. cortical | 731±62 | 698±78 | NS | 616±54 | 619±31 | NS |
| Cancellous | 392±54 | 391±94 | NS | 171±21 | 174±18 | NS | |
| L. cortical | 756±80 | 696±72 | NS | 593±29 | 595±32 | NS | |
| Premolar | B. cortical | 910±91 | 869±84 | NS | 714±41 | 683±77 | NS |
| Cancellous | 399±25 | 320±35 | * | 161±17 | 164±25 | NS | |
| L. cortical | 1,132±82 | 1,102±95 | NS | 688±30 | 654±34 | NS | |
| Molar | B. cortical | 1,152±119 | 1,011±80 | NS | 900±36 | 831±29 | * |
| Cancellous | 358±81 | 324±95 | NS | 152±20 | 172±10 | NS | |
| L. cortical | 1,146±83 | 1,080±78 | NS | 808±21 | 736±21 | NS | |
Table 4.
Statistical analysis of bone density as aging process (hounsfield unit, mean±standard deviation)
| Age | 11–20 | 21–30 | 31–40 | 41–50 | 51–60 | 61–70 | P-value | |
|---|---|---|---|---|---|---|---|---|
| Incisor | B. cortical | 630.9±64 | 825.3±89 | 825.8±97 | 805.2±73 | 696.1±86 | 614.8±55 | * |
| Cancellous | 354.9±66 | 473.4±75 | 498.3±95 | 439.6±95 | 388.0±95 | 184.4±29 | * | |
| L. cortical | 653.1±58 | 863.4±84 | 817.4±89 | 807.9±99 | 696.8±92 | 592.5±86 | * | |
| Canine | B. cortical | 603.9±84 | 1,050.5±67 | 858.7±69 | 845.1±59 | 714.9±107 | 617.3±62 | * |
| Cancellous | 390.7±69 | 508.2±59 | 499.2±99 | 431.1±79 | 391.7±95 | 172.4±48 | * | |
| L. cortical | 678.1±98 | 1,118.7±83 | 1,027.0±79 | 827.8±73 | 726.3±68 | 594.3±37 | * | |
| Pre-molat | B. cortical | 608.0±73 | 1,149.7±88 | 955.7±71 | 1,019.8±68 | 889.6±98 | 698.7±65 | * |
| Cancellous | 347.9±66 | 503.9±95 | 497.9±68 | 433.9±87 | 359.1±68 | 162.4±30 | * | |
| L. cortical | 712.2±109 | 1,241.1±160 | 1,035.5±95 | 1,066.1±66 | 1,117.2±121 | 670.9±81 | * | |
| Molar | B. cortical | 700.2±91 | 1,336.6±94 | 1,346.3±135 | 1,179.1±113 | 1,081.6±134 | 865.5±67 | * |
| Cancellous | 320.5±69 | 486.7±79 | 491.7±76 | 423.9±84 | 9±83 | 162.0±49 | * | |
| L. cortical | 739.1±130 | 1,350.5±94 | 1,262.4±241 | 1,095.2±149 | 1,112.6±98 | 771.9±51 | * |
Table 5.
Statistical analysis of bone density in each site (hounsfield unit, mean±standard deviation)
| Incisor | Canine | Premolar | Molar | P-value | ||
|---|---|---|---|---|---|---|
| 11–20 | B. cortical | 630.9±64 | 603.9±84 | 608.0±73 | 700.2±91 | * |
| Cancellous | 354.9±66 | 390.7±69 | 347.9±66 | 320.5±69 | * | |
| L. cortical | 653.1±58 | 678.1±98 | 712.2±109 | 739.1±130 | * | |
| 21–30 | B. cortical | 825.3±89 | 1,050.5±67 | 1,149.7±88 | 1,336.6±94 | * |
| Cancellous | 473.4±75 | 508.2±59 | 503.9±95 | 486.7±79 | * | |
| L. cortical | 863.4±84 | 1,118.7±83 | 1,241.1±160 | 1,350.5±94 | * | |
| 31–40 | B. cortical | 825.8±97 | 858.7±69 | 955.7±71 | 1,346.3±135 | * |
| Cancellous | 498.3±95 | 499.2±99 | 497.9±68 | 491.7±76 | NS | |
| L. cortical | 817.4±89 | 1,027.0±79 | 1,035.5±95 | 1,262.4±241 | * | |
| 41–50 | B. cortical | 805.2±73 | 845.1±59 | 1,019.8±68 | 1,179.1±113 | * |
| Cancellous | 439.6±95 | 431.1±79 | 433.9±87 | 423.9±84 | NS | |
| L. cortical | 807.9±99 | 827.8±73 | 1,066.1±66 | 1,095.2±149 | * | |
| 51–60 | B. cortical | 696.1±86 | 714.9±107 | 889.6±98 | 1,081.6±134 | * |
| Cancellous | 388.0±95 | 391.7±95 | 359.1±68 | 340.9±83 | * | |
| L. cortical | 696.8±92 | 726.3±68 | 1,117.2±121 | 1,112.6±98 | * | |
| 61–70 | B. cortical | 614.8±55 | 617.3±62 | 698.7±65 | 865.5±67 | * |
| Cancellous | 184.4±29 | 172.4±48 | 162.4±30 | 162.0±49 | * | |
| L. cortical | 592.5±86 | 594.3±37 | 670.9±81 | 771.9±51 | * |


 PDF
PDF ePub
ePub Citation
 Print
Print


 XML Download