Abstract
Introduction
A cyst is a closed pathologic sac containing fluid or semi-solid material in central region. The most common conventional treatment for a cyst is enucleation. It was reported that spontaneous bone healing could be accomplished without bone grafting. We are trying to evaluate bone reconstruction ability by analyzing panorama radiograph and computed tomography (CT) scan with retrograde studying after cyst enucleation. In this way we are estimating critical size defect for spontaneous healing without bone graft.
Materials and Methods
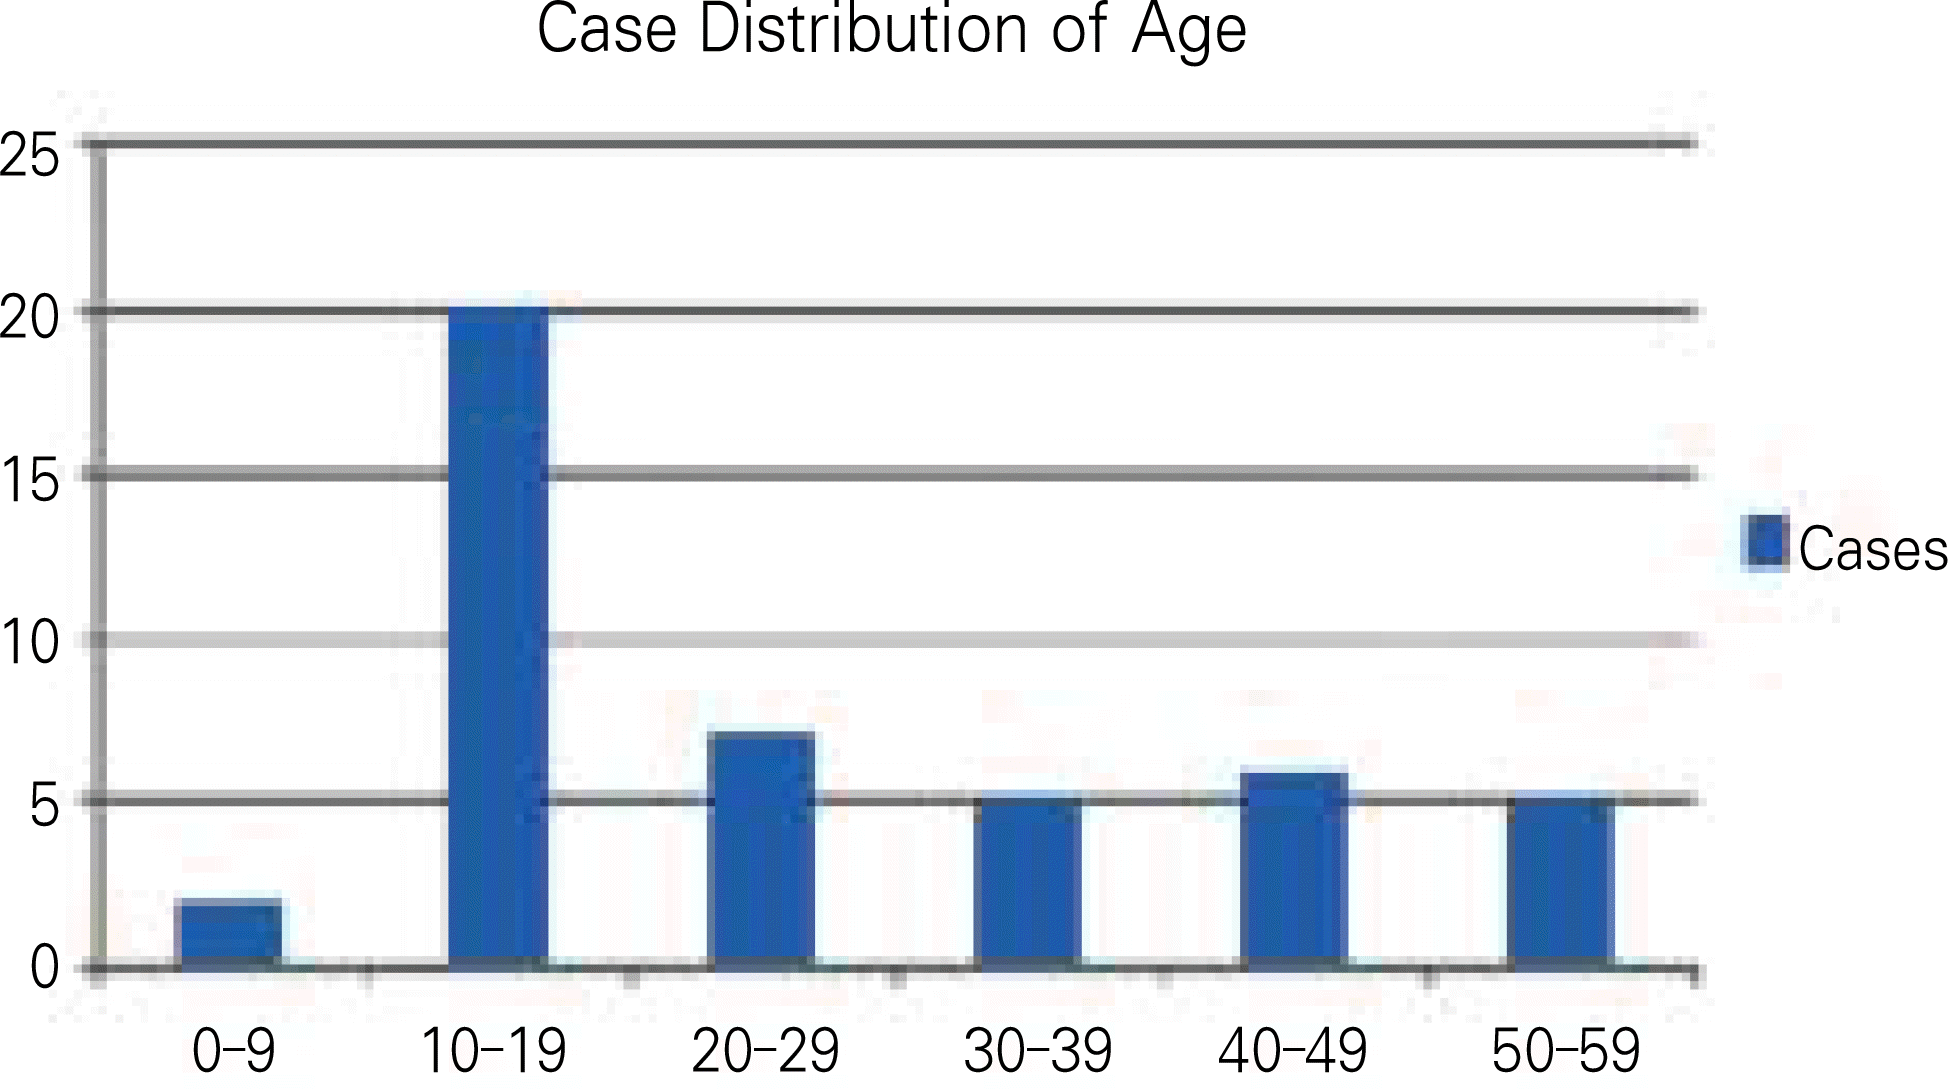
The study comprised of 45 patients who were diagnosed as cysts and implemented enucleation treatment without bone graft. After radiograph photo taking ante and post surgery for 6, 12, 18, 24 months, the healing surface and volumetric changes were calculated.
Results
1. Spontaneous bone healing was accomplished clinically satisfying 12 months later after surgery. But analyzing CT scan, defect volume changes indicate 79.24% which imply incomplete bone healing of defect area. 2. Comparing volume changes of defect area of CT scan, there are statistical significance between under 5,000 mm3 and over 5,000 mm3. The defect volume of 5,000 mm3 shows 2.79×1.91 cm in panoramic view.
References
1. Korean association of oral and maxillofacial surgeons. Textbook of oral & maxillofacial surgery. 1st ed.Seoul: Dental & Medical Publishing Co.;1998.
2. Saap JP, Eversole LR, Wysocki GP. Contemporary oral and maxillofacial pathology. St Louis: Mosby;1997.
3. Peterson LJ, Ellis E III, Hupp JR, Tucker MR. Contemporary oral and maxillofacial surgery. 3rd ed.St. Louis: Mosby;1998.
4. Bodner L, Bar-Ziv J. Characteristics of bone formation following marsupialization of jaw cysts. Dentomaxillofacl Radiol. 1998; 27:166–71.

5. Thomas EH. Cysts of the jaws: saving involved vital teeth by tube drainage. J Oral Surg (Chic). 1947; 5:1–9.
6. Chiapasco M, Rossi A, Motta JJ, Crescentini M. Spontaneous bone regeneration after enucleation of large mandibular cysts: a radiographic computed analysis of 27 consecutive cases. J Oral Maxillofac Surg. 2000; 58:942–8.

7. Ihan Hren N, Miljavec M. Spontaneous bone healing of the large bone defects in the mandible. Int J Oral Maxillofac Surg. 2008; 37:1111–6.

8. Yim JH, Lee JH. Panoramic analysis about spontaneous bone regeneration after enucleation of jaw cyst. J Korean Assoc Maxillofac Plast Reconstr Surg. 2009; 31:229–36.
9. Santamar l′a J, Garc l′a AM, dxe Vicente JC, Landa S, Lopez-Arranz JS. Bone regeneration after radicular cyst removal with and without guided bone regeneration. Int J Oral Maxillofac Surg. 1998; 27:118–20.
10. van Doorn ME. Enucleation and primary closure of jaw cysts. Int J Oral Surg. 1972; 1:17–25.
11. Schlegel KA, Lang FJ, Donath K, Kulow JT, Wiltfang J. The monocortical critical size bone defect as an alternative experimental model in testing bone substitute materials. Oral Surg Oral Med Oral Pathol Oral Radiol Endod. 2006; 102:7–13.

12. Shapurian T, Damoulis PD, Reiser GM, Griffin TJ, Rand WM. Quantitative evaluation of bone density using the Hounsfield index. Int J Oral Maxillofac Implants. 2006; 21:290–7.
13. McCullough EC. Factors affecting the use of quantitative information from a CT scanner. Radiology. 1977; 124:99–107.

14. Kim CH, Jung JI. Study for hounsfield units in computed tomogram with jaw lesion. J Korea Assoc Oral Maxillofac Surg. 2006; 32:391–6.
15. Huh JY, Choi BH, Kim BY, Lee SH, Zhu SJ, Jung JH. Critical size defect in the canine mandible. Oral Surg Oral Med Oral Pathol Oral Radiol Endod. 2005; 100:296–301.

16. Cha SK, Kim IK, Oh SS, Choi JH, Oh NS, Lim YI, et al. Clinical study of cyst in the jaw. J Koreaa Assoc Oral Maxillofac Surg. 2001; 27:167–73.
Table 1.
Cases of follow-up
Table 2.
Rate of change according to size of the lesion under panoramic view
| Duration | Below 4×3 cm | Above 4×3 cm | P value |
|---|---|---|---|
| 6 months | 65.41±4.44 | 62.79±5.21 | 0.724 |
| 12 months | 96.54±2.29 | 92.67±2.33 | 0.0451 |
| 18 months | 98.86±1.94 | 94.71±2.43 | 0.0311 |
| 24 months | 99.26±1.43 | 96.21±2.16 | 0.0251 |
Table 3.
Rate of change according to size of the lesion under CT
| Duration | Below 8,000 mm3 | Above 8,000 mm3 | P value |
|---|---|---|---|
| 6 months | 55.74±6.42 | 55.38±3.85 | 0.564 |
| 12 months | 79.24±2.69 | 76.1±3.14 | 0.221 |
| 18 months | 90.9±1.42 | 85.93±4.02 | 0.0271 |
| 24 months | 93.65±1.80 | 90.73±1.51 | 0.0091 |
Table 4.
Rate of change according to size of the lesion: comparison of CT and panoramic view
| Duration | Below 4×3 cm | Below 8,000 mm3 | P value |
|---|---|---|---|
| 6 months | 65.41±4.44 | 55.74±6.42 | 0.050 |
| 12 months | 96.54±2.29 | 79.24±2.69 | 0.0111 |
| 18 months | 98.86±1.94 | 90.9±1.42 | 0.0061 |
| 24 months | 99.26±1.43 | 93.65±1.80 | 0.0061 |
Table 5.
Rate of change according to size of the lesion under CT
Table 6.
Rate of change according to size of the lesion under CT
Table 7.
Rate of change according to sex
| Duration | Male | Female | P value |
|---|---|---|---|
| 6 months | 56.03±5.29 | 58.11±3.77 | 0.770 |
| 12 months | 77.36±2.60 | 77.66±4.32 | 0.624 |
| 18 months | 89.9±1.37 | 91.02±1.24 | 0.142 |
| 24 months | 92.47±2.49 | 94.01±1.01 | 0.131 |
Table 8.
Rate of change according to age
Table 9.
Rate of change according to location
| Duration | Maxilla | Mandible | P value |
|---|---|---|---|
| 6 months | 52.66±3.24 | 57.12±4.98 | 0.380 |
| 12 months | 77.95±2.07 | 77.36±3.61 | 0.770 |
| 18 months | 89.66±2.43 | 89.65±2.75 | 0.827 |
| 24 months | 92.27±2.86 | 92.59±2.14 | 0.850 |


 PDF
PDF ePub
ePub Citation
 Print
Print


 XML Download