

 PDF
PDF ePub
ePub Citation
 Print
Print


INTRODUCTION
MATERIALS AND METHODS
RESULTS
Studied sample
Table 1
Group Characteristics and Differences of Patients with LVNC and Controls, as Well as of Cases Suspected of LVNC and Their Controls (Control 2)
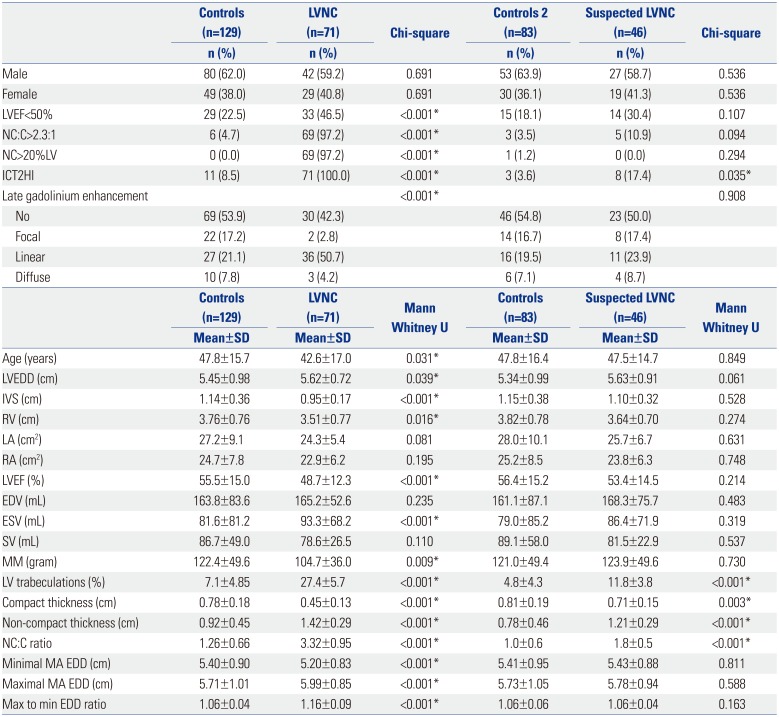
ICT2HI, intracavital T-2-weighted hyperintensity; LVNC, left ventricular non-compaction; LVEF<50%, impairment of left ventricle systolic function; NC:C, non-compact to compact myocardial layer thickness; NC>20%LV, percentage of trabeculations over 20% in total left ventricle mass; LVEDD, left ventricle end diastolic dimension in 4-chamber view; IVS, interventricular septum thickness in 4-chamber view; RV, right ventricle end diastolic dimension in 4-chamber view; LA & RA, left and right atrial area in square centimeters in 4-chamber view; LVEF, left ventricle ejection fraction; EDV, end diastolic volume; ESV, end systolic volume; SV, stroke volume; MM, myocardial mass in end-diastole; MA, mid to apical slices in 6-mm pile stack of short axes; EDD, end diastolic dimension; Max, maximal; Min, minimal. Data shown as numbers and percentages or mean with standard deviations.
*Statistically significant values (p<0.05).
![]()
LVNC diagnostic parameters
Geometry of the left ventricle in LVNC
T2-weighted characterization of studied cases
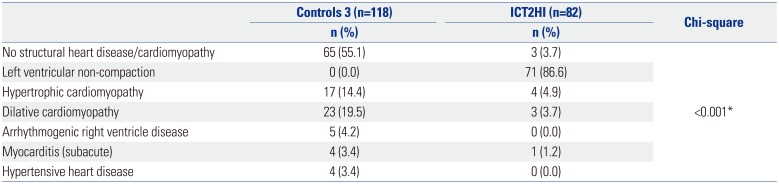
Table 2
Characteristics of Patients with ICT2HI vs. the Control Group without ICT2HI (Control 3)
![]()
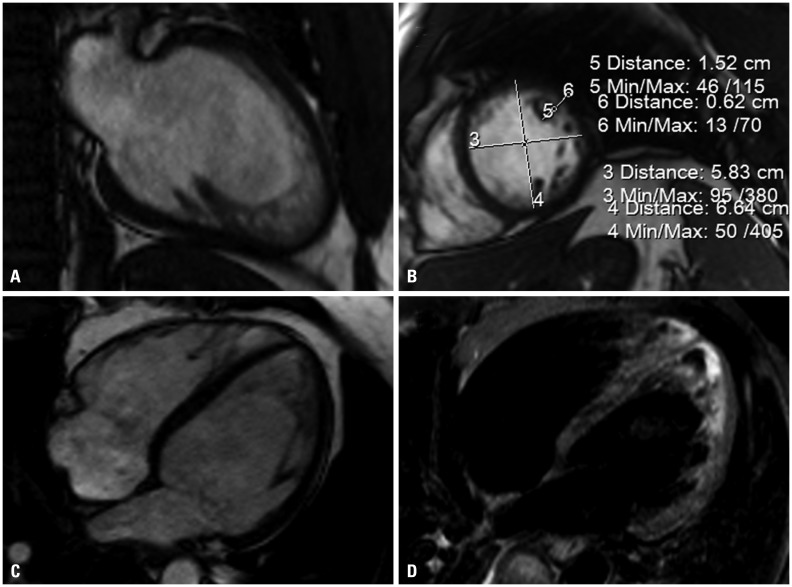 | Fig. 1Case of patient with LVNC. Case of LVNC with trabeculations existing on 23.5% of the left ventricle, left ventricle EDD of 6.29 cm, ejection fraction of 40% and confirmed non-compaction. (A) 2-chamber view, cine SSFP. (B) Short axis cine at end diastolic, marked white line showing: 3) Minimal EDD 5.83 cm, 4) Maximal EDD 6.64 cm, giving MaxMinEDDR=1.14; 5) NC-layer thickness 1.63 cm, and 6) C-layer thickness 0.42 cm, with NC:C=3.9; 4-chamber, cine SSFP. (C) 4-chamber, cine SSFP; showing trabeculations in apical region and lateral wall. (D) 4-chamber, turbo spin echo dark blood T2 fat saturation. Blood flow through non-compact layer is shown as hyperintense T2 signal, or the intracavital T-2 weighted hyperintensity, which is of high spontaneous contrast to the compact part of the myocardium and to endocavital space. LVNC, left ventricular non-compaction; EDD, end diastolic dimension; SSFP, steady state free precession.
|
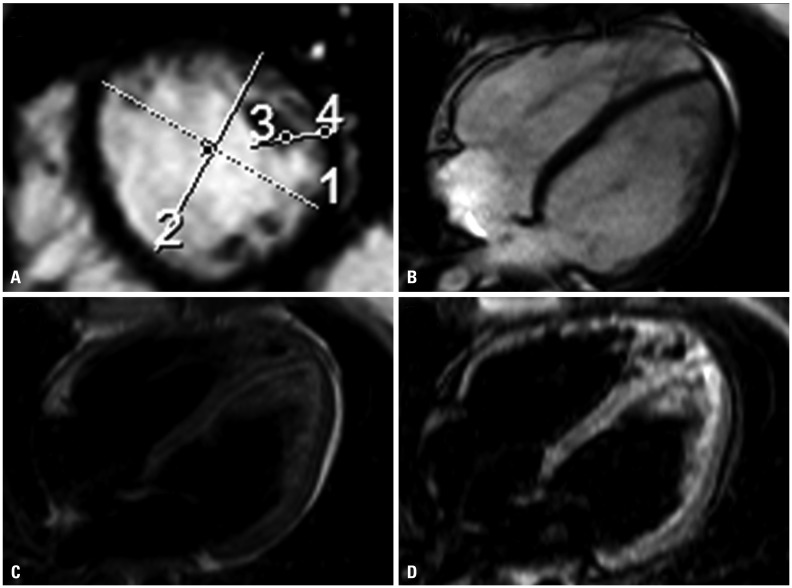 | Fig. 2Case two of LVNC. Case of LVNC with trabeculations existing on 23.5% of the left ventricle, ejection fraction of 50% and confirmed non-compaction. (A) short axis cine at end diastole, marked white line showing: 1) Maximal EDD 5.33 cm, 2) Minimal EDD 4.79 cm, giving MaxMinEDDR=1.11; 3) NC-layer thickness 1.63 cm, and 4) C-layer thickness 0.42 cm, with NC:C=3.9. (B) 4-chamber, cine steady state free precession, showing non-compact myocardium in apical and lateral wall. (C) 4-chamber turbo spin echo dark blood T2, showing intracavital hyperintense T2 signal. (D) 4-chamber, inversion recovery dark blood T2, showing intracavital hyperintense T2 signal. Blood flow through non-compact myocardium is shown as hyperintense T2 signal, i.e. ICT2HI, which is of high spontaneous contrast to the compact part of the myocardium and to endocavital space. ICT2HI, intracavital T2-weighted hyperintensity; MaxMinEDDR, maximal to minimal (perpendicular) end diastolic dimension ratio acquired in mid to apical short axis slices; NC:C, non-compact to compact myocardial layer thickness; NC>20%LV, percentage of trabeculations over 20% of total mass of the left ventricle. LVNC, left ventricular non-compaction; EDD, end diastolic dimension.
|
Receiver operating characteristic curve analysis of LVNC diagnostic parameters
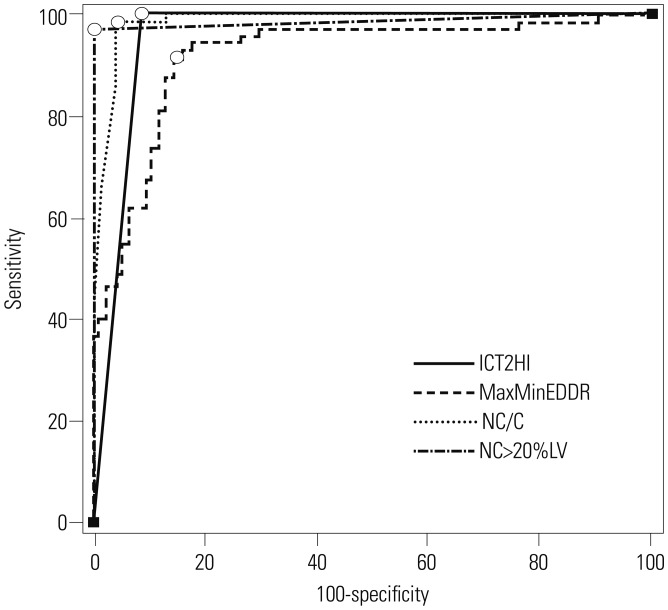 | Fig. 3Multiple receiver operating characteristic curve analysis for studied left ventricular non-compaction diagnostic parameters. ICT2HI, intracavital T-2 weighted hyperintensity; MaxMinEDDR, maximal to minimal end diastolic dimension ratio; NC/C, non-compact to compact myocardial layer thickness; NC<20%LV, percentage of trabeculations over 20% in total left ventricle mass. ◯ - ROC curve values with the highest Youden's Index.
|
 XML Download