

 PDF
PDF ePub
ePub Citation
 Print
Print


INTRODUCTION
Natural killer (NK) cells are large granular lymphocytes that play important roles in innate immunity, as they possess the ability to recognize and eliminate virus-infected and neoplastic cells.1 Several studies have reported that low NK cell activity is associated with an increased cancer risk, suggesting a role in natural host defense mechanisms against cancer.2345
Since increased physical activity levels improve survival rates in some neoplastic diseases and elevated NK-cell numbers in tumor tissues are associated with a better prognosis, NK cells can potentially explain the positive effects of exercise on cancer patient survival.678 Moreover, exercise-induced enrichment of NK cells may be used in isolating these cells for further immunotherapeutic strategies.9 However, even though several studies have reported on the effects of exercise on NK cell cytotoxicity, their results were inconsistent and most of the studies had small sample sizes of less than 50 subjects.7
Meanwhile, some researchers have shown decreased NK cell activity in metabolically unhealthy, obese individuals, and suggested that the immune system is involved in the different metabolic statuses of healthy and unhealthy obese individuals.101112 However, previous studies on this topic also employed small sample sizes, and the link between different metabolic phenotypes and immunity still remains unclear.
Established methods that measure NK cell activity, such as the Chromium 51 (51Cr) release assay and CD107a degranulation assay, have been commonly used to determine NK cell function; however, these methods are complicated and time-consuming, as they require isolation of peripheral blood mononuclear cells (PBMC) or NK cells.13 Owing to these difficulties in measuring NK cell activity, large-scale data on the relationships between physical activity (high or low) and metabolic status (healthy or unhealthy) in relation to NK cell activity are currently unavailable. To overcome these difficulties, a relatively simple assay that utilizes whole blood instead of PBMC or isolated NK cells was recently developed for commercial use to measure the activity of NK cells (NK Vue® Kit, ATGen, Seongnam, Korea).314 This novel assay employs the serum of ex vivo-stimulated whole blood to detect secreted interferon(IFN)-γ from NK cells as an indicator of NK cell activity.314 We aimed to evaluate associations for physical activity and metabolic healthy status in relation to NK cell activity in a large sample of asymptomatic examinees using this novel and relatively simple blood test.
MATERIALS AND METHODS
Study population
The Kangbuk Samsung Health Study is a cohort study of South Korean men and women, aged 18 years or older, who underwent a comprehensive annual or biennial health examination at the Kangbuk Samsung Hospital Total Healthcare Center in Seoul and Suwon, South Korea. The study population consisted of a subset of Kangbuk Samsung Health Study participants who underwent an NK cell activity test from January 2016 to May 2017. In South Korea, the Industrial Safety and Health Law requires annual or biennial health screening examinations for all employees, which are offered free of charge. Approximately 80% of the participants were employees or their spouses of various companies and local governmental organizations; the remaining participants volunteered for the screening examinations.
The exclusion criteria included having a history of cancer, inflammatory bowel disease, autoimmune disorders, and known hepatitis B or C infections, as well as prescription use of immunosuppressive drugs, corticosteroids, and antibiotics within the last month, all of which may impact NK cell activity. Participants with missing physical activity data were also excluded.
This study was approved by the Institutional Review Board of Kangbuk Samsung Hospital (IRB No. KBSMC 2017-06-007), and the requirement for informed consent was waived since only de-identified data were retrospectively assessed.
Measurement and definition of variables
Data on medical history and health-related behavior were collected through self-administered questionnaires. Physical measurements and serum biochemical parameters were measured by trained staff. The self-reported use of medication on a regular basis over the last month was assessed through self-administered questionnaires. Body mass index (BMI) was classified into the following three groups according to cut-off points for public health action, <18.5 kg/m2 (underweight), 18.5–27.5 kg/m2 (normal or overweight; low to moderate risk), and ≥27.5 kg/m2 (obese; high risk).15
Physical activity levels were assessed using the validated Korean version of the International Physical Activity Questionnaire Short Form (IPAQ-SF).161718 IPAQ-SF measures the frequency and duration of any walking and other moderate to vigorous physical activity undertaken for more than 10 continuous minutes across all contexts (i.e., work, home, and leisure) during a seven-day period. IPAQ-SF enables the calculation of metabolic equivalents (MET-minutes per week) derived by assigning standardized MET values of 3.3, 4, and 8 for walking, moderate intensity, and vigorous intensity, respectively. Physical activity levels were classified into three categories, inactive, minimally active, and health-enhancing physically active (HEPA). These categories were derived from the following established criteria: inactive, which meets neither minimally active nor HEPA criteria; minimally active, which meets any of the following three criteria, 1) three or more days of vigorous activity for ≥20 min/day, 2) five or more days of moderate intensity activity or walking for ≥30 min/day, or 3) five or more days of any combination of walking and moderate intensity or vigorous intensity activities achieving ≥600 MET-min/week; and HEPA, which meets one of either of the following two criteria, 1) vigorous intensity activity on three or more days per week accumulating ≥1500 MET-min/week or 2) seven days of any combination of walking, moderate intensity, or vigorous intensity activities achieving at least 3000 MET-min/week.161718
NK cell activity measurement
NK cell activity was measured using a recently developed blood test (NK Vue® Kit, ATGen). A 1-mL sample of whole blood, drawn using a direct vacutainer system from a new venipuncture point, was directly transferred into a specific tube for NK cell activity tests. The blood collection tube for assessing NK cell activity contains a patented stimulatory cytokine (Promoca™, ATGen). The collection tube was gently and repeatedly mixed; within 30 minutes of collection, the tube was incubated for 20–24 hours in a 37℃ chamber, according to the manufacturer's instructions. During the incubation period, the stimulatory cytokine results in the secretion of IFN-γ into the plasma; this secretion predominantly occurs by NK cells rather than by other innate or adaptive immune cells.14
Following incubation, the supernatant was collected and centrifuged at 3000×g for 3 minutes. The supernatant was immediately loaded onto enzyme-linked immunosorbent assay (ELISA) plates. Using a designed ELISA, IFN-γ levels were quantitated and expressed in pg/mL.
Statistical analysis
Continuous variables are presented as the mean±standard deviation or median [interquartile range (IQR)], while categorical variables are presented as frequencies and percentages. Comparison of baseline characteristics according to physical activity levels was performed using one-way ANOVA for continuous variables and the chi-square test for categorical variables. Comparison of NK cell activity levels according to physical activity levels and metabolic status was performed using the non-parametric Mann-Whitney U test or Kruskal-Wallis test. Comparison between the proportion of participants with low vs. high NK cell activity levels (<1500 pg/mL vs. ≥1500 pg/mL), according to physical activity levels and metabolic status, was performed using logistic regression analysis. Variables that were significant in univariable analysis were included in multivariable logistic regression models. All reported p-values were two-tailed, and p-values <0.05 were considered statistically significant. SPSS software (version 18; SPSS Inc., Chicago, IL, USA) was used for statistical analyses.
RESULTS
Baseline characteristics of the study population
We reviewed the medical records of 13595 participants that had undergone NK cell activity tests. Of these, 972 were excluded due to a history of cancer (n=488), inflammatory bowel disease (n=68), autoimmune disorders (systemic lupus erythematosus, n=6), hepatitis B infection (n=394), and hepatitis C infection (n=16). Additionally, 356 participants were excluded due to the use of immunosuppressive drugs (n=25), corticosteroids (n=28), and antibiotics (n=303) within the last month. After excluding 253 participants with missing physical activity data, 12014 participants were finally analyzed.
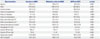
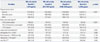
Baseline characteristics of the study participants regarding the categories of physical activity levels are presented in Table 1. The mean age of the study participants was 39.1±7.7 years, and the proportion of males was 60.1%. The proportions of inactive, minimally active, and HEPA individuals comprised 40.0% (n=4807), 49.4% (n=5940), and 10.5% (n=1267), respectively.
The mean age and the proportion of males and current smokers, as well as the prevalence of hypertension, diabetes, and dyslipidemia, were higher in the HEPA and minimally active groups than in the inactive group. BMI, waist circumference, fasting blood glucose, and blood pressure (BP) were also higher in the HEPA and minimally active groups than in the inactive group.
NK cell activity according to physical activity levels and metabolic status
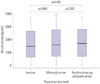
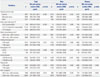
The median level of NK cell activity for all participants was 1548 pg/mL (IQR, 673–2726 pg/mL). Table 2 shows the median levels of NK cell activity stratified according to physical activity levels and metabolic status. The HEPA group showed higher NK cell activity than the inactive group (1712 vs. 1461 pg/mL; p=0.001). The minimally active group also exhibited higher NK cell activity than the inactive group (1592 vs. 1461 pg/mL; p<0.001) (Fig. 1).
The median level of NK cell activity was significantly lower in participants with a BMI <18.5 kg/m2 (1099 pg/mL) than in participants with a BMI of 18.5–27.5 (1572 pg/mL; p<0.001) and ≥27.5 kg/m2 (1648 pg/mL; p<0.001). There was no significant difference in the levels of NK cell activity between participants with a BMI of 18.5–27.5 and ≥27.5 kg/m2 (p=0.400). Participants with higher levels of hemoglobin A1c (≥6.5%; 1261 pg/mL) and lower levels of high-density lipoprotein cholesterol (HDL-C, <40 mg/dL in men and <50 mg/dL in women; 1426 pg/mL) had lower median levels of NK cell activity than those with lower hemoglobin A1c levels (1555 pg/mL; p=0.006), and higher HDL-C (1571 pg/mL; p=0.014).
We then compared median levels of NK cell activity according to physical activity and metabolic status for men and women separately (Table 2). In men, participants with higher levels of hemoglobin A1c (≥6.5%; 1450 pg/mL) and higher BP (≥130/85 mm Hg; 1510 pg/mL) had lower median levels of NK cell activity than those with lower hemoglobin A1c levels (1731 pg/mL; p=0.021) and lower BP (1755 pg/mL; p<0.001).
In women, the minimally active group had higher NK cell activity than the inactive group (1362 pg/mL vs. 1264 pg/mL; p=0.030), and the HEPA group also tended to have higher NK cell activity than the inactive group (1432 pg/mL vs. 1264 pg/mL; p=0.054). The median level of NK cell activity was significantly lower in women with a BMI <18.5 kg/m2 than in women with a BMI of 18.5–27.5 kg/m2 (1024 pg/mL vs. 1356 pg/mL; p<0.001), and also tended to be lower in women with a BMI of ≥27.5 kg/m2 than in women with a BMI of 18.5–27.5 kg/m2 (1119 pg/mL vs. 1356 pg/mL; p=0.070). Moreover, women with a BMI ≥30 kg/m2 (n=107) had significantly lower NK cell activity than those with a BMI of 18.5–27.5 kg/m2 (1024 pg/mL vs. 1356 pg/mL, p=0.012). Women with a BMI ≥35 kg/m2 (n=18) also showed lower NK cell activity, compared with those with a BMI of 18.5–27.5 kg/m2, although the difference was not statistically significant (827 pg/mL vs. 1356 pg/mL, p=0.237). Women with high levels of fasting blood glucose (≥100 mg/dL; 1138 pg/mL), hemoglobin A1c (≥6.5%; 679 pg/mL), and triglyceride (≥150 mg/dL; 1215 pg/mL) and low levels of HDL-C (<50 mg/dL; 1157 pg/mL) showed lower levels of NK cell activity than those with low levels of fasting blood glucose (1341 pg/mL; p=0.002), hemoglobin A1c (1329 pg/mL; p=0.002), and triglyceride (1329 pg/mL; p=0.046) and high HDL-C levels (1343 pg/mL; p=0.003).
Associations for physical activity levels and metabolic status with NK cell activity
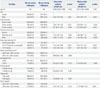
The median level of NK cell activity for all participants was 1548 pg/mL; thus, we compared physical activity levels and metabolic status based on “1500 pg/mL” for convenience (Table 3). The proportion of participants with high NK cell activity (≥1500 pg/mL) was higher in the minimally active group [odds ratio (OR), 1.13; 95% confidence interval (CI), 1.05–1.22; p=0.002] and HEPA group (OR, 1.26; 95% CI, 1.11–1.42; p<0.001) than in the inactive group. NK cell activity was also higher in participants with a BMI of 18.5–27.5 (OR, 1.74; 95% CI, 1.45–2.08; p<0.001) and ≥27.5 kg/m2 (OR, 1.83; 95% CI, 1.49–2.24; p<0.001) than in those with a BMI <18.5 kg/m2. Participants with higher levels of hemoglobin A1c (OR, 0.74; 95% CI, 0.57–0.95; p=0.019) were more likely to exhibit low NK cell activity levels. Participants with higher levels of HDL-C were more likely to exhibit high NK cell activity levels (OR, 1.16; 95% CI, 1.04–1.31; p=0.010). After adjusting for variables that were significant in univariable analysis (age, sex, smoking status, physical activity level, BMI, hemoglobin A1c, and HDL-C), the correlation between physical activity level and metabolic factors (including BMI, hemoglobin A1c, and HDL-C) with NK cell activity remained significant.
We also assessed physical activity level and metabolic status by quartiles of NK cell activity (Table 4). The proportions of the inactive group, underweight participants, and participants with high levels of hemoglobin A1c and low levels of HDL-C decreased linearly with increasing quartiles of NK cell activity.
DISCUSSION
In this large-scale study that included 12014 asymptomatic participants, we found that NK cell activity differed depending on physical activity and metabolic status. Minimally active and HEPA groups showed higher NK cell activity, compared with the inactive group. BMI <18.5 kg/m2 (underweight), high levels of hemoglobin A1c, and low levels of HDL-C were associated with lower NK cell activity. Additionally, high BP in men and BMI ≥30 kg/m2 and high levels of triglyceride in women were associated with lower NK cell activity. Moreover, the association between physical inactivity and unhealthy metabolic status with low NK cell activity (<1500 pg/mL) was significant, even after adjusting for age, sex, smoking status, and metabolic factors.
Since 1968, the 'gold standard' assay for NK cell activity has been the 51Cr release assay. However, the 51Cr release assay has several important limitations, such as manipulation of hazardous radioactivity, isotope short half-life, high cost, and interlaboratory variability.13 Use of fluorescent dyes instead of radioactivity is an alternative method; however, this method is also complicated and time-consuming because it requires isolation of PBMCs and incubation with a target cell line.13 In contrast, the NK Vue® Kit (ATGen) is simple, easy, takes less time, and requires only a 1-mL sample of whole blood. After incubation of 1 mL of whole blood with a patented stabilized cytokine for 20–24 hours, a dedicated ELISA assay quantitates the amount of IFN-γ secreted into the plasma by both the cytotoxic and immunoregulatory subsets of NK cells (CD56dim and CD56bright, respectively).314 Therefore, measurement of ex vivo cytokine-induced secretion of IFN-γ provides a more realistic reflection of in vivo NK cell activity than the 51Cr release assay.3 Recently, this NK cell activity test has been validated by confirming the expected difference in NK cell activity between some types of cancer patients and healthy controls. Several studies have reported that the sensitivity and specificity of the NK cell activity test for colorectal cancer (cut-off value 181 pg/mL) were 87% and 61%, respectively; those for gastric cancer (cut-off value 438 pg/mL) were 67% and 92%, respectively; and those for prostate cancer (cut-off value 531 pg/mL) were 72% and 74%, respectively.3419 However, data on the relationship between physical activity and metabolic status with NK cell activity are limited. Using this simple test, we were able to conduct a large-scale study to determine if NK cell activity differs according to physical activity and metabolic status.
Several studies have reported the effects of exercise on NK cell cytotoxicity.2021222324 Nieman, et al.20 demonstrated higher NK cell cytotoxicity in marathon runners than in sedentary controls, and Moro-Garcia, et al.21 also showed higher NK cell cytotoxicity in athletes, compared with non-athletes. A Japanese study revealed that exercise carried out three or four times a week was associated with an increase in NK cell activity.22 Another study reported elevated NK cell cytotoxicity in trained subjects in comparison with sedentary controls.23 Moreover, a randomly controlled 15-week exercise training (ET) study demonstrated that moderate ET is associated with elevated NK cell activity.24 In line with these results, we also found that increased physical activity was associated with higher NK cell activity. Although the mechanisms behind the effects of exercise on NK cell activity have not been elucidated, the role of glucocorticoids, catecholamines, and prostaglandins have been proposed as potential mediators of these effects.7
Some studies have reported that increased physical activity levels are associated with improved survival rates for different cancers and that elevated NK-cell numbers in tumor tissues are associated with a better prognosis.678 The enhanced role of NK cells may be responsible for explaining the positive effects of exercise on cancer patient survival.78 Our study included healthy participants without a history of cancer and demonstrated that physical activity improved NK cell activity, even in healthy individuals. Further longitudinal studies are needed to determine if increased NK cell activity due to increased physical activity in healthy individuals has a protective effect against cancer.
Another finding in our study is that both obese and underweight women have impaired NK cell activity. Women with a BMI <18.5 kg/m2, as well as those with a BMI ≥30 kg/m2, showed lower levels of NK cell activity than women with a BMI of 18.5–27.5 kg/m2. Previous animal studies have demonstrated the relationship between obesity and NK cells.1112252627 Ohmura, et al.25 showed that NK cells play a crucial role in the development of adipose tissue inflammation and glucose intolerance in diet-induced obese mice. Martin-Murphy, et al.26 revealed that mice lacking NK cells were more susceptible to weight gain and fatty livers following high-fat diets, and suggested that NK cells have an important role in preventing diet-induced obesity and metabolic dysfunction. Additionally, obesity was reported to compromise NK cell function in humans.111227 Excessive body fat elevates circulating adipokine levels, which can affect immune responses and functions.28 Moreover, NK cell functionality can be modulated by adipokines.2930 Long-term exposure to leptin, such as that seen in obese individuals with elevated serum leptin levels, impairs NK cell immune functions.30 Interestingly, we found that underweight individuals were also associated with reduced NK cell activity. To the best of our knowledge, this is the first study to demonstrate that being underweight can impair NK cell activity. Several studies have reported that being underweight is a poor prognostic factor in patients with cancer and is accompanied by increased host inflammation and decreased immunity;3132 these results may be related to NK cell activity. Further studies are needed to elucidate the mechanism linking underweight individuals with impaired NK cell activity.
In the present study, unhealthy metabolic status (high levels of hemoglobin A1c, high BP, high triglyceride levels, and low HDL-C levels) was correlated with decreased NK cell activity. Similar to our results, some studies have reported a relationship between unhealthy metabolic status and reduced NK cell activity.101112 Kim, et al.10 showed that a metabolically unhealthy overweight group (higher BP and higher serum levels of triglyceride, glucose, glucose-related markers, and lower levels of HDL-C) had lower NK cell activity than a metabolically healthy overweight group. Lynch, et al.11 also reported that healthy obese patients had higher levels of NK cells, compared with unhealthy obese patients, and had similar NK cell levels to lean healthy controls. Another recent study demonstrated that obese individuals, as well as non-obese individuals with metabolic abnormalities, exhibit reduced proportions of invariant NK T cells.12 Moreover, in diabetic obese mice, cancer metastasis was associated with decreased NK cell function.33 The results of previous studies and our current study suggest that unhealthy metabolic status may result in an unfavorable immune system with lower NK cell activity. In addition, decreased activity of NK cells may have a significant role in visceral fat accumulation and insulin resistance.
To our knowledge, this is the largest study to identify an association between physical activity and metabolic status with NK cell activity. Nevertheless, the current study has several limitations. First, most of the participants comprised employees (and/or their spouses) of various companies and local governmental organizations; therefore, there was a potential selection bias, as most participants had a middle- or upper-class socioeconomic background. Second, other potential limitations of our study include its retrospective nature without measuring other cytokines, as well as the lack of elucidation on the mechanism by which physical activity and metabolic status affects NK cell activity. Third, allergic diseases (such as asthma, rhinitis, or atopic dermatitis), which could affect IFN-γ production by NK cells, were not considered. Finally, the cross-sectional design precludes the determination of causality of the relationship between decreased NK cell activity and metabolic disorders. Further clinical trials are warranted to determine if exercise and improved metabolic health through lifestyle modifications increase NK cell activity.
Despite these limitations, our results provide a better understanding of the relationship between physical activity and metabolic status with human NK cell activity. Physically inactive subjects exhibited lower NK cell activity, compared with physically active subjects. Subjects with high levels of hemoglobin A1c and low levels of HDL-C showed lower NK cell activity. Additionally, obese and underweight women showed lower NK cell activity. Our study indicates that physical inactivity and unhealthy metabolic status are associated with decreased NK cell activity. These results suggest that the immune system may be altered in relation to physical activity and metabolic health.
 XML Download