

 PDF
PDF ePub
ePub Citation
 Print
Print


INTRODUCTION
Standard liver volume (SLV) needs to be estimated with high accuracy for a recipient to determine a proper graft size for safety in living donor liver translation. The recommended ratio of graft volume to SLV ranges from 30% to 40%123 to satisfy the hepatic metabolic demand of a recipient. A small-for-size graft for a large recipient can cause small-for-size syndromes,4567891011 such as low graft survival due to enhanced parenchymal cell injury and reduced metabolic and synthetic capacity.6 On the other hand, a large-for-size graft to a small recipient can cause large-for-size syndromes,612 such as vascular complications, immunological impairments, and respiratory failure.
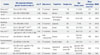
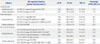
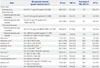
SLV estimation formulas have been established using anthropometric variables of age, gender, body weight (BW, kg), body height (BH, cm), body surface area (BSA, m2), and thoracic width (TW, cm). As shown in Table 1, three types of liver volumetry, including autopsy, CT, and graft measurement, have been employed in SLV estimation. Note that a graft measurement is used to estimate the corresponding liver volume by dividing the intraoperative graft volume by a preoperatively measured graft proportion using CT volumetry. Table 1 shows that autopsy-based formulas tend to overestimate SLV [average percentage error (APE)=8.2% to 10.1%], while graft measurement-based formulas do the opposite (APE=−19.6%). The tendency for SLV overestimation with autopsy-based formulas can be attributed to inclusion of adjacent body structures, such as the gallbladder, ligaments, and vessels attached to the liver,20 while the tendency for SLV underestimation with graft measurement-based formulas relies on the difference between the graft proportion calculated using preoperative CT volumetry and the corresponding intraoperative graft proportion. Lastly, Kokudo, et al.21 reported TW is significant in SLV estimation for accuracy: the SLV formula including TW shows the least root mean square error in Table 1.
Use of gender-balanced data, CT liver volume data without including blood volume, body composition, and/or abdominal geometry measurements can contribute to the accuracy of SLV estimation. Gender-unbalanced measurements and LV measurements including blood volume have been commonly used in existing SLV formula studies: use of gender-balanced measurements and LV measurements without including blood volume has not been attempted in SLV estimation studies. Furthermore, few studies have been conducted on the relationships of body composition and abdominal geometry variables with SLV. The body composition variables include skeletal muscle mass (SMM, kg), fat mass (FM, kg), body fat percentage (BFP), and abdominal fat percentage (AFP), while abdominal geometry variables comprise waist circumference (WC, cm), subcutaneous fat area (SFA, cm2) at the waist, and visceral fat area (VFA, cm2) at the waist.
The present study was attempted to develop SLV estimation formulas with better accuracy using measurements of anthropometric variables, body composition variables, and abdominal geometry variables. The proposed formulas in the present study were compared with existing formulas in terms of absolute error (AE, mL), percentage of absolute error (PAE, %), and percentage of PAE >20%. Blood volume was excluded from liver volumetry in the present study for better accuracy in SLV estimation.
MATERIALS AND METHODS
Data collection
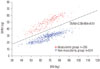
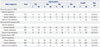
The present study used 790 cases (263 females and 527 males; age=50.9±9.0) of normal livers collected between January 2009 to December 2013 from Chonbuk National University Medical School for regression analysis and cross validation. The data were classified into two groups (266 cases in muscularity group and 524 cases in non-muscularity group) referring to the plot of SMM to BW as shown in Fig. 1 using the linear support vector machines classification method.23 Various data subsets were formed from the original data set as summarized in Table 2 by considering muscularity category, gender balance, and data use for model development and model cross-validation. The total liver volume (TLV) of each case was calculated from corresponding abdominal CT images. Three groups of variables were considered in the SLV estimation model development in the present study: 1) demographic and anthropometric variables, including age, gender (female=0 and male=1), BW, BH, BSA, and body mass index (BMI); 2) body composition variables, including SMM, FM, BFP, and AFP; and 3) abdominal geometry variables, including WC, SFA, and VFA. BSA was estimated by Du Bois and Du Bois's equation24: BSA=BW0.425×BH0.725×0.007184. BMI was calculated as weight (kg) divided by height2 (m2). The body composition data were collected using InBody 570 Body Composition Analyzer (InBody Co., LTD, Seoul, Korea). The present study was approved by the Institutional Review Board at Chonbuk National University Hospital (IRB No. 2414-05-012-012).
CT imaging
CT images were obtained using a 128-row multidetector CT scanner SOMATOM Definition AS+ (Siemens, Forchheim, Germany). Potential liver donors fasted more than 6 hours before CT scanning. CT scanning was performed while the donor held a breath at the end of inspiration. After obtaining CT images without a contrast medium, 120 mL to 130 mL of Iopromide Ultravist 370 (Schering, Berlin, Germany) was administered at a flow rate of 3 mL/sec using a mechanical injector, followed by triphasic CT scanning during the arterial, portal, and delayed phases. An automatic bolus-tracking system, CARE Bolus (Siemens), was used to trigger data acquisition after enhancement of the descending aorta reached a thresh-old of 100 Hounsfield units. The scanning and reconstitution parameters were as follows: detector collimation=128×1.5 mm for unenhanced scanning and 128×0.75 mm for enhanced scanning; pitch value (table feed per gantry rotation divided by collimated beam width)=0.6; gantry rotation time=0.5 sec; and slice thickness=3 mm.
CT volumetry
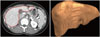
The TLV of each case was measured from abdominal CT images obtained in the delayed phase using the liver segmentation and volumetry functions of Dr. Liver™ (Humanopia, Inc., Pohang, Korea). The liver was extracted (Fig. 2) from CT images based on interactively selected seed points using a hybrid semi-automatic liver segmentation method having an accuracy of 97.6% in CT volumetry.25 Then, blood vessels, including the portal vein and the hepatic vein, in the liver were extracted and excluded from the extracted liver. TLV without the volume of blood vessels was calculated using the summation-ofarea method.26
Abdominal geometry measurement
WC, SFA, and VFA were measured for an umbilicus CT image with an image display window width of −195 to −45 Hounsfield units using the Medical Imaging Interaction Toolkit (MITK)27 and a program developed in the present study using ITK.28 First, abdomen, subcutaneous fat, and visceral fat were extracted (Fig. 3) from the umbilicus CT image using the region growing method, fast-marching level-set method, and 2D editing tools in MITK. Then WC, SFA, and VFA were measured from the extracted abdomen, subcutaneous fat, and visceral fat by the itkLabelImageToShapeLabelMapFilter class in ITK.
Statistical analysis
Regression formulas using gender-balanced and gender-unbalanced data from a muscularity data group, non-muscularity data group, and combined data group were developed in the study. For the combined data set groups, regression analysis using demographic and anthropometric variables (age, gender, BW, BH, BSA, and BMI) was performed. For the other data groups, regression analyses using 1) demographic and anthropometric variables, 2) demographic, anthropometric, and body composition variables (SMM, FM, BFP, and AFP), and 3) demographic, anthropometric, body composition, and abdominal geometry variables (WC, SFA, and VFA) were conducted. For each regression analysis, stepwise regression was performed to identify a subset of variables included in regression models. A residual analysis was conducted to assess the adequacy of fit of a regression model. All statistical analyses were conducted using Minitab v. 14 (Minitab, Inc., State College, PA, USA) at a significance level of 0.05.
RESULTS
Regression models
Use of gender-balanced data and inclusion of body composition and abdominal geometry variables improved the performance in SLV estimation, as shown in Table 3. The performance levels of the SLV estimation formulas using genderbalanced data were improved by 0.06–0.16 for adjusted R2, 0.1–15.9 mL for AE, and 0.2–1.0% for PAE, compared to those of the SLV estimation formulas using gender-unbalanced data. The performance levels of the SLV estimation formulas using additional body composition data and abdominal geometry data were improved by 0.01–0.05 for adjusted R2, 1.1–20.5 mL for AE, and 0.2–1.8% for PAE, compared to those of the SLV estimation formulas using only demographic and anthropometric variables.
Preferred formulas depending on data availability were suggested in the present study, as shown in Table 3. When composition data and abdominal geometry data are not available, the gender-balanced formula SLV=331−4.1×age+41.6×gender+15.3×BW (adj. R2=0.56) is preferred. When body composition data are available, for a patient belonging to the muscularity group, the gender-balanced formula SLV=161−3.6×age−182×gender+27.4×SMM (adj. R2=0.60) is preferred if abdominal geometry data are unavailable, whereas the gender-balanced formula SLV=45−4.3×age−152×gender+24.3×SMM+3.36×WC (adj. R2=0.60) is preferred if abdominal geometry data are available. On the other hand, for a patient belonging to the nonmuscularity group, the gender-balanced formula SLV=−412−4.3×age+13.6×BW−6.0×BFP+1174×AFP (adj. R2=0.58) is preferred if abdominal geometry data are unavailable, whereas the gender-balanced formula SLV=−1063−5.6×age−93.0×gender+11.7×BW−4.9×BFP+1211×AFP+12.9×WC−1.8×SFA (adj. R2=0.62) is preferred if abdominal geometry data are available.
Comparison with existing formulas
The SLV estimation formulas developed in the present study were compared with existing formulas using a validation data set of n=80, consisting of 30 individuals from the muscularity group and 50 from the non-muscularity group. The performance levels of the proposed formulas (average AE=116.2–166.8 mL, average PAE=9.6–12.7%, percentage of PAE >20%=12.0–17.5%) were found overall superior to the existing formulas (average AE=170.8–333.7 mL, average PAE=12.9–28.3%, percentage of PAE >20%=20.0–63.8%), as shown in Table 4.
DISCUSSION
The present study developed formulas of SLV estimation using gender-balanced CT volumetric data, demographic and anthropometric variables (age, gender, BW, BH, BSA, and BMI), body composition data (SMM, FM, BFP, and AFP), and abdominal geometry data (WC, VFA, and SFA) for Korean healthy adults without a history of liver disease. Use of gender-balanced data, body composition data, and abdominal geometry data contributed to accuracy in SLV estimation. Preferred formulas depending on data availability were suggested in the estimated SLV because the SLV formula was established based on a pediatric group with a mean age of 11 years.2029 However, data of the present study did not support the underestimation error of Urata, et al.'s formula13 because the liver volume data of children in the present study.
Use of gender-balanced data and inclusion of body composition and abdominal geometry variables improved the performance in SLV estimation. The performance levels of the SLV estimation formulas using gender-balanced data were improved by 0.06–0.16 for adjusted R2, 0.1–15.9 mL for AE, and 0.2–1.0% for PAE, compared to those of the SLV estimation formulas using gender-unbalanced data. The performance levels of the SLV estimation formulas using additional body composition data and abdominal geometry data were improved by 0.01–0.05 for adjusted R2, 1.1–20.5 mL for AE, and 0.2–1.8% for PAE, compared to those of the SLV estimation formulas using only demographic and anthropometric variables.
The most accurate formula proposed in the present study improved SLV estimation accuracy by 54.6–217.5 mL for AE, 3.3–18.7% for PAE, and 8.0–51.8% for percentage of PAE >20%, compared to the existing formulas. The better accuracy of the proposed formula resulted from 1) use of gender-balanced data, 2) use of body composition data and abdominal geometry data, and 3) exclusion of blood volume from liver volume. Previous studies demonstrated a reduction of liver graft volume measured intraoperatively, compared to that measured preoperatively, due to exclusion of blood from the graft during backtable preparation.2930 Most of the existing formulas, such as those reported by Yuan, et al.,18 Vauthey, et al.,15 and Hashimoto, et al.,16 tend to overestimate SLV (APE=10.0, 19.6, and 6.4%, respectively) because they did not exclude blood volume from liver volume. Formulas reported by Heinemann, et al.14 and Yu, et al.17 showed larger SLV estimation errors, such as average PAE=28.3% and 24.6%, respectively, because their studies were based on autopsy examinations such that other structures (e.g., gallbladder, ligaments, and vessels attached to the liver) were included in liver volume calculation.20 On the other hand, the graft-based formula reported by Fu-Gui, et al.19 tended to underestimate SLV (APE=−9.0%). In the graft measurement study, liver volume was calculated by a back-table right graft volume (blood volume excluded) divided by the right lobe proportion based on CT volumetry. However, the proportion of right lobe based on CT volumetry can differ from that of back-table right graft because a cutting line based on CT volumetry is often different from the corresponding actual surgical cutting line. Previous studies reported that Urata, et al.'s formula13 under-estimated SLV because the SLV formula was established based on a pediatric group with a mean age of 11 years.2029 However, data of the present study did not support the underestimation error of Urata, et al.'s formula13 because the liver volume data of children in Urata, et al.'s study13 could be equivalent to those with blood volume excluded in the present study.
The present study included age to the suggested SLV estimation formulas as a significant variable affecting SLV. Most previous studies did not include age to their formulas because they included mainly young people in their study.21 The present study included cases in their 30s to 60s. Kokudo, et al.21 reported that the difference of SLV among healthy cases in their 20s and 80s can be as large as 200 mL.
The data in the present study were classified into muscularity and non-muscularity groups by a formula of SMM=0.51+0.56×BW according to the plotting of SMM to BW. The performance levels of the SLV estimation formulas (gender-balanced, demographic and anthropometric variables only) using the classified data were improved by 0.01 for adjusted R2, 4.6–30.1 mL for AE, and 1.3% for PAE, compared to that of the SLV estimation (gender-balanced) formula using combined data.
TW was not included into the proposed formulas by stepwise regression analysis in the present study. The performance level of the proposed gender-balanced formula using combined data in the present study was improved by 4.0 mL for AE, 0.3% for PAE, and 2.5% for percentage of PAE >20%, compared to that of Kokudo, et al.'s formula21 which includes TW.

 XML Download