

 PDF
PDF ePub
ePub Citation
 Print
Print


INTRODUCTION
Recent advances in cancer biology have identified a number of biomarkers for the diagnosis and prognosis of cancer.1234 These biomarkers not only can predict the prognosis of patients, but they also can indicate potential responses to treatment, such as radiotherapy (RT), chemotherapy, and surgery. For example, patients who are expected to have a favorable response to RT could avoid excessive toxicities by dose de-escalation; conversely, a dose escalation strategy might be considered for patients who are expected to have a poor response to treatment to improve tumor control.5 Bauman, et al.6 reviewed the literature on radiobiology-associated biomarkers for tumor responses, including cancer stem cell markers, phosphorylated histone H2AX, p16 protein expression, positron emission tomography imaging with [F-18] fluoromisonidazole, and hypoxia-specific gene arrays, related with the mechanisms of radioresistance and radiosensitivity.
Cell-free DNA (cfDNA) has garnered attention as a promising biomarker, since the abnormalities of cfDNA were identified in patients with cancer.2 In addition to the relative ease of quantifying cfDNA levels, the development of next-generation sequencing (NGS) has provided powerful and comprehensive genetic information on cancer, allowing for the application of specific genomic analysis of cfDNA.789 Compared to a traditional invasive biopsy, a "liquid biopsy" including cfDNA may be easier to use and preferable for patients with hepatocellular carcinoma (HCC) because of HCC's rich blood supply and vascular structure, which pose a greater risks for complications with invasive biopsy.10 However, limited reports on the clinical significance of cfDNA in RT are available for non-small cell lung cancer,11 head and neck cancer,12 and pancreatic cancer.13 To our knowledge, no studies have reported the prognostic or predictive value of cfDNA in patients who received RT for HCC. Thus, we investigated the feasibility of quantitative analysis and the clinical significance of cfDNA in patients with HCC treated with RT.
MATERIALS AND METHODS
Patient selection and treatment protocol
A total of 61 patients who received RT for HCC at Yonsei Cancer Center between June 2011 and April 2015 were recruited from two prospective studies.14 One study cohort consisted of patients who underwent conventionally fractionated RT (CFRT), whereas the other cohort consisted of patients who received stereotactic body radiation therapy (SBRT) for HCC. The diagnosis of HCC was based on the American Association for Study of Liver Diseases criteria; tumor, node and metastasis (TNM) staging was classified according to the modified Union for International Cancer Control (mUICC). We excluded patients with insufficient blood samples (n=3), incomplete RT (n=2), and primary tumors other than HCC (n=1). Ultimately, 55 patients with HCC were included. This study protocol conformed to the Declaration of Helsinki of 1975 as revised in 1983, and was approved by the Institutional Review Board of Yonsei University Health System (4-2010-0566 and 4-2011-0650). All 55 patients provided informed consent, and were followed up until February 2017.
At our institution, the best treatment option is determined through multidisciplinary discussion. We selected RT as a local treatment option for patients who had contraindications for surgery, transarterial chemoembolization, or other local treatments. All 55 patients in both prospective cohort studies received RT, either with a definitive or salvage aim. The patients in one study cohort underwent CFRT for relatively large and multiple lesions, whereas those in the other study cohort received SBRT for smaller lesions (<4 cm), solitary lesions, and lesions that were sufficiently distant from critical organs.
The CFRT modality was chosen according to each patient's preference, whereas intensity-modulated RT using a helical tomotherapy device (TomoTherapy, Madison, WI, USA) was the sole modality for the patients who received SBRT. In the CFRT group, a total dose of 45 Gy in 25 fractions was routinely used. If the tumor location was sufficiently distant from dose-limiting organs, a radiation dose of >45 Gy was considered on an individual basis. In case of patients with regional lymph node (LN) metastases, the nodal areas were also included in RT target volume. Concurrent chemotherapy consisted of 5-fluorouracil (500 mg/day for 5 hours on 5 consecutive days through an implanted intra-arterial port system) during the first and last week of RT, followed by adjuvant chemotherapy with hepatic arterial infusion chemotherapy with 5-fluorouracil (500 mg/m2 for 5 hours on 3 consecutive days) and cisplatin (60 mg/m2 for 2 hours on a single day). Surgical excision was considered after RT if the tumor became resectable. In the SBRT group, an ablative dose of 60 Gy in four fractions was adopted; no patients in this group received concurrent or adjuvant chemotherapy. After the scheduled treatment was complete, regular follow-up imaging was conducted every 1–3 months.
Sample collection
Blood (5–10 mL) was collected from the patients before and after RT. In the CFRT group, post-treatment blood sampling was carried out on the day concurrent chemoradiotherapy finished (before the start of following adjuvant chemotherapy), while the sample was collected on the end date of RT in the SBRT group. The blood samples were collected in Vacutainer tubes (BD Biosciences, Franklin Lakes, NJ, USA) containing Ethylenediaminetetraacetic acid (EDTA) using aseptic measures, and were centrifuged at 3000 rpm for 10 min at 4℃ to separate buffy coats and plasma. An additional centrifugation for 10 min was performed to produce cell-free plasma. Plasma aliquots were immediately frozen at −80℃ until cfDNA purification.
Cell-free DNA purification and quantification
The stored plasma samples were thawed at 4℃ and centrifuged at 14000 rpm for 15 min at 4℃ to remove residual precipitated cellular components. The cfDNA was purified using a QIAamp Circulating Nucleic Acid Kit (Qiagen, Valencia, CA, USA) according to the manufacturer's instructions. Briefly, 1 mL of plasma was mixed with 0.1 mL of proteinase K and 0.8 mL of buffer ACL. After incubation at 60℃ for 30 min, 1.8 mL of buffer ACB was added, vortexed, and incubated on ice for 5 min. The mixture was filtered through the column. The bound cfDNA was washed with 600 µL of buffer AW1, 750 µL of buffer AW2, and finally 750 µL of ethanol. To elute the cfDNA, 30 µL of elution buffer AVE was added to the tube and incubated for 3 min at room temperature prior to a final centrifugation at 14000 rpm for 1 min. The concentration of plasma cfDNA was spectrophotometrically evaluated using an ultraviolet-visible spectrophotometer (NanoDrop 2000, Thermo Fisher Scientific Inc., Dreieich, Germany).
Statistical analysis
For categorical variables, a chi-square test was performed, and linear-by-linear association analysis was performed to calculate linear relationships for more than two groups. Student's ttest was used to compare differences in the mean values of continuous variables between the two groups. Area under receiver-operating characteristic (ROC) curve (AUC) was used to determine the optimal cut-off value of plasma cfDNA levels. Progression-free (PF), intrahepatic failure-free (IHFF), and local control (LC) rates were calculated from the date of first RT to the date of first progression: the events were defined as progression to any site for PF rate, as progression within the liver either inside or outside of the RT field for IHFF rate, and as progression inside the RT field for LC rate. Survival rates were estimated using the Kaplan-Meier estimation method. The log-rank test was used to assess survival differences between the groups. A multivariate Cox proportional hazards regression model was used to examine the associated effects of potential prognostic factors found to be significant in univariate analysis. p-values (in two-sided tests) ≤0.05 were considered statistically significant. Statistical analyses were performed using SPSS, version 23 (IBM Corp., Armonk, NY, USA).
RESULTS
Patient and treatment characteristics of the whole cohort
For the entire cohort, HCC was related to hepatitis B virus in 76.4% of cases, hepatitis C virus in 16.4% of cases, and non-viral origins in 7.3% of cases. A total of 30% of patients had multiple tumors, with 77% of them having tumors larger than 2 cm and 31.9% having portal vein tumor thrombus (PVTT) (9.1% in the portal trunk, 20% in first-order branch, and 1.8% in second-order branch). There were no patients with extrahepatic metastatic disease, except for regional LN metastases identified in three patients (5.5%). Thus, 14 patients had mUICC stage I tumors, 13 had mUICC stage II tumors, 14 had mUICC stage III tumors, and 14 had mUICC stage IV tumors.
Of the 55 total patients, 34 patients (61.8%) received CFRT with a median total dose of 46.8 Gy (range: 45–60 Gy) and a median fractionated dose of 1.8 Gy (range: 1.8–3 Gy), whereas 21 patients (38.2%) received SBRT with 60 Gy in four fractions. The median biologically effective dose (BED) was 62.5 Gy (range: 53.1–150 Gy) for the entire cohort. The median BED of the CFRT group was 54.2 Gy (range: 53.1–78 Gy). The BED of SBRT group was the same for all patients at 150 Gy. Concurrent chemoradiotherapy was administered to 28 patients (50.9%) who were treated with CFRT. CFRT was used as first therapy in most of the patients (82.4%), while SBRT was used mainly as salvage therapy (90.5%). With regard to baseline characteristics, the CFRT group tended to have multiple and larger tumors (p=0.007 and p=0.002, respectively), PVTT (p<0.001), advanced stage disease (p<0.001), and higher protein induced by vitamin K absence or antagonist II (PIVKA-II) (p=0.006); meanwhile, more patients in the SBRT group had a history of previous treatment (p<0.001).
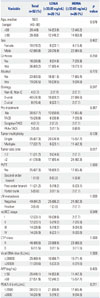
Patient characteristics and clinical features according to pre-RT cfDNA levels
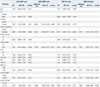
Table 1 shows patient and clinical characteristics according to pre-treatment cfDNA levels. Pre-RT cfDNA levels were available for 52 of 55 patients. A cut-off value of 33.65 ng/mL was obtained using ROC curve analysis (AUC=0.645, sensitivity=0.706, specificity=0.600). Patients were grouped according to their pre-RT cfDNA level, applying the optimal cut-off value of 33.65 ng/mL for low-DNA (LDNA, n=26) and high-DNA (HDNA, n=26) groups. There was no difference in other baseline characteristics, except that the pre-RT HDNA group tended to have larger tumors (p=0.017) and more patients with advanced stage HCC (mUICC stage III–IV) than the pre-RT LDNA group (p=0.049). When comparing the amount of viral titers and tumor markers according to the pre-RT cfDNA levels, preRT viral titers, alpha-fetoprotein (AFP), and PIVKA-II were not significantly different between the pre-RT LDNA group and HDNA group (p=1.000, p=0.405, and p=0.211, respectively) (Table 1).
Treatment response according to post-RT cfDNA levels
The maximal treatment response was assessed according to the modified Response Evaluation Criteria in Solid Tumors.15 Patients who achieved a complete response or partial response were considered to have a radiographic response of irradiated lesions. The optimal cut-off value of 37.25 ng/mL was obtained using ROC curve analysis (AUC=0.687, sensitivity=0.733, specificity=0.600), and patients were divided into post-RT LDNA and HDNA groups, according to the cut-off value. The treatment response was significantly better in the postRT LDNA group than the post-RT HDNA group (81.8% vs. 47.8%, p=0.017).
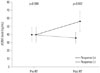
Pre- and post-RT cfDNA levels in responders and non-responders
cfDNA levels were compared between the responders and nonresponders at baseline and after RT (Fig. 1). The mean cfDNA values at baseline were similar for both groups (responders vs. nonresponders: 39.5 vs. 39.6 ng/mL, p=0.988), but significantly different after RT (responders vs. nonresponders: 35.9 vs. 56.1 ng/mL, p=0.002).
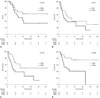
Survival outcome according to post-treatment cfDNA levels
Oncologic outcomes included overall survival (OS), PF, IHFF, and LC rates according to post-RT cfDNA levels(Fig. 2). The OS and PF rates were not significantly different between the post-RT LDNA and post-RT HDNA groups (p=0.145 and p=0.257, respectively) (Fig. 2A and B). Patients in the post-RT HDNA group had significantly lower IHFF and LC rates than patients in the post-RT LDNA group (p=0.035 and p=0.006) (Fig. 2C and D).
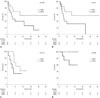
In subgroup analysis, patients who received CFRT were analyzed separately from those who received SBRT (Fig. 3). Although IHFF rates were not significantly different according to the amount of post-RT cfDNA in either subgroup (Fig. 3A and C), the post-RT LDNA group had a better LC rate than the post-RT HDNA group within the SBRT group (p=0.041) (Fig. 3B) and the CFRT group (p=0.046) (Fig. 3D).
Prognostic factors for OS, PF, IHFF, and LC rates
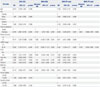
At a median follow-up of 20.2 months (range: 1.7–66.8 months), the median OS was 29.1 months, and the median PF, IHFF, and LC periods were 10.1, 11.7, and 40.7 months, respectively. Table 2 shows the results of univariate and multivariate analysis of IHFF and LC rates. The presence of cirrhosis, multiple tumors, and high levels of post-RT cfDNA were significant factors associated with lower IHFF rates in univariate analysis, while mUICC stage showed borderline significance. Among these, the presence of cirrhosis [p=0.006, adjusted hazard ratio (HR) 4.656, 95% confidence interval (CI) 1.543–14.052] and postRT cfDNA level (p=0.036, HR 2.405, 95% CI 1.059–5.460) remained significant after adjustment for other factors. Regarding the LC rate, tumor multiplicity, mUICC stage, BED, and pre- and post-treatment cfDNA levels were identified as significant prognostic factors for LC rate in univariate analysis. After multivariate analysis, no factors remained statistically significant for LC rate.
The factors correlated with OS and PF rate are depicted in Table 3. In univariate analysis for OS, tumor multiplicity, tumor size, mUICC stage, presence of PVTT, levels of AFP and PIVKA-II, and BED were significant factors, and tumor multiplicity remained significant after adjusting for covariates (p=0.046, HR 2.737, 95% CI 1.019–7.355). Despite the presence of multiple tumors, advance mUICC stage showed significant correlation with poor PF rate in univariate analysis, and multivariate analysis revealed no significant factor for PF rate.
DISCUSSION
Since the first description of cell-free nucleic acids in 1948,16 many studies have attempted to clarify the association between cell-free nucleic acids and various diseases.17 Although the release mechanisms of cell-free nucleic acids are not fully understood, cfDNA (a cell-free nucleic acid) is thought to result from apoptosis, necrosis, or active secretion from cells into circulating blood.18 cfDNA has been investigated as a potential novel biomarker for the diagnosis and surveillance of various cancers, since the abnormalities of cfDNA were identified in patients with cancer. These abnormalities include both quantitative and qualitative changes. The quantitative changes include an increased amount of cfDNA in cancer patients, compared to normal healthy controls.19 The qualitative changes include specific point mutation, loss of heterozygosity, DNA methylation, integrity alterations, and allelic imbalances in DNA.2
Compared to already established biomarkers, the use of cfDNA as a biomarker has several advantages in liver cancer. First, cfDNA is easily obtainable and can be collected repeatedly for follow-up through noninvasive methods. In addition, unlike samples obtained by invasive biopsy on focal lesions, samples that are extracted from blood, including cfDNA, can provide information on the overall state of patients. However, there are also disadvantages to the use of cfDNA. As described by Tang, et al.,20 cfDNA is only present in trace amounts in serum, and efficient isolation is difficult. In addition, factors other than the tumor itself, such as inflammatory responses, may also affect the amount of cfDNA. Especially for HCC, in which chronic inflammation from hepatitis B or C virus may coexist, interpretation should be made cautiously.21
Although the amount of cfDNA has been reported to be as sociated with tumor burden or prognosis in many studies,22232425 limited research is available in the field of radiation oncology. In a single-institution prospective study of early-stage nonsmall-cell lung cancer, Bortolin, et al.11 reported that higher levels of cfDNA were associated with unfavorable survival outcomes in patients who underwent SBRT. In a study of patients with head and neck squamous carcinoma, Mazurek, et al.12 reported that higher levels of cfDNA were observed in patients with advanced N stage and overall. Woo, et al.13 reported that cfDNA declined significantly after concurrent chemoradiotherapy in a study of patients with pancreatic cancer.
Several studies on cfDNA have included patients with liver cancer. Specifically, the amount of cfDNA and genetic alteration detected in cfDNA were reported as potential biomarkers for diagnosis in patients with HCC, either solely or in combination with AFP (a known biomarker).26 In addition, several studies have reported that elevated levels of cfDNA after radical resection for HCC are associated with poor patient survival.2527 However, it is still unclear whether plasma or serum cfDNA can be used as a predictive marker in HCC for treatment options other than surgery. To the best of our knowledge, this is the first study to investigate the value of cfDNA as a biomarker in patients with HCC who underwent RT.
The results of our study showed that cfDNA levels have clinical significance in pre- and post-treatment settings. First, in a pre-treatment setting, tumor sizes were larger in the HDNA group than in the LDNA group; furthermore, the proportion of patients with advanced tumors was greater. These findings are presumed to be because the tumor bulk itself, which shows a positive correlation with cfDNA levels, as suggested in previous studies.282930 In the post-treatment setting, the LDNA group showed significantly better tumor response and LC than the HDNA group.
The relationships between elevated cfDNA levels and poor prognosis have been reported for a variety of carcinomas. Investigations of the kinetics of circulating tumor-derived DNA in serum or plasma revealed that the amounts of cfDNA were found to increase at the beginning of RT and to decrease to or below initial levels by the end of treatment.12131931 Therefore, the persistent elevation of cfDNA after treatment completion may indicate the presence of remnant lesions or progression in other sites.3233 After adjusting for other factors, a high post-RT cfDNA level was revealed to be an independent factor for poor intrahepatic tumor control.
Intrahepatic metastasis and recurrence, which is common in patients with HCC, are known to have a significant impact on prognosis.343536 In an analysis of failure patterns in the present study, among 37 patients with failures, intrahepatic failure as a first event was observed in 29 (78.4%) patients; synchronous intrahepatic and extrahepatic failure occurred in 2 (5.4%) patients. Only 7 patients (18.9%) developed extrahepatic failure as a first failure event. Because intrahepatic failures are major patterns of failure, the importance of achieving LC in patients with HCC cannot be overemphasized to prevent the further progression of intrahepatic metastases and to improve the overall prognosis of patients. In summary, in the absence of a validated early predictor for treatment response in HCCs, these results suggest that the amount of cfDNA measured immediately after RT might hold potential as a novel, easy-to-use biomarker with which to predict treatment response and the prognosis of patients. There have been some previous reports that showed the significance of pre-treatment cfDNA in predicting treatment outcome.2325 However, in our study, post-RT cfDNA, not pre-RT cfDNA, was found to be predictive of IHFF, suggesting that it could be a useful marker for predicting local treatment response earlier (immediately after treatment) than regular response evaluation time (1–3 months after treatment).
Our study has some limitations. First, a small cohort of only 55 patients was enrolled in our study, making it difficult to derive meaningful results in our statistical analysis. Secondly, our study population consisted of two different prospective study cohorts: CFRT with concomitant chemotherapy was performed for one cohort, and SBRT for the other. The heterogeneity of these populations, including baseline characteristics and treatment details, might be a confounding factor. Thirdly, the amount of cfDNA can be affected by other factors like chronic inflammation (from hepatitis B or hepatitis C) and previous treatments. To account for the effect of viral infection, we compared the viral titer of pre-RT LDNA and HDNA groups, and found no significant difference in viral titer between the two groups. In order to prevent fluctuations in cfDNA caused by previous treatment, patients who received RT after at least 1 month (median 3 months, range 1–69 months) from previous transcatheter arterial chemoembolization (TACE) of RFA were included in our analysis, as cfDNA has been found to increase after TACE with the highest level being detected 4 days after the treatment.37 Finally, this study aimed at only quantitative analysis, as the first attempt to investigate the significance of cfDNA in HCC patients treated with RT, since the analysis of cfDNA can further be expanded to NGS for the comprehensive genetic information of cancer.
In conclusion, quantitative analysis of cfDNA was feasible for our patients. This study suggests the possibility of post-RT cfDNA level as an early predictor for treatment response and LC after RT in patients with HCC. However, further prospective studies with larger populations and more homogenous patient cohorts are required to confirm this hypothesis.
 XML Download