

 PDF
PDF ePub
ePub Citation
 Print
Print


INTRODUCTION
Pathological diagnosis involves very delicate and complex consequent processing that is conducted by a pathologist. For accurate diagnosis, the pathologist needs updated medical knowledge, abundant experience, and ability to synthesize clinical data and to compare them with visual information in order to make a judgment. However, subsequent diagnostic approach used by pathologists is not well known.
Bussolati1 suggested that the pathologist's mental process involves four steps: 1) to look, 2) to see, 3) to recognize, and 4) to understand, whereas Pena and Andrade-Filho2 proposed a model for the pathologic diagnostic process: 1) cognitive, 2) communicative, 3) normative, and 4) medical conduct. The ‘cognitive’ process consists of perception, attention, memory, search, hypothesis creation, verification, etc, and it may correspond with ‘to look,’ ‘to see,’ and ‘to recognize’ proposed by Bussolati.1 The first step of the diagnostic process can be considered a very important step. In some fields such as dermatopathology, the process used is “pattern recognition.”34 Common skin tumors can often be diagnosed by gross inspection of microslide or at the lowest scanning magnification. This is the reason of why the low-power pattern (“tumor silhouette”) of a skin tumor is at least as important as the cytological criteria for diagnosis.4 Similarly, low-power features are the basis for classification of most inflammatory skin lesions.5 Based on these consideration, we developed a hypothesis that the low-power pattern recognition which falls under ‘to recognize’ or ‘the cognitive process’ would be an important key to pathologic diagnosis, and that false pattern recognition might be an important cause of misdiagnosis in the field of surgical pathology.
Recently, the region of interest, which may correspond to ‘look’ and ‘see,’ has been studied, especially in virtual microscopy.6 Nevertheless, the influence of visual recognition and cognitive bias in surgical pathology is not well known.7
In this study, we evaluated the influence of visual and cognitive bias in the recognition and cognitive processes of the surgical pathologic diagnosis, by focusing on the influence of “mental rotation” in the diagnostic process. Mental rotation is the ability to rotate mental representations of two-dimensional and three-dimensional objects as it is related to the visual representation of such rotation within the human mind.8
The main reasons for focusing on “mental rotation” were: 1) it is very commonly encountered in daily practice, 2) it is easy to manipulate and control while testing the hypothesis, and 3) most orientations of pathological findings were unidirectional; for example, basement membrane is located downward and the direction of epithelial maturation is upward. Thus, we selected cases of uterine cervical intraepithelial neoplasia for the test model.
MATERIALS AND METHODS
Case selection and image acquisition
We reviewed pathology reports of uterine cervical biopsy samples in 2012 at our hospital. After 2 pathologists (H. P, and S. H. K) reviewed the cases, we selected representative glass slides which had been diagnosed with “chronic inflammation (CNI),” low-grade squamous intraepithelial lesion (LSIL), cervical interepithelial neoplasia (CIN) I, high-grade squamous intraepithelial lesion (HSIL), CIN II and CIN III, according to the Lower Anogenital Squamous Terminology project.9 After reviews of the slides selected, a pathologist (S. H. K.) took several images from the slides with an Olympus DP72 cooled digital camera (Olympus, Tokyo, Japan).
At first, we designed this study with ×40 images. However, we found a difference in visual perception between real microscopy and the computer monitor. After some trial and error, therefore, we concluded that ×100 or ×200 pictures on the computer monitor may correspond with low power under a real microscope. Thus, the images were taken with ×100 or ×200 magnifications and saved as JPEG files (4010×3096). The pathologist ensured that the orientation of the image was maintained; the basement membrane was located downward and the epithelial maturation or proliferation upward. The specialist gynecological pathologist (H. K.) chose representative images from each pathological stage, so as a total of twenty images were chosen from 5 cases of CNI, 5 cases of CIN I, CIN II and CIN III.
Study design
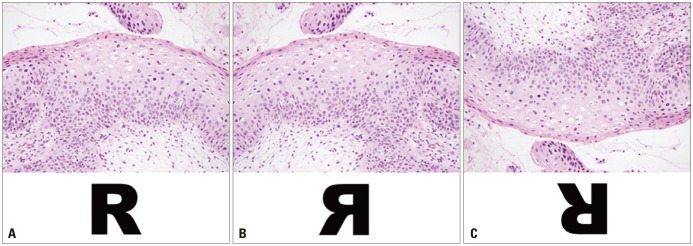
This study was approved by the Institutional Review Board of Medicine (4-2015-0209) of Severance Hospital, Seoul, Korea. We designed a computer program for the survey to evaluate the influence of image rotation on diagnosis. When a pathologist started the program, he or she was first asked to sign the preexperiment consent form. The pre-experiment consent form contained data regarding the gender, age, years of experience as a pathologist, and subspecialty area. If he or she signed the consent form, they see the window shown in Supplementary Fig. 1 (only online). When a participant clicked an answer, the next question appeared. Basically, the items consisted of three sets of the same images. The first set consisted of 20 original images, the second set consisted of left to right mirror images of the original images, and the third set contained 180-degree rotated images of the original images (Fig. 1). We then arranged the 60 images randomly (Supplementary Fig. 2, only online). To enable the participants to familiarize themselves with the operation of the questionnaire and in order to optimize their responses, we placed six images each as the pre- and post-main demonstration items. We did not limit the response time.
The pre-experiment consent form did not mention the study goal because we wanted to reduce bias, and we carefully explained the aim of this study after the experiment. We recruited 32 pathologists through open-recruitment.
Statistical analysis
To evaluate the characteristics of the items, we examined the total items and each A, B, and C set by “classical test theory (CTT)” and “item response theory (IRT).” The analysis based on CTT was performed using SPSS version 20.1 (IBM Corp., Armonk, NY, USA), and multifacets were analysed by using Facets version 3.71.4 (http://www.winsteps.com/facets.htm), which measured many facets with the Rasch model.
To measure the reliability of a test, we calculated Cronbach's alpha for these test sets. We calculated the difficulty indices and discrimination indices with CTT and compared these indices between each item set by analysis of variance (ANOVA). The analyses of effects on variance of difficulty were performed using G string IV version 6.1.1 (Papaworx, Hamilton, Ontario, Canada) according to Generalizability theory. The criterion for statistical significance was a p value <0.05. Finally, we evaluated multifacets effects with Facets.
RESULTS
Demographic data
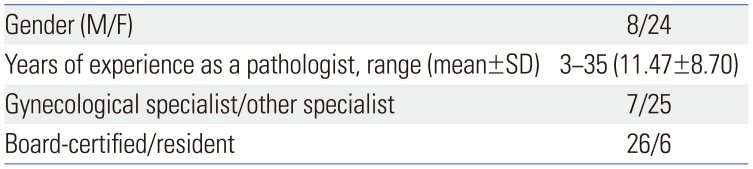
The demographic data of the pathologists are described in Table 1 and Supplementary Table 1 (only online). In summary, a total of 32 pathologists participated in this experiment (8 male and 24 female). The average duration of experience as a pathologist was 11.47 years (3–35 years). In addition, there were seven gynecological pathology specialists.
Classical item analysis
The reliability of the test
To estimate the reliability of the items, we measured Cronbach's alpha by SPSS. Cronbach's alpha value was 0.79. In comparing groups, alpha values of 0.7 to 0.8 are regarded as “satisfactory”10; thus, the entire item set could be considered to constitute an adequately reliable questionnaire.
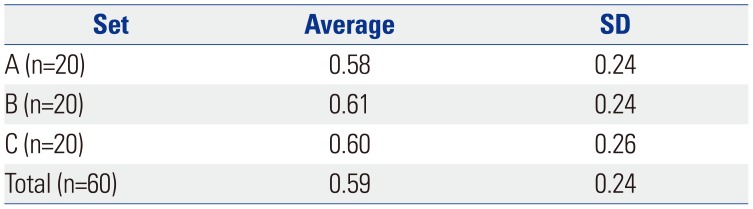
The item difficulty indices and discrimination indices in total and each item set
The item scores of each pathologist are shown in Supplementary Table 1 (only online). The duration of experience as a pathologist, specialist or general pathologist and the status of being board certified or a resident did not affect the item difficulty indices and gender (data not shown). The average total item difficulty index was 0.59±0.24 (0.13–1.00). For each item set, the difficulty indices are described in Table 2 [set A: 0.58±0.24 (0.19–1.00), set B: 0.61±0.24 (0.16–0.97), and set C: 0.60±0.26 (0.13–1.00)]. There were no differences in difficulty indices among the item sets (A, B, and C) demonstrated by ANOVA (F=0.07, p=0.93).
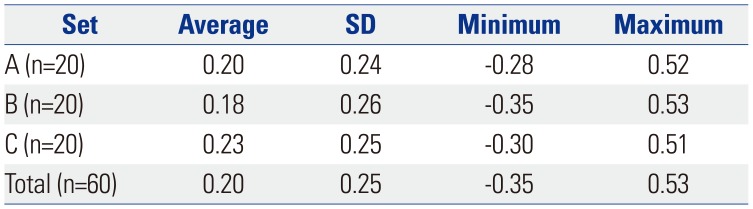
Also, we evaluated the item discrimination indices (Table 3). The total item discrimination index was 0.20±0.25 (−0.35–0.53). The item discrimination indices of sets A, B, and C were 0.20±0.24 (−0.28–0.52), 0.18±0.26 (−0.35–0.53), and 0.23±0.25 (−0.30–0.51), respectively. There were also no differences in item discrimination indices among the item sets by ANOVA (F=0.17, p=0.84). According to the suggestions of Cangelosi11 and Ebel's,12 total items and each A, B, and C set belong to “average” difficulty and “marginal” items.
We also evaluated the response duration time for each item. The average total response time was 4.74±4.49 seconds (0.10–73.0). In each item set, the average response times were 4.53±4.29 (0.10–47.0) (set A), 4.70±4.32 (0.10–44.0) (set B), and 4.98±4.82 (1.0–73.0) (set C) seconds. There were no differences in response time among the item sets (F=1.66, p=0.19).
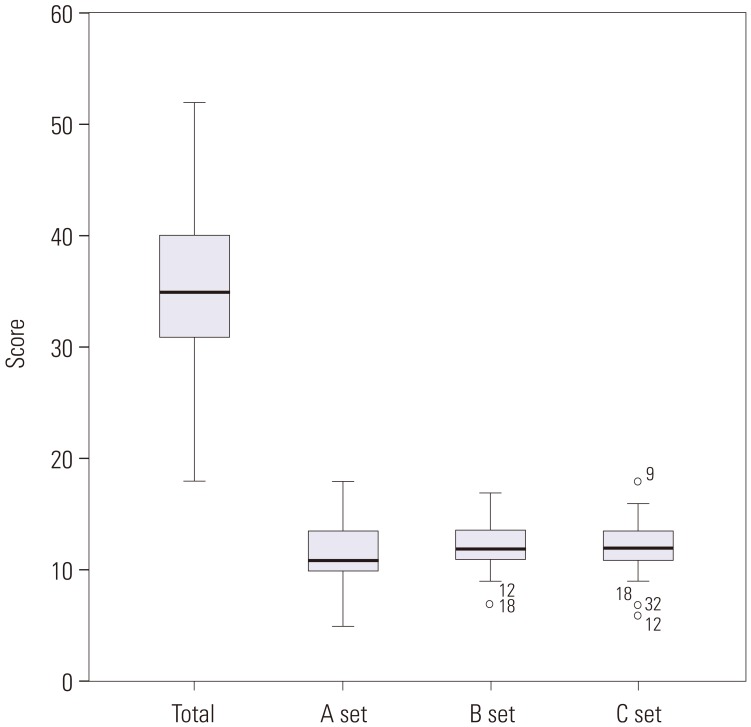
Finally, we examined the distribution of each pathologist's scores in total and according to sets A, B, and C (Fig. 2). The total items score for all pathologists and set A were between two-standard deviations (2-SD), whereas in set B, two pathologists scored under 2-SD. In set C, three pathologists scored under 2-SD and one pathologist scored above 2-SD.
The analyses of variance of scores by Generalizability theory
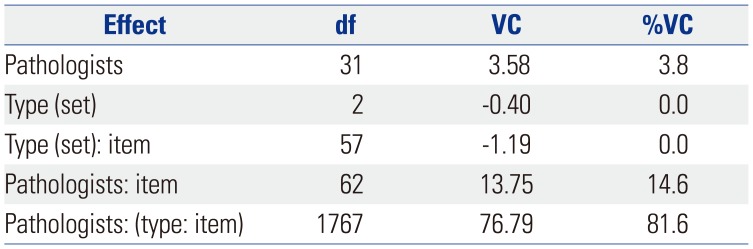
The results of analyses of effects on variance of scores by Generalizability theory are described in Table 4. The results show that type (set) and item and type did not affect the variance of scores; however, the effect of pathologist nested item (14.6%) and Pathologist (3.8%) were noted.
Multifaceted analysis according to Facets
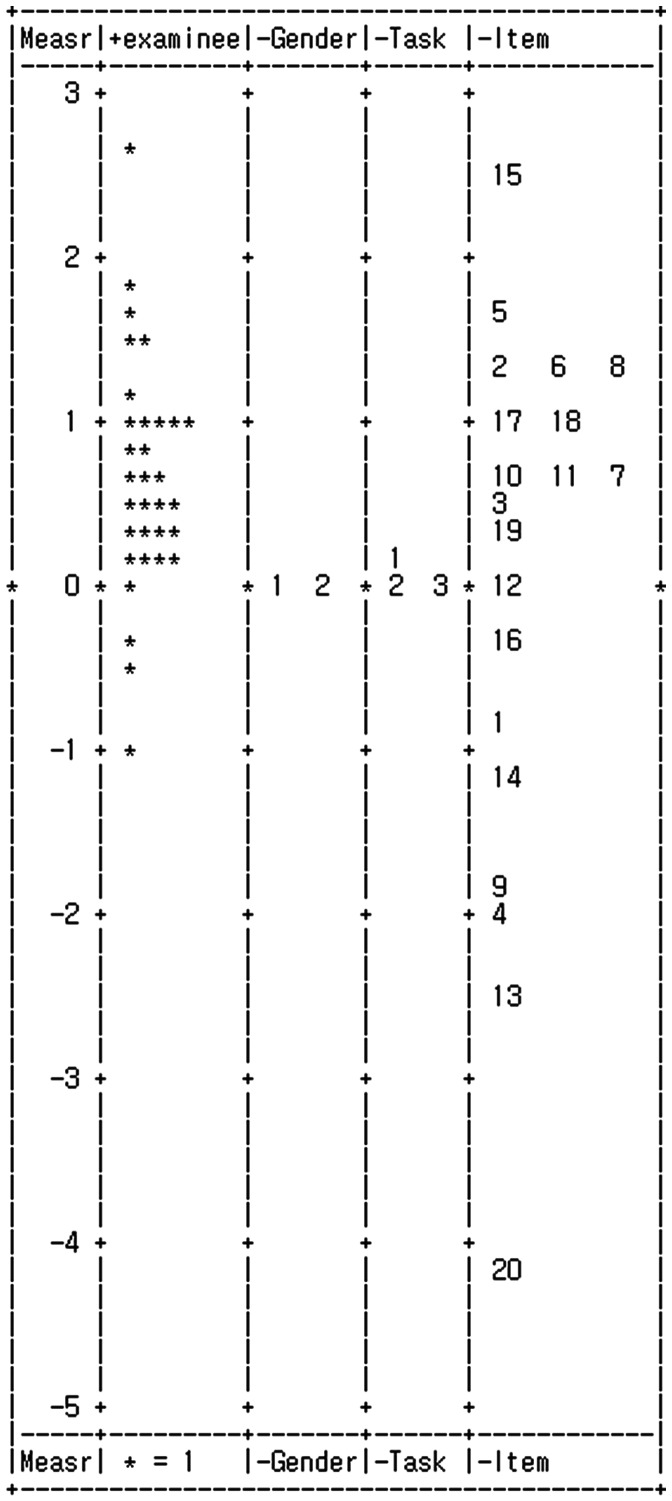
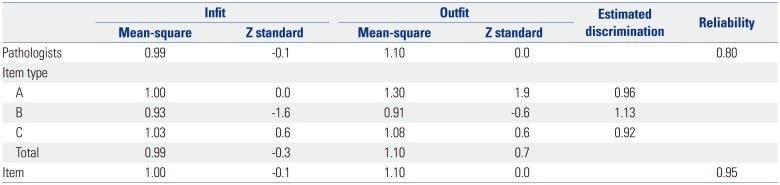
We performed the many-facet Rasch analysis using the Facets program according to IRT, and the data for “examinee (pathologists),” “task (item type),” and “item” shown in Table 5. All infit and outfit mean-square were between 0.5 and 1.5. In addition, all Z standard values were −0.9 to +1.9, implying that this measurement system is valid and the data had reasonable predictability.13 The vertical ruler (yardstick) (Fig. 3) shows the distribution of task (item type) and difficulty according to measurements for each examinee. It is clear at a glance that the item type (A, B, and C) are located very closely around “0,” meaning that the tasks (item type) did not affect the variance of item difficulty.
DISCUSSION
Pattern recognition is defined as a cognitive process that matches information from a stimulus with information retrieved from memory. Therefore, we asked a question of “How does the bias of pattern recognition affect the pathologic diagnosis?” To examine the hypothesis, we focused on the concept of mental rotation, which was developed by Metzler, Cooper, and Sherpard.81415 They indicated 1) that discrimination between standard and reflected versions of a rotated character requires a compensating mental rotation, 2) that subjects who are given information in advance as to the orientation of a prespecified test stimulus can carry out the required mental rotation before that stimulus is actually presented, and 3) that during such a preparatory process, the orientation in which the test stimulus would (if presented) be most rapidly discriminated, is actually rotating with respect to external space.15 They also showed that time is required to prepare for a rotated stimulus by designated character experiment.14 We noticed that mental rotation might be a trigger for false pattern recognition among pathologists, leading to misdiagnosis; a longer time might also be required for diagnosis because of mental rotation.
There are a lot of diagnoses which could be affected by axial orientation. However, some tissue samples (such as Focal cortical dysplasia of brain) belong to only some specialist areas in practice. We thought that the CIN model is a more common practical diagnosis among both general and specialized pathologists. Therefore, we selected uterus cervix CIN for the experimental design model. Typically, the concept of CIN is explained by the thickness of dysplastic cells from the basement membrane. Almost all images, which explain CIN histology, show the basement membrane located at the bottom, not on top. Therefore, it might be a good model for image pattern recognition.
We designed 3 sets of 20 items, consisting of original, left to right mirror images, and 180-degree rotated images. They were still-images, not virtual images. We showed one still-image per a case in order to focus on the mental rotation process, not on other processes such as ‘see,’ ‘look,’ etc.126
Initially, we examined whether the items were adequate for measurement by both classical item analysis and IRT, since the test and items in the test can be evaluated according to different theories. Two of such theories are the CTT and the IRT, which are two major frameworks that have been used in educational measurement to develop, evaluate, and study test items.16 CTT is based on the assumption that an examinee has an observed score and a true score,16 and utilizes measures of item characteristics, item difficulty and item discrimination, and the distribution of examinee proficiency within a sample.16 The major advantage of CTT is its relatively weak theoretical assumptions, which make CTT easy to apply in many testing situations.17
On the other hand, IRT has become an important complement to CTT. IRT has a strong mathematical basis and depends on complex algorithms that are more efficiently solved by a computer.16 It describes the relationship between an examinee's test performance and the traits assumed to underlie such performance on an achievement test as a mathematical function called an item characteristic curve.1819 IRT primarily focuses on the item-level information, whereas the CTT's primary focus on test level information.16
To discuss the detailed theoretical background would be beyond the scope of this article. Nevertheless, after the analyses by both theories, we concluded that the entire 3 sets of 20 items and each item were suitable for the testing the authors' hypothesis.
If the hypothesis were true, we had expected that the difficulty index of 180-degree rotation images (C) set would be lower than other original (A) and left to right mirror image (B) sets. In addition, the response time would be longer in set C. However, the results were quite unexpected. Statistically, there were no differences in difficulty, discrimination indices and response duration time between each set. This meant that mental rotation did not influence the pathologists' diagnosis in practice.
Under the CTT model, the participant's true score is the sum of the observed score and a single undifferentiated error term.20 The most frequently reported estimate of reliability is Cronbach's alpha. However, the alpha incorporates only errors associated with sampling of items.20 Accordingly, Cronbach's alpha does not allow us to pinpoint, isolate, and estimate the impact of different sources of measurement error associated with observed participants' marks.20 To complement this, an extension of CTT, called “Generalizability theory,” was used. It differentiates the multiple, potential sources of measurement error called “facets” (sometimes called “dimensions” in experimental design literature).20 In a Generalizability study, the universe of admissible observations is defined as broadly as possible (items, occasions, raters if appropriate, etc.) to provide variance components estimates to a wide variety of decision makers.21 In the present study, according to the ANOVA of scores by Generalizability theory, the (item) type did not have any influence on the score. The main effect was “pathologist”דtype”דitem.” Although it means the main effect is unexplainable, the effects of pathologist nested item (14.6%) and pathologist (3.8%) were noted. Therefore, the diagnostic accuracy depends on who is observing the item.
The vertical ruler (yardstick), produced by many-facet Rasch analysis using the Facets program, presents the measures in a graphic form,22 and shows the distributions of pathologist, type and item. The present results showed that the pathologist is a positive facet (positive), such that greater raw score means higher measure. On the other hand, the type (task) and item are negative facets, such that greater raw score means lower measure. It meant that no. 15 (mild reactive epithelial changes in glycogenated cells vs. koilocytic atypia) is a very difficult item and no. 20 (typical findings of chronic inflammation) is the easiest item. The distributions of task (type) are very narrow, meaning that there is no difference in the measurement between type A, B, and C.
Contrary to our expectations, the analyses by CTT, Generalizability theory, and IRT indicated that mental rotation does not seem to influence the pathologists' diagnosis in practice. However, we suggest alternative explanations for the results. The first one is that the training of pathological diagnosis may accommodate mental rotation. Secondly, mental rotation is a very short process (for example, 400–1100 milliseconds), whereas the pathological diagnosis is a relatively long process (4–5 seconds or more). Therefore, the duration of pathological diagnosis may be sufficient time to correct and revise the process of mental rotation. In addition, we are at a loss at the exact reason for the high discordant rates among gynecological pathologists. Maybe, the absence of clinical information and history regarding Human Papilloma Virus (HPV) infection status and no chance to review other lesions could have accounted for this.
Interestingly, the outliers were more frequent in the rotated image sets (B and C) than the original image set (A). Particularly, the minority of pathologists (No. 12, 18, and 32) tended to misdiagnose in set C than sets A and B. This suggests that the mental rotation process may influence the minority of individual pathologists in pathological diagnosis. More research is needed to address this observation.
It should be mentioned here that nowadays, virtual microscope images are used globally. The function of image rotation may be helpful to perceive the correct pattern recognition.
In conclusion, the mental rotation process seems not to influence pathological diagnosis. However, a few pathologists could be subjectively influenced during the mental rotation process.
 XML Download