

 PDF
PDF ePub
ePub Citation
 Print
Print


INTRODUCTION
Quality assessment, based on readmission and mortality rate of inpatients, in teaching hospitals and hospitals with 500 or more beds has been initiated by Health Insurance Review and Assessment service of Korea (HIRA) since 2015 expecting to reduce unnecessary admission. Since 2009, penalties or incentives have been applied in the Unites States to hospitals according to the ‘Assessment criteria for readmission rate.’ The indices of healthcare quality assessment in Korea include 5 areas; patient safety and healthcare quality, public function, healthcare delivery system, education, and research. In HIRA's new amendment, more patient safety and healthcare quality' area are emphasized, showing highest and moreover increased weight (from 60% to 65%). This revision represents the Korean governmental side of view on the importance of patient safety and healthcare quality area, especially emphasized the number of doctors per inpatient. On the other hand, the execution plan has encountered strong criticism of medical specialists, who suggested that the policy is one sided and hasn't reflected their opinions. Thus, there remain so far conflicting views on quality assessment for readmission and mortality rate. Globally, heart failure is the leading cause of readmission and death in individuals over 65 years of age.123 The prevalence of heart failure in South Korea rose from 94421 in 2009 to 115063 in 2013, an increase of 4.5% per 100000, and treatment cost increased from 718 hundred million won in 2009 to 963 hundred million in 2013, a 1.3-fold increase.4 Despite its importance, however, few epidemiological studies have been carried out to examine readmission and mortality for heart failure in Korea.5 Nevertheless, a Korean Acute Heart Failure Registry study found a 90-day readmission rate of 7.1% and 1-year mortality rate of 15%.6
Readmission can be avoidable, and financial and social burdens of 30-day readmissions are enormous.7 A 2009 meta-analysis found that urgent readmissions are often preventable and the most common investigation period was 30 days post-discharge.8 Since readmission involves unnecessary medical costs, the reduction of avoidable readmission appears to be urgently needed to improve the quality of healthcare.9
Physician volume may significantly affect outcomes of care for heart-failure patients.10 Although heart-failure patients' readmission is an important national concern, most previous studies have focused on surgeon volume and surgical care outcomes. 111213 Only a limited number of studies have investigated the relationship between physician volume and heart-failure outcomes (readmission and mortality) with nationwide data. An indirect evidence suggests that physician volume influences heart failure outcomes: hospitals with greater capacity as well as high physician volume are more likely to have better outcomes. However, these two indexes are distinct; the relationship between the number of hospital beds and health outcomes may differ from the relationship between physician volume and health outcomes. Better health outcomes in hospitals with a greater capacity may reflect a superior system.
Thus, we attempted to verify the effect of physician volume on health outcomes in heart-failure patients (30-day readmission and 1-year mortality) and the combined effects of number of physicians and beds, using nationwide cohort data from 2003 to 2013. Because the financial and social burden of heart-failure readmission and mortality is of national concern, it is necessary to examine hospital-related determinants to improve the quality of care through institutional intervention.
MATERIALS AND METHODS
Data source and study sample
This study used nationwide cohort sample data of National Health Insurance Service (NHIS) claims in 2003–2013. NHIS is obligatory and covers the entire Korean population. Cohort NHIS sample data include approximately one million patients as representative of the Korean population. Data of randomly sampled individuals were classified according to gender, age, income level, region, and individual medical costs at the baseline and follow-ups until 2013. Data included subjects' demographics (gender, age, income level, and region) and medical care history [International Classification of Disease (ICD-10) diagnoses, medical treatment, and health examination], and hospital characteristics (ownership, number of beds, and number of doctors). In addition, numbers were assigned for patients' mortality data from the Korea National Statistical Office to maintain confidentiality.
We selected patients over 65 years of age who had been admitted to acute-care hospitals for heart failure in 2003–2013. For inclusion, subjects had to be over 65 years of age with a primary diagnosis of heart failure, identified by ICD-10 code I50.x. This is because older patients with heart failure differ from younger patients. We excluded patients in clinics/physician offices and long-term-care hospitals for homogeneity. We, therefore, identified 1392 heart-failure patients who met these criteria.
Outcome measures
Outcome variables were 30-day readmission and 1-year mortality for heart failure as readmission and mortality, respectively.1415 In this study, 30-day readmission was defined as readmission for any cause within 30-days post-discharge at the hospital where the individual received treatment for heart failure. In the current study, we analyzed the readmission as repeated event. Discharge and readmission information was obtained from medical records. Finally, 1-year mortality was defined as death by any cause within a year after the admission date for heart failure. The observation period for mortality was longer than one year.
Covariates
The main independent variable was the number of physicians in acute-care hospitals. This study grouped the number of physicians into tertile. For the combined effect analysis, physician volume was classified as low (≤16), medium (17–165), and high (>165). Bed volume was also divided into three categories: low (≤500), medium (501–1000), and high (>1000). Individual variables included demographics (gender, age, income level), admission pathway, and comorbidity [Charlson comorbidity index (CCI) which was calculated with all the medical records of comorbidities in 2002–2013, acute myocardial infarction (AMI), vascular or circulatory disease, chronic obstructive pulmonary disease (COPD), pneumonia, and diabetes]. Institutional variables included hospital ownership (public or private), number of beds, and number of physicians.
Statistical analysis
Categorical variables were expressed as frequencies and percentages, and continuous variables were described as means and standard deviations. Chi-square tests and t-tests were used to assess differences in characteristics according to readmission and mortality rates. Kaplan-Meier survival curves were constructed for physician volume (high, medium, and low), and comparisons were made using log-rank tests. We used Cox proportional hazard models using a shared-frailty model. SAS 9.4 software (SAS Institute Inc., Cary, NC, USA) was used for all analyses.
RESULTS
The analysis of the sample's characteristics by 30-day readmission and 1-year mortality are shown in Table 1. Of the 2345 subjects (patients hospitalized with heart failure in 2002–2013), 812 (34.6%) were readmitted within 30 days and 190 (8.1%) died within one year. High physician volume was lower for those who were readmitted within 30 days or died within one year than those who were not readmitted or had survived longer than a year. A significantly greater number of patients with high CCI scores had a greater likelihood of 30-day readmission than those with low CCI scores. Patients readmitted within 30 days had a higher likelihood of AMI, vascular or circulatory disease, COPD, pneumonia, and diabetes than those who were not readmitted. Patients who were readmitted within 30 days or who died within one year were more likely to have been admitted to hospitals with fewer beds than those with greater capacity. The proportions of 30-day readmission and 1-year mortality by year are shown in Supplementary Fig. 1 (only online).
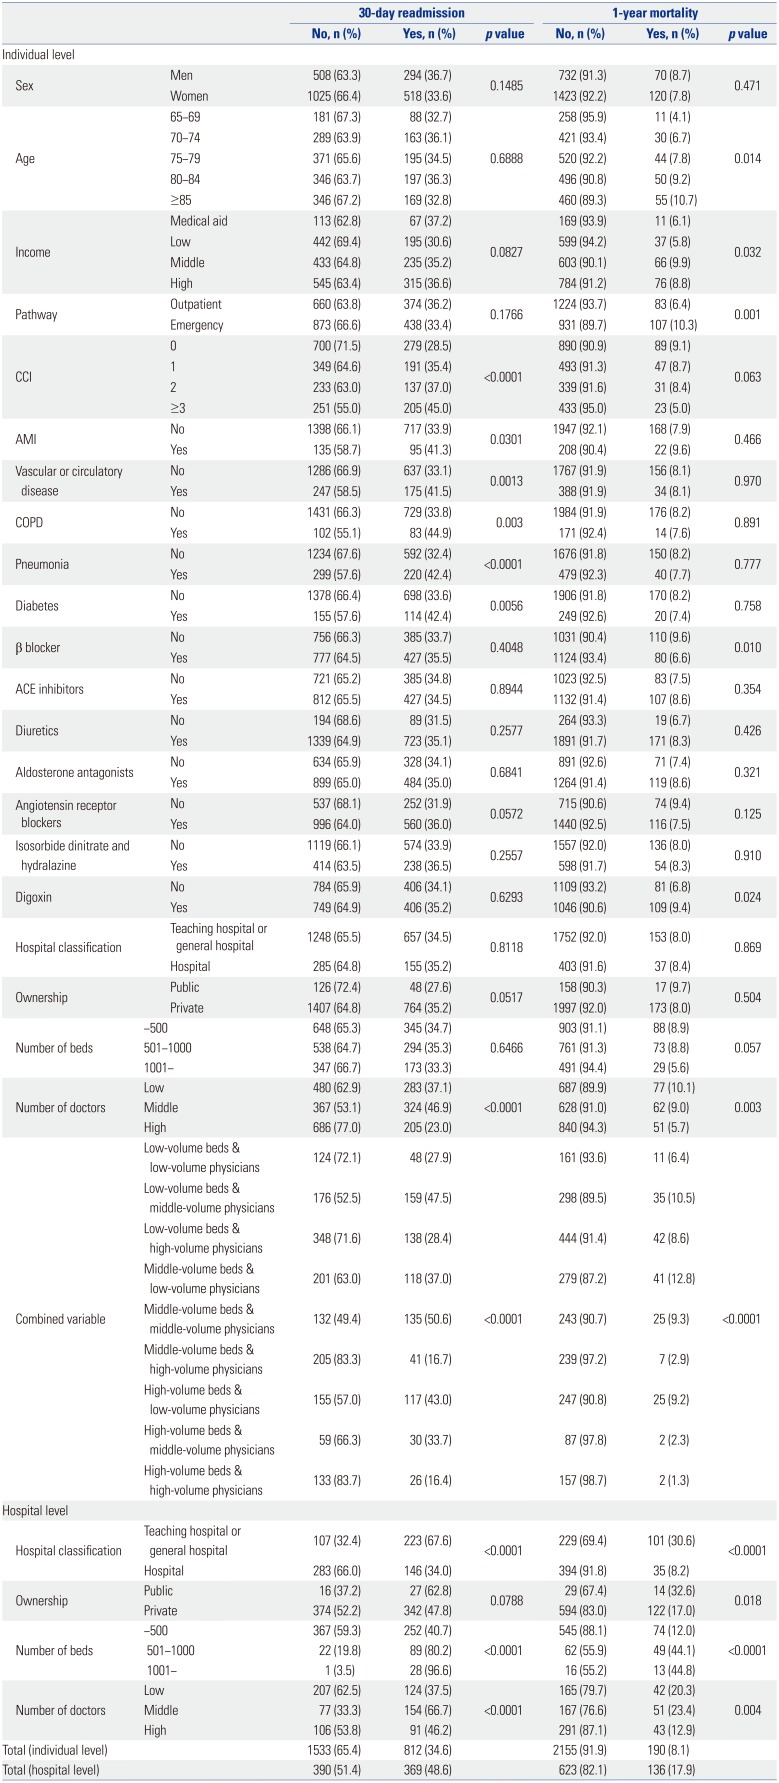
Table 1
Characteristics according to 30-day Readmission and 1-year Mortality among Inpatients with Heart Failure in 2002–2013
![]()
According to the Cox proportional hazard models, physician volume was significantly associated with 30-day readmission and 1-year mortality [30-day readmission: hazard ratio (HR)=1.291, 95% confidence interval (CI)=1.020–1.633 for low number of doctors, HR=1.809, 95% CI=1.459–2.242 for middle number of doctors; 1-year mortality: HR=2.168, 95% CI=1.415–3.321 for low number of doctors, HR=1.816, 95% CI=1.187–2.777 for middle number of doctors] (Table 2). Patients who were admitted in hospitals with low bed volume were more likely to be readmitted within 30 days (HR=1.430, 95% CI=1.068–1.915), and die within 1-year (HR=2.246, CI=1.304–3.868).
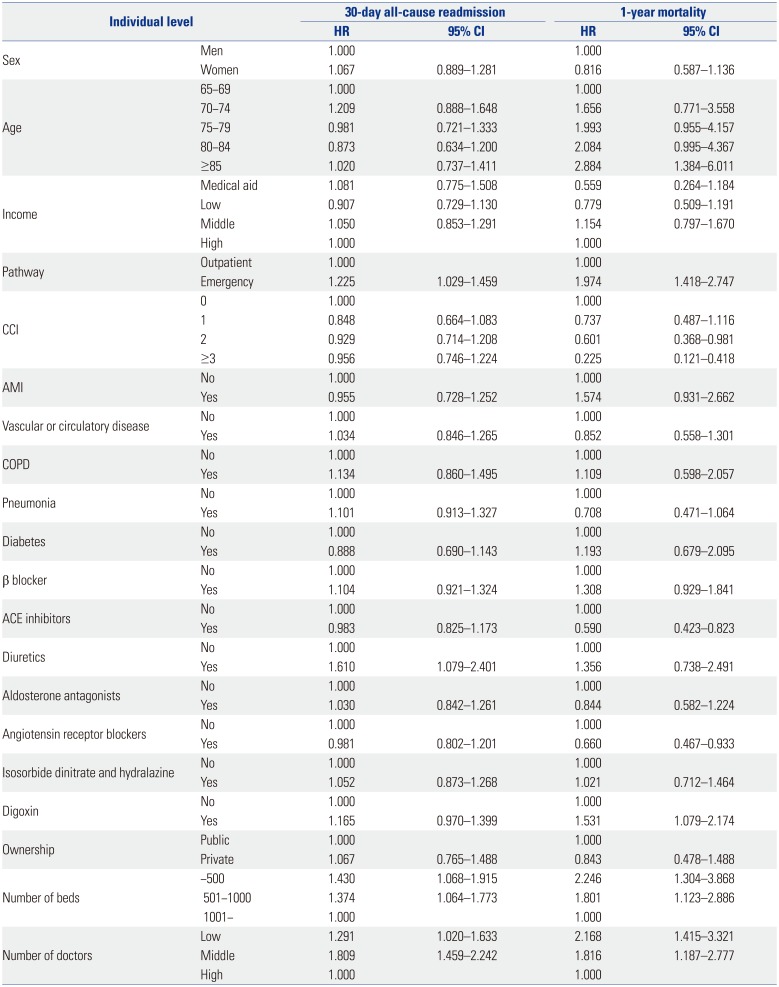
Table 2
Multivariate Cox Proportional Hazard Models with 30-day Readmission and 1-year Mortality in 2002–2013
![]()
Patients admitted to hospitals with high bed and physician volume had low 30-day readmission and 1-year mortality rates than those admitted to hospitals with low or middle volume (Fig. 1).
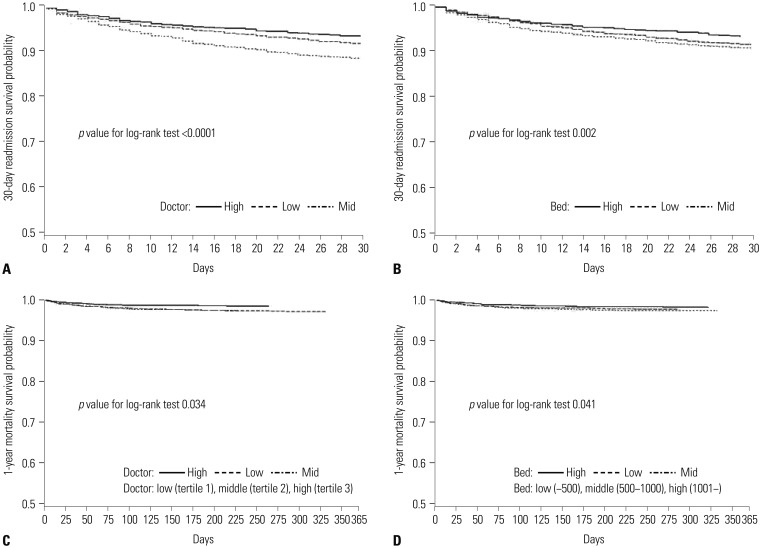
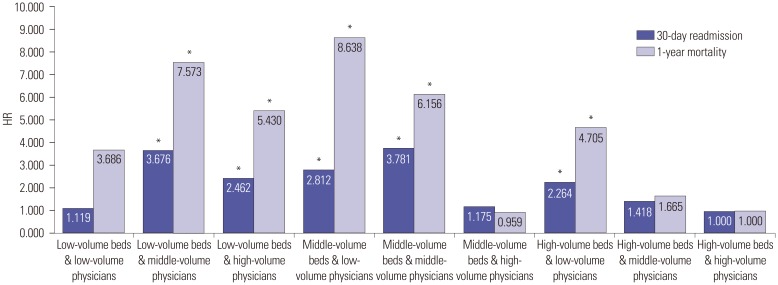
Fig. 2 shows the results of a multivariate Cox proportional hazard model for the combined effects of number of physicians and beds on 30-day readmission and 1-year mortality. Patients admitted in hospitals with higher numbers of physicians and beds were less likely to be readmitted within 30 days or die within 1-year after discharge. Similarly, the likelihood of 30-day readmission and 1-year mortality was lower in hospitals with high physician volumes and low capacity. Generally, 30-day readmission and 1-year mortality were negatively related to both the numbers of physicians and beds together. This study found significant effects of physician and bed volume on readmission and mortality: in hospitals with low or middle physician and bed volume, both 30-day readmission and 1-year mortality were higher than in hospitals with high numbers of physicians and beds (30-day readmission: HR=2.812, 95% CI=1.561–5.066 for middle-volume beds & lowvolume physicians, HR=3.781, 95% CI=2.119–6.746 for middle-volume beds & middle-volume physicians; 1-year mortality: HR=8.638, 95% CI=2.072–36.02 for middle-volume beds & low-volume physicians, HR=6.156, 95% CI=1.488–26.176 for middle-volume beds & middle-volume physicians).
DISCUSSION
Despite advanced and reliable healthcare service quality in South Korea, the imbalance between human and material resources remains as a problem to be solved. The number of hospital beds in Korea has been doubled during 2004–2013 while OECD average increase was only 10%. On the other hand, the number of medical doctors per 1000 populations remains the lowest among the OECD members average, 2.2 vs. 3.3.16 This imbalance may lead to adverse effect of healthcare quality including readmission and mortality.
We, therefore, examined whether physician volume was associated with cardiac-related readmission and mortality, as they are considered good indicators of quality of care. Of the 2345 elderly patients with heart failure admitted to acute-care hospitals, 34.6% were readmitted within 30 days and 8.1% died within a year of the initial hospitalization. The 30-day readmission rate for heart failure in the United States (US) was 21.3% in 2003–2006,17 and 24.8% in 2007–2009.18 Moreover, the 30-day mortality rate was 11.2% in 2005–2008.19 In Russia, the 60-day readmission rate was 6.4%, and the 60-day mortality rate was 8.1%, whereas, the corresponding values in Eastern Europe were 19.4% and 9.9%.20 Heart-failure readmission and mortality rates in South Korea have been shown to be high in comparison to other countries. However, the study population, outcomes, and inclusion criteria in the present study are different from those in these studies.
In the present study, elderly patients with heart failure who were treated at acute-care hospitals with low physician volumes were more likely to be readmitted within 30 days or die within a year. Moreover, the combined effects of number of physicians and beds on 30-day readmission and 1-year mortality were significant: in general, patients admitted in hospitals with low or middle number of physicians and beds were more likely to be readmitted within 30 days or die within 1-year after discharge compared to those in hospitals with high physician and bed volumes. However, the condition of patients admitted in hospitals with low physician volume and low capacity might less severe than those with high volume and high capacity. Patients admitted in hospitals with miidlephysician and bed volumes were more likely to be readmitted within 30 days or die within 1-year than those patients admitted in hospitals with low number of physicians.
Consistent with previous studies,2122 the present findings show that patients admitted in hospitals with a high physician volume had a significantly lower risk of readmission and death than those admitted in hospitals with low physician volume. A previous study has found that higher physician volume is associated with lower risk of mortality for heart failure.10 Furthermore, studies on combined effects showed that high physician volume and hospital-bed ratio has better outcomes (post-surgery mortality).2324 However, some studies found that high physician volume is not significantly associated with mortality and even found a positive relationship to readmission.1325
The present study has several limitations. Readmission and mortality rates could be underestimated since this study included only patients with heart failure admitted in acute-care hospitals. Furthermore, since only patients over 65 years of age were included in this study, the results cannot be extended to patients 65 years or younger. We were unable to account for severity of heart failure, reasons for readmission, and cause of death, as the NHIS data did not include these informations. Inaccuracy of risk adjustment may lead to skewed results because severe cases of heart failure tend to be concentrated in large hospitals with a large number of physicians. Therefore, we controlled for admission pathway, CCI scores, and several diseases related to heart failure. Moreover, since the sample data were limited in scope, we were unable to consider all possible covariates associated with readmission and mortality for heart failure, as well as physician specialization. While this study examined the effects, the results do not prove the causality. Since NHI data has limitation for accuracy of diagnosis, we recommend that the results be interpreted with care.
Despite these limitations, the current study has several strengths. Using national data of one million patients and stratified random sampling ensured external validity and permitted transnational comparisons. To the best of our knowledge, this is the first study to examine the effects of physician volume on heart-failure patients' readmission and mortality in Korea. Furthermore, since this is an empirical cohort study, the association observed between physician volume and readmission and mortality has greater support than a cross-sectional design would allow. We controlled patients (demographic, socioeconomic, and medical factors) and institutional factors, as they affect readmission and ultimately patient outcomes. Most previous studies on readmission did not consider patients' demographics or hospital-related factors. Furthermore, this study used medical-history and mortality data from NHIS claims and reliable national statistics. We attempted to homogenize the study population by using clear inclusion criteria: patients over 65 years of age who were admitted to acute-care hospitals for heart failure. Finally, the present findings are useful to policy makers who develop strategies to control hospital readmission rates and mortality. This ultimately helps improve the quality of care for heart failure, which is of national importance. Thus, consideration of physician volumes in hospitals when formulating and implementing various health policies is necessary.
In conclusion, hospital physician volumes were inversely related to readmission and mortality in patients with heart failure. Furthermore, the combined effect of number of beds and physicians on readmission and mortality was significant. Therefore, hospital capacity might be a modifier of physician volumes' effect on readmission and mortality, especially in acute-care hospitals with fewer beds. Thus, the present findings provide evidence for developing new strategies to reduce avoidable readmission and mortality. Policy makers should continue to monitor readmission and mortality rates for heart failure and identify hospitals with low physician volumes to ensure good quality care, especially in those with a smaller capacity.
 XML Download