

 PDF
PDF ePub
ePub Citation
 Print
Print


INTRODUCTION
Glaucoma is a chronic, progressive optic neuropathy with characteristic structural changes in the optic nerve head (ONH) and retinal nerve fiber layer (RNFL) caused by loss of retinal ganglion cells. Although the damage from glaucoma is irreversible, most glaucoma patients have few symptoms until the advanced stages. Thus, an efficient method for early detection is clinically important in the management of this disorder.
As technology improved, numerous attempts have been made to detect glaucoma in its early stages. Optical coherence tomography (OCT) is one of these technologies. It has been widely used for glaucoma diagnosis because it allows objective measurement of the peripapillary RNFL (pRNFL) thickness with high accuracy.12345 OCT also provides a color code classification of pRNFL thicknesses, based on the normative group database. This color coding scheme is relatively intuitive and easy to interpret, therefore, many ophthalmologists have used it to differentiate glaucomatous eyes, which show abnormal coding, from normal eyes. However, several studies have reported that false-positive or false-negative color code abnormalities are common because of various factors such as disc size,67 refractive errors,89101112 and measurement errors.1314
In the present study, we developed simple screening methods for detection of glaucoma, based on the asymmetric nature of this disorder.1 One method exploits the asymmetry of the peak pRNFL thicknesses between the superior and inferior hemispheres, and the other method utilizes the asymmetry of the average pRNFL thicknesses between the superior and inferior quadrants. We evaluated the diagnostic capabilities of the two methods for early detection of glaucoma, and compared them to the diagnostic capabilities of the color code classification of the OCT.
MATERIALS AND METHODS
Participants
This study followed the tenets of the Declaration of Helsinki and was approved by the Institutional Review Board of our institute. The clinical database of the outpatient clinic of Severance Hospital at Yonsei University College of Medicine between January 2013 and September 2015 was reviewed retrospectively (IRB No. 2015-1229-001).
To evaluate the diagnostic abilities of the two methods for early glaucoma detection, subjects with early glaucoma who met the inclusion criteria and age-matched normal subjects were recruited from January 2013 to December 2014 (Training set). Glaucoma was identified by two independent glaucoma specialists (HWB and CYK) based on the typical appearance of a glaucomatous ONH (cup/disc ratio >0.7, cup/disc ratio asymmetry >0.2, diffuse or focal neuroretinal rim thinning, disc hemorrhage, or vertical elongation of the optic cup) and RNFL defects using red-free RNFL photography. Glaucoma patients were included only when there was an agreement on the diagnosis between the two specialists. Two consecutive reliable visual field (VF) tests (Humphrey Visual Field Analyzer; 24-2 SITA Standard algorithm; Carl Zeiss Meditec, Dublin, CA, USA) with mean deviation (MD) >-6 dB were also used to identify the early stages of glaucoma. VF defects were not used to define glaucoma in order to include eyes with preperimetric glaucoma, which is thought to be the earliest stage of glaucoma. In other words, subjects with preperimetric glaucoma were also enrolled in this study. Age-matched normal subjects were recruited from subjects who had regular checkups without any specific ophthalmic disorders. Normal control subjects had normal VF results without any glaucomatous ONH appearances or RNFL defects, and had an intraocular pressure (IOP) ≤21 mm Hg in both eyes.
An independent group (Validation set) was consecutively enrolled from January to September of 2015 to validate the diagnostic abilities of the new methods; the cut-off values from the Training set were used for this analysis. Early glaucoma subjects and age-matched normal subjects for the Validation set were recruited following the same definition described above.
Patients with the following characteristics were excluded from the study: <20 years of age, uncertain optic neuropathy not defined as glaucoma, unreliable VF tests (more than 33% fixation losses or false-negative errors, or more than 15% false-positive errors), OCT (Cirrus HD-OCT; Carl Zeiss Meditec) results with decentering of ONH or signal strength <6, or those who had another intraocular disease affecting OCT results such as diabetic macular edema, retinal vein occlusion, or epiretinal membrane. One eye was randomly selected when both eyes of the same patient were eligible.
Ophthalmic examinations
All subjects underwent a complete ophthalmic examination including best-corrected visual acuity, IOP, autorefraction keratometry (RK-3; Canon, Lake Success, NY, USA), slit-lamp biomicroscopy, dilated-fundus examination, color disc photography (Carl Zeiss Meditec), red-free RNFL photography (Carl Zeiss Meditec, Jena, Germany), and spectral domain OCT. Axial length (AL) was measured using an IOL Master ocular biometric device (Carl Zeiss Meditec), and the VF test was also performed for all patients.
Peak pRNFL thickness ratio, average pRNFL thickness ratio, and color code abnormalities using OCT
Two new methods were developed to evaluate the asymmetry of the superior and inferior pRNFL thicknesses using OCT. One method utilized the ratio between the two peak pRNFL thicknesses of the superior and inferior hemispheres. From the temporal-superior-nasal-inferior-temporal RNFL thickness map of OCT, the peak thickness of pRNFL in the superior and inferior hemispheres was measured in pixels using ImageJ software, version 1.48 (http://imagej.nih.gov/ij/; National Institutes of Health, Bethesda, MD, USA). Then, the shorter peak thickness was divided by the taller peak thickness, and the ratio of those two peak pRNFL thicknesses was named as the peak pRNFL thickness ratio (PTR) (Fig. 1A). The other method used the average pRNFL thicknesses of the superior and inferior quadrants from the quadrant map of OCT. The average thickness of the thinner quadrant was divided by that of the thicker quadrant, and the ratio was named as the average pRNFL thickness ratio (ATR) (Fig. 1B).
On the quadrants and clock-hour maps of Cirrus HD-OCT (Carl Zeiss Meditec), the pRNFL thickness is displayed in a color code based on a comparison with the normative database. The normal ranges were coded in green while abnormal ranges at the 5% level were colored in yellow, and abnormal ranges at the 1% level are marked in red. We considered the color code abnormal when one or more yellow or red sectors were present on the quadrants and clock-hour maps.
Statistical analysis
The optimal sample size was determined using PASS, version 12.0 (NCSS, LLC, Kaysville, UT, USA) based on the assumption that a new screening method has an area under the receiver operating characteristic (ROC) curve (AUC) of approximately 0.85.15 When the ratio of sample sizes between glaucoma and normal cases was set at 1, a minimum of 58 glaucoma subjects and 58 normal subjects were required to detect a 0.15 difference in AUCs at values >0.7 (moderate level) with a statistical power of 90% and a type I error of 5%. In addition, a minimum of 25 subjects with glaucoma and 25 normal subjects were required for validation to maintain the Training set and the Validation set at a ratio of 7:3.
Basic characteristics were compared between the glaucoma and normal groups using an independent t-test for continuous variables and chi-square test for categorical variables. ROC curves were constructed to assess the ability of each method to detect patients with early glaucoma and determine the optimal cut-off value for the PTR and ATR. AUCs were also used to represent the diagnostic ability of each method and were compared using the DeLong method. The sensitivities and specificities were compared using the McNemar test. All statistical analyses were performed using SPSS, version 20 (IBM Corp., Armonk, NY, USA) and MedCalc, version 11.1.1.0 (Med-Calc, Marakierke, Belgium).
RESULTS
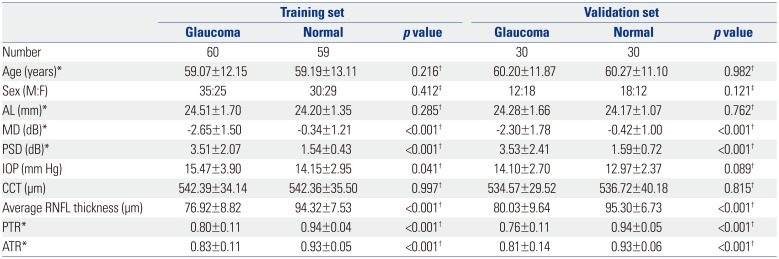
A total of 60 subjects with early glaucoma and 59 normal subjects were enrolled for the Training set, and 60 subjects (30 early glaucoma subjects and 30 normal controls) were enrolled independently for the Validation set. Table 1 shows the basic characteristics of all subjects. For both the Training and Validation sets, there were no significant differences in age, gender, or AL between the glaucoma and normal subjects. However, glaucoma subjects exhibited significantly worse MD and pattern standard deviation than the normal subjects (p<0.001), and the average RNFL thickness, mean PTR, and mean ATR were significantly lower in subjects with glaucoma than in normal subjects (p<0.001).
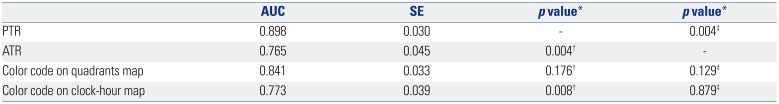
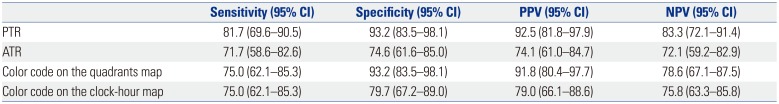
The ROC curves of the PTR and ATR were plotted, and their AUCs and cut-off values were determined (Fig. 2). For the PTR, the AUC was 0.898 and the optimal cut-off value was ≤0.8692. For the ATR, the AUC was 0.765 and the cut-off value was ≤0.8934. When the AUCs were compared, the PTR showed significantly better diagnostic ability than the ATR and the clock-hour map, while the ATR did not show better diagnostic ability than color code classifications (Table 2). The sensitivity, specificity, positive predictive value (PPV), and negative predictive value (NPV), shown in Table 3, indicate that of each method. The PTR was superior, particularly in terms of sensitivity, although there were no statistically significant differences (data not shown).
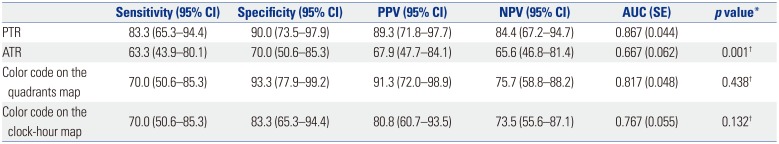
Using the cut-off values obtained from the Training set, the diagnostic abilities of the PTR and ATR for the Validation set were confirmed. Although the sensitivities, specificities, and AUCs of the PTR and ATR were slightly lower when using the cut-off values, the overall diagnostic performances of the PTR and ATR were similar to those of the Training set. The PTR also proved to be superior in diagnostic ability, as shown in sensitivity, NPV, and AUC for the Validation set (Table 4).
DISCUSSION
This study developed a simple screening method that could easily be used by general ophthalmologists using OCT. To overcome the drawbacks of the color code classification, which is widely used but is relatively inaccurate, we utilized the asymmetric nature of damage to the superior and inferior RNFL during the early stages of glaucoma.1 In our analysis, the PTR was found to potentially have a notable diagnostic value in early detection of glaucoma. The AUC of the PTR was high at approximately 0.9, and the optimal cut-off value of the PTR was approximately 0.87.
The use of asymmetry in glaucomatous damage has a clinical advantage because it largely reduces the influence of interindividual variation in factors such as age, gender, race, and several systemic factors. In addition, the asymmetry between the superior and inferior areas in the eye is less affected also by disc size, AL, and retinal vessel position. The glaucoma hemifield test of standard automated perimetry utilizes the asymmetry in sensitivity between the superior and inferior halves for glaucoma detection,1617 and there have been several attempts to detect early glaucoma, based on the asymmetry between the superior and inferior hemispheres using OCT.1819202122 Sullivan-Mee, et al.18 investigated the inter- and intra-eye asymmetries in the pRNFL and macular thickness in early glaucoma, and reported that intra-eye macular thickness asymmetry was one of the most useful parameters for the detection of early glaucoma, Um, et al.21 also reported that asymmetry in hemifield macular thickness could be an early indicator of glaucomatous damage, and Yamada, et al.22 reported that asymmetry in the ganglion cell layer showed the best diagnostic results for early glaucoma detection. Most these previous studies used the asymmetry of macular thickness rather than the pRNFL thickness, because there is less variability in the former. However, the use of asymmetry in macular thickness also has its limitations. First, the use of macular thickness asymmetry is limited when there is concurrent macular disease. As glaucoma is common in older patients, many glaucoma patients have concurrent macular disease. Second, damage outside the macular area may not be detected by macular analysis. However, to the best of our knowledge, only one study has reported so far on the diagnostic ability of asymmetry in pRNFL thickness between the superior and inferior areas.18 In contrary to our results, the pRNFL thickness asymmetry in this study showed a poor diagnostic ability when measured with AUC. This discrepancy could be explained by some methodological differences. First, we calculated the ratio of the superior to inferior pRNFL thicknesses while the previous study used the direct differences in thicknesses. It is quite likely that a ratio reflects the asymmetry better, especially in those eyes with thin pRNFL. Second, we evaluated the peak pRNFL thickness as well as the average pRNFL thickness. While the method utilizing the asymmetry in the average thickness also showed a poor diagnostic ability, the use of the peak thickness asymmetry was found to have a better diagnostic value.
The RNFL consists of ganglion cell axons, and axons from peripapillary ganglion cells run more superficially (close to the vitreous) and occupy a more central portion of the ONH than those from peripheral ganglion cells.23 Considering that glaucomatous ONH damage (such as increased cup/disc ratio, notching, and rim thinning) progresses outward from the center, more superficial pRNFL might be damaged earlier in the progression of glaucoma. In a recent study with a rat model of glaucoma, early distortion of the axonal cytoskeleton was identified near the RNFL surface.24 Although microscopic damage at the RNFL surface may not affect the RNFL thickness and could occur at any part of the RNFL, peak pRNFL thickness is likely to be the best indicator of any subtle change in RNFL. Moreover, an asymmetric change in pRNFL thickness might be present very early on regardless of whether the RNFL damage manifests as localized or diffuse change as disease progresses. Therefore, peak pRNFL thickness might be more sensitive to early glaucomatous damage than the average thickness as assessed by OCT. In our study, the PTR was superior to the ATR in its ability to diagnose early glaucoma. However, to the best of our knowledge, no previous studies have examined changes in peak pRNFL thicknesses in glaucoma, while numerous studies have investigated the association between glaucoma and average pRNFL thickness. Therefore, further investigations are needed to confirm the advantages of using peak pRNFL thickness in the detection of glaucoma.
The limitations of this study are as follows. First, the subjects were studied retrospectively and selection bias cannot fully be excluded. Nevertheless, we tried to minimize the drawback of a retrospective design by recruiting another independent group for validation. Second, because this study was performed only with Korean participants, we cannot exclude the possibility of ethnic differences. Third, the sample size was relatively small. Therefore, we calculated the optimal sample size to achieve sufficient statistical power and enrolled more subjects than the optimal sample number. Lastly, we could not provide information on refractive errors, because subjects who had undergone previous cataract surgery or refractive surgery were also included in this study. Instead, we used AL to evaluate the degree of myopia. Further studies that include data on refractive errors may be helpful in evaluating the performance of PTR in subjects with myopia.
In conclusion, the PTR is a novel, simple, and accurate method for diagnosis of early glaucoma. The PTR, together with other diagnostic tools, will improve the detection of early glaucoma in clinical practice, particularly when used by general ophthalmologists.


 XML Download