Journal List > Yonsei Med J > v.58(5) > 1032219

Kang, Choi, Kim, Lee, Ahn, Han, Lee, Roh, Yun, Park, Kang, Lee, Lee, Moon, Park, and Park: Impact of Follow-Up Ischemia on Myocardial Perfusion Single-Photon Emission Computed Tomography in Patients with Coronary Artery Disease

Abstract

Purpose

Few studies have reported on predicting prognosis using myocardial perfusion single-photon emission computed tomography (SPECT) during coronary artery disease (CAD) treatment. Therefore, we aimed to assess the clinical implications of myocardial perfusion SPECT during follow-up for CAD treatment.

Materials and Methods

We enrolled 1153 patients who had abnormal results at index SPECT and underwent follow-up SPECT at intervals ≥6 months. Major adverse cardiac events (MACE) were compared in overall and 346 patient pairs after propensity-score (PS) matching.

Results

Abnormal SPECT was associated with a significantly higher risk of MACE in comparison with normal SPECT over the median of 6.3 years (32.3% vs. 19.8%; unadjusted p<0.001). After PS matching, abnormal SPECT posed a higher risk of MACE [32.1% vs. 19.1%; adjusted hazard ratio (HR)=1.73; 95% confidence interval (CI)=1.27–2.34; p<0.001] than normal SPECT. After PS matching, the risk of MACE was still higher in patients with abnormal follow-up SPECT in the revascularization group (30.2% vs. 17.9%; adjusted HR=1.73; 95% CI=1.15–2.59; p=0.008). Low ejection fraction [odds ratio (OR)=5.33; 95% CI=3.39–8.37; p<0.001] and medical treatment (OR=2.68; 95% CI=1.93–3.72; p<0.001) were independent clinical predictors of having an abnormal result on follow-up SPECT.

Conclusion

Abnormal follow-up SPECT appears to be associated with a high risk of MACE during CAD treatment. Follow-up SPECT may play a potential role in identifying patients at high cardiovascular risk.

INTRODUCTION

Stress myocardial perfusion imaging using single-photon emission computed tomography (SPECT) is commonly used for risk stratification and therapeutic decision making in patients with coronary artery disease (CAD).123 Since ischemia is a strong predictor of adverse outcomes, such as death or myocardial infarction (MI),45 detecting ischemia is an important part of the diagnostic strategy for patients with stable CAD. In addition to the diagnostic and prognostic utility of myocardial perfusion SPECT, the extent of ischemia is one of the primary measures that drives decisions regarding revascularization.678 Patients with moderately or severely abnormal myocardial perfusion SPECT have significantly higher mortality rates if treated with medical therapy alone.57 Previous studies on myocardial perfusion SPECT have focused on the prognostic utility of stress imaging as the initial test for patients with CAD.89 However, there are only a few studies that show a relationship between the presence and severity of ischemia and prognosis during CAD treatment.101112 Therefore, according to the current guidelines and appropriate use criteria for follow-up of CAD, routine stress imaging is not recommended, except for special high-risk groups after coronary revascularization.1314 Hence, in the current study, we aimed to assess the clinical implications of serial myocardial perfusion SPECT in patients with CAD who were receiving either medication or revascularization therapy.

MATERIALS AND METHODS

Study population

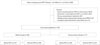
We identified consecutive patients who underwent serial myocardial perfusion SPECT, had abnormal results on a first study [which was defined as summed stress score (SSS) ≥3],15 and had follow-up adenosine stress SPECT at an interval ≥6 months between the two studies that were performed between January 1, 2000 and June 31, 2014. Patients were also excluded if they had MI <3 months before initial SPECT, previous revascularization therapy, serious non-coronary heart disease, including cancer with a life expectancy less than one year, incomplete nuclear data, multiple coronary revascularizations between the two SPECT procedures, and no clinical follow-up information. As a result, a total of 1153 patients with serial SPECT studies were included (Fig. 1). Because of the retrospective nature of the study, a waiver for individual informed consent was granted by the Institutional Review Board.

Myocardial perfusion imaging

Thallium-201 (Tl-201) SPECT was the default stress myocardial perfusion imaging used during the study period. Images were acquired with a standardized protocol.16 Adenosine was intravenously administered at a rate of 140 mcg/kg/minute for 6 min. Three minutes after the initiation of the adenosine infusion, a dose of Tl-201 (range=92.5–148 MBq, as determined by the patient's body weight) was intravenously injected. Six minutes after adenosine infusion, post-stress myocardial perfusion images were acquired using two-head gamma cameras equipped with low-energy, all-purpose collimators. The specific acquisition parameters were dependent on the camera.

Image interpretation

Semi-quantitative visual interpretation was performed by independent expert interpreters, using 17 segments for the severity and extent of abnormalities on stress imaging.17 Each segment was scored using a 5-point scoring system (0=normal; 1=equiv-ocal; 2=moderate; 3=severe reduction in radioisotope uptake; 4=absence of detectable tracer uptake in a segment), as previously described.18 The score that was summed from the stress scan was defined as the SSS: SSS was determined by adding the scores of the 17 segments on the stress images. The SPECT study was considered to be abnormal if the SSS was 3 or greater. According to the result of follow-up myocardial perfusion SPECT, patients were categorized into normal and abnormal groups.

Procedure and follow-up

Coronary angiography was recommended for patients on the basis of their clinical presentation and the results of the noninvasive stress test. Significant stenosis on coronary angiography was defined as >50% stenosis in an epicardial coronary artery. In patients with significant stenosis, the decision to perform revascularization or medical therapy was at the discretion of the individual cardiologist. Percutaneous coronary intervention (PCI)19 or coronary artery bypass graft (CABG) surgery was performed using standard techniques.20 Medical treatment was performed with a medical regimen that consisted of at least antiplatelet, antianginal, and lipid-lowering therapies.3 After index myocardial perfusion SPECT, patients received either medical treatment or revascularization treatment.

Definitions

The primary outcome of interest was the occurrence of major adverse cardiac events (MACE), which was the composite of all-cause death, nonfatal MI, or unplanned revascularization after follow-up myocardial perfusion SPECT. When patients received multiple serial myocardial perfusion SPECTs, the first follow-up SPECT with an interval of ≥6 months after the index myocardial perfusion SPECT was selected for analysis. An MI was defined as elevated cardiac enzymes (troponin I or myocardial band fraction of creatine kinase) more than the upper limit of the normal value with ischemic symptoms or electrocardiography findings that were indicative of ischemia. After follow-up myocardial perfusion SPECT, any further PCI or CABG (excluding planned staged PCI) was considered an unplanned revascularization. Death, non-fatal MI, and unplanned revascularizations were verified by reviewing medical records.

Statistical analysis

The continuous and categorical covariates are summarized as a mean±standard deviation or count (%). According to the follow-up myocardial perfusion SPECT results, all patients were divided into normal and abnormal groups. The baseline patient characteristics were compared between the two groups using the t test or Fisher exact test for continuous and categorical variables, respectively. The cumulative incidence of MACE for the normal and the abnormal groups was obtained using the Kaplan-Meier method and compared between the two groups using the log-rank test. To examine the effect of abnormal results on MACE and its individual events, the unadjusted and adjusted Cox proportional hazards regression models were fitted. Covariates that were statistically significant in univariate analysis and/or those that were clinically relevant were considered candidate variables for multivariate models. In the Cox model, the proportionality assumptions were assessed using the Scho-enfeld residual test, and no relevant violations were detected.
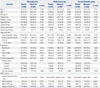
To reduce treatment selection bias and potential confounding, propensity score (PS)-matching analysis was performed. The PS of obtaining the abnormal myocardial perfusion SPECT results was estimated using the nearest-neighbor matching method with a caliper width of 0.2. The considered variables for the PS were age, sex, body mass index, hypertension, diabetes mellitus, current smoking, hyperlipidemia, prior revascularization treatment, chronic pulmonary disease, chronic renal failure, creatinine, total cholesterol, left ventricular (LV) ejection fraction <50%, and the use of beta blockers, calcium channel blockers (CCB), angiotensin converting enzyme inhibitor (ACEi), angiotensin receptor blocker (ARB) agents, or statins, which are listed in Table 1. In general, covariate balancing was considered to be achieved as long as the absolute standardized difference of the means or proportions was <0.25. In the PS analyses, no violations of covariate balancing were detected (Supplementary Fig. 1, only online). For the PS-matched cohorts, continuous variables were compared using the paired t test or the Wilcoxon signed-rank test, as appropriate, and the categorical variables were compared using the McNemar's or Bowker's test of symmetry, as appropriate. A subgroup analysis was performed according to the treatment groups. Furthermore, univariate and multivariate logistic regression analyses were performed to identify independent clinical predictors of having abnormal results on follow-up myocardial perfusion SPECT. In the multivariable logistic regression, we employed a backward variable selection approach based on the p values. The significance level for staying in the model was set to 0.05. All statistical analyses were performed using SPSS (version 19.0 software; IBM Corp., Armonk, NY, USA) and R software (version 2.13; R Foundation for Statistical Computing, Vienna, Austria; http://www.r-project.org). Additionally, the R package MatchIt was used to conduct the PS analysis.21 All tests were two-tailed, and p<0.05 was considered statistically significant.

RESULTS

Overall population

Baseline characteristics

The median follow-up interval between the index and follow-up myocardial perfusion SPECT procedures was 474 days [interquartile range (IQR)=243–1107 days]. Abnormal results on follow-up myocardial perfusion SPECT were noted in 591 patients (51.3%). The baseline clinical characteristics and myocardial perfusion SPECT results, according to the results of the follow-up myocardial perfusion SPECT procedures and treatment strategy, are presented in Table 1. The patients in the abnormal group were more likely to be male and have a higher incidence of hypertension, diabetes mellitus, and a low ejection fraction. On myocardial perfusion SPECT, the abnormal group had greater baseline perfusion defects than the normal group. The revascularization therapy group was older and more likely to have diabetes mellitus, greater extent of CAD, and high perfusion defect on the initial myocardial perfusion SPECT (Supplementary Table 1, only online).

Clinical outcomes

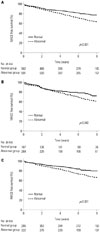
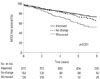
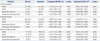
Patients were followed for a median of 6.3 years (IQR=3.7–9.1 years) after the follow-up myocardial perfusion SPECT. During the follow-up period, 188 patients died, 70 patients developed nonfatal MI, and 93 patients underwent unplanned revascularization (Table 2). The incidence of MACE was significantly higher in the abnormal group in the overall population and both treatment groups (Fig. 2), and there was also a significant difference in the clinical outcomes of patients according to the result of serial SPECT (Fig. 3). There was also a tendency for a higher risk of events in patients with abnormal follow-up SPECT in comparison with normal SPECT in all subgroups after adjustment using the multivariate Cox model, as indicated in Table 2.

Propensity-matched population

Baseline characteristics

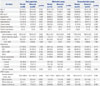
After performing PS matching, 346, 112, and 212 matched pairs of patients in the overall population, medication alone, and revascularization groups were created, respectively (Table 3). There were no significant differences in the baseline clinical characteristics of the PS-matched patients, except the extent of CAD and the results of SPECT.

Clinical outcomes

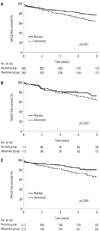
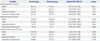
In the matched patients, there were 177 MACE events within the median follow-up period of 6.6 years. With respect to the MACE in the matched cohorts, the abnormal group was associated with worse clinical outcomes in the overall population and the revascularization groups (Fig. 4). We noted a consistent pattern in that the abnormal follow-up SPECT group was at a higher risk of MACE and its individual events than the normal group in PS-matched overall patients, medication alone and revascularization groups (Table 4).

Predictors of abnormal follow-up SPECT

Table 5 lists the independent predictors of abnormal results on follow-up SPECT. The variables considered for inclusion in the multivariate models were sex, hypertension, diabetes mellitus, body mass index ≥25 kg/m2, current smoking, chronic kidney disease, history of previous revascularization therapy, LV ejection fraction <50%, treatment with CCB, ACEi, or ARB, and the treatment method. Low ejection fraction was a predictor of abnormal follow-up SPECT, the overall population, medication alone and revascularization groups. Revascularization therapy was a protective factor of abnormal SPECT.

DISCUSSION

In the present study, we evaluated the long-term clinical implications of follow-up SPECT during CAD treatment with comparisons of the clinical outcomes between patients with normal and abnormal follow-up SPECT results. The major findings of this study included the following: 1) abnormal results on follow-up SPECT were associated with worse clinical outcomes, as indicated by an increased risk of death, MI, or unplanned revascularization in the overall study population, and 2) low ejection fraction and medical treatment were independent clinical predictors of having an abnormal result on follow-up SPECT.
Previous randomized studies of serial myocardial perfusion SPECT demonstrated significant reductions in myocardial ischemia after diverse interventions, including the administration of medical therapy or coronary revascularization.2223 In the COURAGE sub-study, residual ischemia was an unadjusted predictor of events, although the noted association was not significant when adjusted for the treatment arm.10 Recent studies have further suggested that a reduction in ischemia on myocardial perfusion SPECT with either medical or coronary revascularization therapy may identify a patient at lower risk for a subsequent cardiac event.1024 Despite the potential advantages of follow-up myocardial perfusion SPECT, clinical practice guidelines and appropriate use criteria do not recommend routine serial testing due to the lack of evidence that supports the benefit of follow-up myocardial perfusion SPECT.1325 A report suggested that >5% worsening ischemia is an independent predictor of death or MI, irrespective of the treatment arm, such as medical therapy or revascularization.26 However, these previous studies were limited by small study populations or case-control designs. Our study, despite its retrospective, single-center, observational study design, is relatively stronger, because it includes a larger study population that was treated at a real-world practice with a longer follow-up period.
The present study demonstrates that follow-up ischemia is associated with adverse outcomes, such as death, MI, and unplanned revascularization. The association between mortality and follow-up ischemia is in line with a previous study that reported that revascularization reduces mortality in patients with an ischemic burden ≥10% on baseline myocardial perfusion SPECT.727 In our study, among the overall population and the revascularization group, abnormal results on follow-up SPECT demonstrated an increased risk of MACE, death, and MI. In the medical group, abnormal SPECT was also associated with a higher risk of MACE and unplanned revascularization. Due to the observational study design, unfavorable clinical factors, such as male sex and lower LV ejection fraction, may contribute to worse clinical outcomes in patients with abnormal follow-up SPECT. However, consistent findings after rigorous adjustment with PS matching support our hypothesis that the prognostic benefit of baseline myocardial perfusion SPECT could be applied to follow-up perfusion SPECT in order to predict long-term clinical prognosis. These results indicate that serial myocardial SPECT after receiving either medication alone or revascularization therapy may be helpful for predicting prognosis and subsequently determining the need for more aggressive treatment.
According to current guidelines, myocardial perfusion SPECT is considered appropriate when symptom recurrence, suspected incomplete revascularization, or ≥5 years after CABG.1328 Therefore, it is of interest to select appropriate patients who can receive myocardial SPECT as a risk assessment modality when they demonstrate the ambiguous presentation of symptoms. Our present findings indicate that abnormal myocardial SPECT results are common in patients with low LV ejection fraction and treatment with medication only. These factors may be indirectly associated with abnormal follow-up SPECT due to the risk of revascularization or decompensated symptoms of CAD.2930 Therefore, our analysis implies that patients with the risk factors for abnormal SPECT are potential candidates who could benefit from receiving follow-up SPECT in order to determine the appropriate treatment strategy.
Our study had some limitations. This was a single-center, observational, retrospective study with the biases that are inherent to this type of analysis. There were also significant baseline differences between patients with normal and abnormal follow-up myocardial SPECT. In addition, patients did not routinely receive serial myocardial perfusion SPECT; rather SPECT was performed at the discretion of the individual physician. Even after statistical adjustment therefore, unobserved confounders might have influenced the results. However, the patients in this study may be representative of a real-world population in daily clinical practice. Finally, due to the small study population, an ischemic threshold on follow-up SPECT for determining clinical prognosis was not evaluated.
In conclusion, abnormal follow-up SPECT results appear to have prognostic implications during CAD treatment in patients receiving either medication alone or revascularization therapy.

Figures and Tables

Fig. 1

Patient flow. CAD, coronary artery disease; MI, myocardial infarction; SPECT, single-photon emission computed tomography.

ymj-58-934-g001
Fig. 2

Kaplan-Meier curves of the cumulative incidence of MACE in patients with normal follow-up SPECT (solid line) versus abnormal followup SPECT (dashed line) in the (A) overall population, (B) medication group, and (C) revascularization group. MACE, major adverse cardiac events; SPECT, single-photon emission computed tomography.

ymj-58-934-g002
Fig. 3

Kaplan-Meier curves of the cumulative incidence of MACE in patients with improved (black solid line), no change (dashed line), and worsened (gray solid line) in the result of serial SPECT. MACE, major adverse cardiac events; SPECT, single-photon emission computed tomography.

ymj-58-934-g003
Fig. 4

Kaplan-Meier curves of the cumulative incidence of MACE in patients with normal follow-up SPECT (solid line) versus abnormal followup SPECT (dashed line) in the (A) overall population, (B) medication group, and (C) revascularization group in the PS-matched population. MACE, major adverse cardiac events; SPECT, single-photon emission computed tomography; PS, propensity score.

ymj-58-934-g004
Table 1

Baseline Characteristics of the Study Patients with Normal and Abnormal Follow-Up SPECT Results

ymj-58-934-i001
Variables Total population Medication group Revascularization group
Normal (n=562) Abnormal (n=591) p value Normal (n=167) Abnormal (n=269) p value Normal (n=395) Abnormal (n=322) p value
Age, yr 61.4±9.6 61.7±10.0 0.564 61.6±10.4 61.1±10.3 0.611 61.3±9.3 62.2±9.8 0.191
Male 380 (67.6) 435 (73.6) 0.030 110 (65.9) 199 (74.0) 0.089 270 (68.4) 236 (73.3) 0.174
BMI, kg/m2 25.1±3.0 25.2±3.5 0.447 25.3±2.9 25.0±3.8 0.421 25.0±3.0 25.4±3.3 0.109
Hypertension 340 (60.5) 395 (66.8) 0.030 98 (58.7) 191 (71.0) 0.011 242 (61.3) 204 (63.4) 0.620
Diabetes mellitus 179 (31.9) 233 (39.4) 0.009 44 (26.3) 94 (34.9) 0.077 135 (34.2) 139 (43.2) 0.017
Hyperlipidemia 201 (35.8) 207 (35.0) 0.841 59 (35.3) 110 (40.9) 0.290 142 (35.9) 97 (30.1) 0.117
Current smoker 162 (28.8) 184 (31.1) 0.149 54 (32.3) 83 (30.9) 0.770 108 (27.3) 101 (31.4) 0.482
Chronic renal failure 23 (4.1) 33 (5.6) 0.298 13 (7.8) 25 (9.3) 0.713 10 (2.5) 8 (2.5) 1.000
Chronic lung disease 15 (2.7) 10 (1.7) 0.349 9 (5.4) 7 (2.6) 0.214 6 (1.5) 3 (0.9) 0.715
Laboratory data
 Total cholesterol, mg/dL 180.6±42.5 181.2±41.2 0.801 182.1±40.2 181.2±38.9 0.825 178.0±43.4 181.2±43.0 0.703
 Serum creatinine, mg/dL 1.1±1.0 1.3±1.7 0.009 1.2±1.2 1.5±2.2 0.071 1.1±0.9 1.2±1.2 0.217
 LV EF, % 59.0±8.1 53.1±11.6 <0.001 57.5±8.6 53.0±11.6 <0.001 59.7±7.8 53.2±11.7 <0.001
  LV EF <50% 36 (6.4) 175 (29.6) <0.001 13 (7.8) 78 (29.0) <0.001 23 (5.8) 97 (30.1) <0.001
Medications
 Beta-blocker 424 (75.4) 464 (78.5) 0.243 116 (69.5) 208 (77.3) 0.087 308 (78.0) 256 (79.5) 0.685
 CCB 512 (91.1) 489 (82.7) <0.001 126 (75.4) 192 (71.4) 0.412 386 (97.7) 297 (92.2) 0.001
 ACEi or ARB 164 (29.2) 280 (47.4) <0.001 53 (31.7) 138 (51.3) <0.001 111 (28.1) 142 (44.1) <0.001
 Statin 340 (60.5) 339 (57.4) 0.307 55 (32.9) 116 (43.1) 0.044 285 (72.2) 223 (69.3) 0.443
Coronary angiography 463 (82.4) 442 (74.8) 0.002 91 (54.5) 144 (53.5) 0.923 398 (100.0) 324 (100.0) 1.000
 Disease extent <0.001 <0.001 <0.001
  1 vessel 129 (23.0) 105 (17.8) 24 (14.4) 49 (18.2) 85 (21.4) 56 (17.4)
  2 vessel 111 (19.8) 110 (18.6) 16 (9.6) 39 (14.5) 95 (23.9) 71 (22.0)
  3 vessel 207 (36.8) 229 (38.7) 11 (6.6) 35 (13.0) 196 (49.2) 194 (60.2)
 Left main disease 83 (14.8) 72 (12.2) 0.048 3 (1.8) 4 (1.5) 0.365 80 (20.3) 68 (21.1) 0.520
SPECT results
 Interval between 2 tests, days 734.2±723.9 817.6±705.7 0.048 1237.0±802.2 1082.8±724.8 0.039 521.6±567.9 596.1±607.1 0.091
 SSS at baseline 8.3±4.3 9.9±5.2 <0.001 7.2±4.0 8.2±4.2 0.011 8.8±4.4 11.3±5.4 <0.001
 SSS at follow-up 0.8±1.2 7.8±3.9 <0.001 0.9±1.2 7.6±3.7 <0.001 0.8±1.1 8.0±4.0 <0.001
 Angina at follow-up 114 (20.3) 124 (21.0) 0.770 41 (24.6) 61 (22.7) 0.653 73 (18.5) 63 (19.0) 0.713

ACEi, angiotensin converting enzyme inhibitor; ARB, angiotensin receptor blocker; BMI, body-mass index; CCB, calcium channel blocker; LV EF, left ventricular ejection fraction; SPECT, single-photon emission computed tomography; SSS, summed stress score.

Values are presented as a n (%) or mean±SD.

Table 2

Clinical Outcomes in Patients with Abnormal Follow-Up SPECT in Comparison with Normal SPECT in the Overall Population

ymj-58-934-i002
Variables Normal Abnormal Unadjusted HR (95% CI) p value Adjusted HR (95% CI)* p value
Overall population
 MACE 111 (19.8) 191 (32.3) 1.735 (1.373−2.193) <0.001 1.595 (1.249−2.038) <0.001
 Death 74 (13.2) 114 (19.3) 1.472 (1.098−1.972) 0.010 1.235 (0.907−1.681) 0.180
 Myocardial infarction 22 (3.9) 48 (8.1) 2.114 (1.276−3.502) 0.004 1.697 (0.997−2.888) 0.051
 Unplanned revascularization 37 (6.6) 56 (9.5) 1.477 (0.975−2.237) 0.066 1.634 (1.060−2.517) 0.026
Medication group
 MACE 36 (21.6) 87 (32.3) 1.492 (1.012−2.201) 0.044 1.472 (0.979−2.211) 0.063
 Death 32 (19.2) 54 (20.1) 0.974 (0.629−1.509) 0.907 0.978 (0.616−1.550) 0.923
 Myocardial infarction 5 (3.0) 23 (8.6) 2.667 (1.013−7.021) 0.047 2.134 (0.770−5.915) 0.145
 Unplanned revascularization 5 (3.0) 20 (7.4) 2.309 (0.864−6.168) 0.095 2.118 (0.764−5.872) 0.149
Revascularization group§
 MACE 75 (19.0) 104 (32.3) 1.772 (1.316−2.384) <0.001 1.662 (1.218−2.269) 0.001
 Death 42 (10.6) 60 (18.6) 1.720 (1.159−2.552) 0.007 1.409 (0.930−2.133) 0.106
 Myocardial infarction 17 (4.3) 25 (7.8) 1.791 (0.967−3.317) 0.064 1.613 (0.847−3.072) 0.146
 Unplanned revascularization 32 (8.1) 36 (11.2) 1.414 (0.878−2.277) 0.154 1.602 (0.980−2.620) 0.060

ACEi, angiotensin converting enzyme inhibitor; ARB, angiotensin receptor blocker; CI, confidence interval; HR, hazard ratio; MACE, major adverse cardiac events; SPECT, single-photon emission computed tomography.

*The adjusted covariates included age, diabetes mellitus, chronic renal failure, chronic lung disease, use of ACEi or ARB, use of statins, and left ventricular ejection <50%, Nomal: n=562, abnormal: n=591, Nomal: n=167, abnormal: n=269, §Nomal: n=395, abnormal: n=322.

Table 3

Baseline Characteristics between the Patients with Normal and Abnormal Follow-Up SPECT Results in the Propensity Score-Matched Population

ymj-58-934-i003
Variables Total population Medication group Revascularization group
Normal (n=346) Abnormal (n=346) p value Normal (n=112) Abnormal (n=112) p value Normal (n=212) Abnormal (n=212) p value
Age, yr 61.8±9.2 61.8±9.6 0.952 60.5±10.6 61.5±9.4 0.480 61.0±9.5 62.4±10.0 0.140
Male 389 (70.1) 404 (72.8) 0.340 74 (66.1) 74 (66.1) 1.000 148 (69.8) 144 (67.9) 0.753
BMI, kg/m2 25.1±2.8 25.2±3.0 0.880 25.3±2.5 25.2±3.1 0.698 24.9±3.2 25.1±2.9 0.477
Hypertension 217 (62.7) 216 (62.4) 1.000 68 (60.7) 78 (69.6) 0.207 132 (62.3) 138 (65.1) 0.614
Diabetes mellitus 112 (32.4) 119 (34.4) 0.629 28 (25.0) 29 (25.9) 1.000 77 (36.3) 82 (38.7) 0.688
Hyperlipidemia 119 (34.4) 113 (32.7) 0.687 39 (34.8) 42 (37.5) 0.781 66 (31.1) 66 (31.1) 1.000
Current smoker 93 (27.5) 97 (29.0) 0.723 38 (33.9) 33 (29.5) 0.712 67 (31.8) 59 (27.8) 0.438
Chronic renal failure 14 (4.0) 12 (3.5) 0.842 9 (8.0) 7 (6.2) 0.795 3 (1.4) 4 (1.9) 1.000
Chronic lung disease 8 (2.3) 7 (2.0) 1.000 8 (7.1) 3 (2.7) 0.216 2 (0.9) 3 (1.4) 1.000
Laboratory data
 Total cholesterol, mg/dL 183.0±42.1 182.6±42.7 0.902 185.2±40.4 181.6±34.9 0.480 179.5±44.0 180.9±43.8 0.739
 Serum creatinine, mg/dL 1.1±0.0 1.1±1.1 0.876 1.2±1.3 1.1±1.2 0.663 1.1±1.1 1.1±1.1 0.872
 LV EF, % 59.2±8.4 58.3±7.9 0.170 58.5±8.0 59.2±6.7 0.496 58.9±7.9 58.2±7.7 0.297
  LV EF <50% 24 (6.9) 23 (6.6) 1.000 7 (6.2) 5 (4.5) 0.767 17 (8.0) 18 (8.5) 1.000
Medications
 Beta-blocker 271 (78.3) 272 (78.6) 1.000 80 (71.4) 84 (75.0) 0.651 168 (79.2) 172 (81.1) 0.715
 CCB 313 (90.5) 301 (87.0) 0.186 85 (75.9) 84 (75.0) 1.000 206 (97.2) 202 (95.3) 0.445
 ACEi or ARB 108 (31.2) 98 (28.3) 0.454 29 (25.9) 30 (26.8) 1.000 74 (34.9) 64 (30.2) 0.351
 Statin 200 (57.8) 199 (57.5) 1.000 34 (30.4) 29 (25.9) 0.552 144 (67.9) 146 (68.9) 0.917
Coronary angiography 292 (84.4) 288 (83.2) 0.757 67 (59.8) 69 (61.6) 0.891 196 (92.5) 196 (92.5) 1.000
 Disease extent 0.016 0.008 0.025
  1 vessel 63 (18.2) 43 (12.4) 19 (17.0) 21 (18.8) 42 (19.8) 22 (10.4)
  2 vessel 67 (19.4) 75 (21.7) 13 (11.6) 19 (17.0) 52 (24.5) 46 (21.7)
  3 vessel 136 (39.3) 152 (43.9) 9 (8.0) 19 (17.0) 102 (48.1) 127 (59.9)
 Left main disease 51 (14.7) 47 (13.6) 0.893 3 (2.7) 2 (1.8) 0.327 37 (17.5) 41 (19.3) 0.854
SPECT results
 Intervals between 2 tests, days 728.6±699.0 752.7±657.5 0.640 1230.1±794.9 1056.6±713.0 0.087 507.8±612.9 617.7±577.9 0.058
 SSS at baseline 8.1±4.0 9.3±4.9 <0.001 7.0±3.6 7.4±3.6 0.367 8.8±4.5 10.7±5.0 0
 SSS at follow-up 0.8±1.1 7.3±3.7 <0.001 0.7±1.1 6.5±2.8 <0.001 0.8±1.2 7.4±3.7 0
 Angina at follow-up 71 (20.5) 77 (22.3) 0.643 30 (26.8) 26 (23.2) 0.643 42 (19.8) 48 (22.6) 0.553

ACEi, angiotensin converting enzyme inhibitor; ARB, angiotensin receptor blocker; BMI, body-mass index; CCB, calcium channel blocker; LV EF, left ventricular ejection fraction; SPECT, single-photon emission computed tomography; SSS, summed stress score.

Values are presented as a n (%) or mean±SD.

Table 4

Clinical Outcomes in Patients with Abnormal Follow-Up SPECT Compared with Normal SPECT in a Propensity-Matched Population

ymj-58-934-i004
Variables Normal group Abnormal group Adjusted HR* (95% CI) p value
Overall population (346 pairs)
 MACE 66 (19.1) 111 (32.1) 1.727 (1.273−2.344) <0.001
 Death 44 (12.7) 59 (17.1) 1.230 (0.830−1.821) 0.302
 Myocardial infarction 15 (4.3) 26 (7.5) 1.694 (0.896−3.202) 0.105
 Unplanned revascularization 25 (7.2) 38 (11.0) 1.566 (0.945−2.595) 0.082
Medication group (112 pairs)
 MACE 25 (22.3) 34 (30.4) 1.374 (0.801−2.358) 0.248
 Death 22 (19.6) 17 (15.2) 0.701 (0.359−1.367) 0.297
 Myocardial infarction 3 (2.7) 12 (10.7) 5.370 (1.401−20.583) 0.014
 Unplanned revascularization 5 (4.5) 8 (7.1) 1.488 (0.457−4.842) 0.509
Revascularization group (212 pairs)
 MACE 38 (17.9) 64 (30.2) 1.730 (1.154−2.594) 0.008
 Death 22 (10.4) 32 (15.1) 1.274 (0.734−2.208) 0.389
 Myocardial infarction 7 (3.3) 15 (7.1) 2.094 (0.850−5.160) 0.108
 Unplanned revascularization 18 (8.5) 27 (12.7) 1.571 (0.863−2.861) 0.140

ACEi, angiotensin converting enzyme inhibitor; ARB, angiotensin receptor blocker; CI, confidence interval; HR, hazard ratio; MACE, major adverse cardiac events; SPECT, single-photon emission computed tomography.

*Adjusted covariates included age, diabetes mellitus, chronic renal failure, chronic lung disease, use of ACEi or ARB, use of statin, and left ventricular ejection <50%; adjusted HRs represent the risk of each clinical outcome comparing abnormal follow-up SPECT with normal follow-up SPECT.

Table 5

Independent Predictors of an Abnormal Follow-Up SPECT*

ymj-58-934-i005
Variables Revascularization group Revascularization group Revascularization group
OR 95% CI p value OR 95% CI p value OR 95% CI p value
Male 1.342 0.968−1.860 0.077 2.147 1.133−4.069 0.019 1.161 0.788−1.710 0.449
BMI ≥25 kg/m2 1.124 0.851−1.486 0.410 0.854 0.499−1.464 0.567 1.262 0.905−1.759 0.170
LV EF <50% 5.330 3.393−8.374 <0.001 3.499 1.462−8.373 0.005 6.041 3.558−10.256 <0.001
ACEi or ARB 1.240 0.905−1.699 0.181 1.352 0.735−2.485 0.332 1.234 0.847−1.796 0.273
Medical therapy 2.683 1.934−3.721 <0.001 - - - - - -

ACEi, angiotensin converting enzyme inhibitor; ARB, angiotensin receptor blocker; BMI, body-mass index; CI, confidence interval; LV EF, left ventricular ejection fraction; OR, odds ratio; SPECT, single-photon emission computed tomography.

*Adjusted covariates included male sex, hypertension, diabetes mellitus, current smoking, chronic renal failure, BMI ≥25 kg/m2, LV EF <50%, treatment with ACEi or ARB, and medication therapy.

ACKNOWLEDGEMENTS

This study was partly supported by a grant from the Korea Healthcare Technology R&D Project, Ministry of Health and Welfare, Republic of Korea (HI14C0517 and HI15C1790).

Notes

The authors have no financial conflicts of interest.

References

1. Shaw LJ, Hage FG, Berman DS, Hachamovitch R, Iskandrian A. Prognosis in the era of comparative effectiveness research: where is nuclear cardiology now and where should it be? J Nucl Cardiol. 2012; 19:1026–1043.
crossref
2. Hachamovitch R, Hayes SW, Friedman JD, Cohen I, Berman DS. Stress myocardial perfusion single-photon emission computed tomography is clinically effective and cost effective in risk stratification of patients with a high likelihood of coronary artery disease (CAD) but no known CAD. J Am Coll Cardiol. 2004; 43:200–208.
crossref
3. Fihn SD, Gardin JM, Abrams J, Berra K, Blankenship JC, Dallas AP, et al. 2012 ACCF/AHA/ACP/AATS/PCNA/SCAI/STS guideline for the diagnosis and management of patients with stable ischemic heart disease: a report of the American College of Cardiology Foundation/American Heart Association task force on practice guidelines, and the American College of Physicians, American Association for Thoracic Surgery, Preventive Cardiovascular Nurses Association, Society for Cardiovascular Angiography and Interventions, and Society of Thoracic Surgeons. Circulation. 2012; 126:e354–e471.
4. Hachamovitch R, Berman DS, Kiat H, Cohen I, Cabico JA, Friedman J, et al. Exercise myocardial perfusion SPECT in patients without known coronary artery disease: incremental prognostic value and use in risk stratification. Circulation. 1996; 93:905–914.
crossref
5. Hachamovitch R, Berman DS, Shaw LJ, Kiat H, Cohen I, Cabico JA, et al. Incremental prognostic value of myocardial perfusion single photon emission computed tomography for the prediction of cardiac death: differential stratification for risk of cardiac death and myocardial infarction. Circulation. 1998; 97:535–543.
crossref
6. Farzaneh-Far A, Borges-Neto S. Ischemic burden, treatment allocation, and outcomes in stable coronary artery disease. Circ Cardiovasc Imaging. 2011; 4:746–753.
crossref
7. Hachamovitch R, Hayes SW, Friedman JD, Cohen I, Berman DS. Comparison of the short-term survival benefit associated with revascularization compared with medical therapy in patients with no prior coronary artery disease undergoing stress myocardial perfusion single photon emission computed tomography. Circulation. 2003; 107:2900–2907.
crossref
8. Hachamovitch R, Rozanski A, Hayes SW, Thomson LE, Germano G, Friedman JD, et al. Predicting therapeutic benefit from myocardial revascularization procedures: are measurements of both resting left ventricular ejection fraction and stress-induced myocardial ischemia necessary? J Nucl Cardiol. 2006; 13:768–778.
crossref
9. Dagenais GR, Lu J, Faxon DP, Bogaty P, Adler D, Fuentes F, et al. Prognostic impact of the presence and absence of angina on mortality and cardiovascular outcomes in patients with type 2 diabetes and stable coronary artery disease: results from the BARI 2D (Bypass Angioplasty Revascularization Investigation 2 Diabetes) trial. J Am Coll Cardiol. 2013; 61:702–711.
crossref
10. Shaw LJ, Berman DS, Maron DJ, Mancini GB, Hayes SW, Hartigan PM, et al. Optimal medical therapy with or without percutaneous coronary intervention to reduce ischemic burden: results from the clinical outcomes utilizing revascularization and aggressive drug evaluation (COURAGE) trial nuclear substudy. Circulation. 2008; 117:1283–1291.
11. Zellweger MJ, Fahrni G, Ritter M, Jeger RV, Wild D, Buser P, et al. Prognostic value of “routine” cardiac stress imaging 5 years after percutaneous coronary intervention: the prospective long-term observational BASKET (Basel Stent Kosteneffektivitäts Trial) LATE IMAGING study. JACC Cardiovasc Interv. 2014; 7:615–621.
crossref
12. Schepis T, Benz K, Haldemann A, Kaufmann PA, Schmidhauser C, Frielingsdorf J. Prognostic value of stress-gated 99m-technetium SPECT myocardial perfusion imaging: risk stratification of patients with multivessel coronary artery disease and prior coronary revascularization. J Nucl Cardiol. 2013; 20:755–762.
crossref
13. Fox K, Garcia MA, Ardissino D, Buszman P, Camici PG, Crea F, et al. Guidelines on the management of stable angina pectoris: executive summary: the task force on the management of stable angina pectoris of the European Society of Cardiology. Eur Heart J. 2006; 27:1341–1381.
crossref
14. Hendel RC, Berman DS, Di Carli MF, Heidenreich PA, Henkin RE, Pellikka PA, et al. ACCF/ASNC/ACR/AHA/ASE/SCCT/SCMR/SNM 2009 appropriate use criteria for cardiac radionuclide imaging: a report of the American College of Cardiology Foundation Appropriate Use Criteria Task Force, the American Society of Nuclear Cardiology, the American College of Radiology, the American Heart Association, the American Society of Echocardiography, the Society of Cardiovascular Computed Tomography, the Society for Cardiovascular Magnetic Resonance, and the Society of Nuclear Medicine. J Am Coll Cardiol. 2009; 53:2201–2229.
15. Zellweger MJ, Kaiser C, Jeger R, Brunner-La Rocca HP, Buser P, Bader F, et al. Coronary artery disease progression late after successful stent implantation. J Am Coll Cardiol. 2012; 59:793–799.
crossref
16. Kim YH, Ahn JM, Park DW, Song HG, Lee JY, Kim WJ, et al. Impact of ischemia-guided revascularization with myocardial perfusion imaging for patients with multivessel coronary disease. J Am Coll Cardiol. 2012; 60:181–190.
crossref
17. Aepfelbacher FC, Johnson RB, Schwartz JG, Chen L, Parker RA, Parker JA, et al. Validation of a model of left ventricular segmentation for interpretation of SPET myocardial perfusion images. Eur J Nucl Med. 2001; 28:1624–1629.
crossref
18. Cerqueira MD, Weissman NJ, Dilsizian V, Jacobs AK, Kaul S, Laskey WK, et al. Standardized myocardial segmentation and nomenclature for tomographic imaging of the heart. A statement for healthcare professionals from the Cardiac Imaging Committee of the Council on Clinical Cardiology of the American Heart Association. Circulation. 2002; 105:539–542.
crossref
19. Levine GN, Bates ER, Blankenship JC, Bailey SR, Bittl JA, Cercek B, et al. 2011 ACCF/AHA/SCAI guideline for percutaneous coronary intervention: executive summary: a report of the American College of Cardiology Foundation/American Heart Association Task Force on Practice Guidelines and the Society for Cardiovascular Angiography and Interventions. Circulation. 2011; 124:2574–2609.
crossref
20. Hillis LD, Smith PK, Anderson JL, Bittl JA, Bridges CR, Byrne JG, et al. 2011 ACCF/AHA guideline for coronary artery bypass graft surgery: a report of the American College of Cardiology Foundation/American Heart Association Task Force on Practice Guidelines. Circulation. 2011; 124:e652–e735.
21. Ho D, Imai K, King G, Stuart EA. MatchIt: nonparametric preprocessing for parametric causal inference. J Stat Softw. 2011; 42:1–28.
22. Mahmarian JJ, Dakik HA, Filipchuk NG, Shaw LJ, Iskander SS, Ruddy TD, et al. An initial strategy of intensive medical therapy is comparable to that of coronary revascularization for suppression of scintigraphic ischemia in high-risk but stable survivors of acute myocardial infarction. J Am Coll Cardiol. 2006; 48:2458–2467.
crossref
23. Dakik HA, Kleiman NS, Farmer JA, He ZX, Wendt JA, Pratt CM, et al. Intensive medical therapy versus coronary angioplasty for suppression of myocardial ischemia in survivors of acute myocardial infarction: a prospective, randomized pilot study. Circulation. 1998; 98:2017–2023.
crossref
24. Schwartz RG, Pearson TA, Kalaria VG, Mackin ML, Williford DJ, Awasthi A, et al. Prospective serial evaluation of myocardial perfusion and lipids during the first six months of pravastatin therapy: coronary artery disease regression single photon emission computed tomography monitoring trial. J Am Coll Cardiol. 2003; 42:600–610.
crossref
25. Klocke FJ, Baird MG, Lorell BH, Bateman TM, Messer JV, Berman DS, et al. ACC/AHA/ASNC guidelines for the clinical use of cardiac radionuclide imaging--executive summary: a report of the American College of Cardiology/American Heart Association Task Force on Practice Guidelines (ACC/AHA/ASNC Committee to Revise the 1995 Guidelines for the Clinical Use of Cardiac Radionuclide Imaging). J Am Coll Cardiol. 2003; 42:1318–1333.
crossref
26. Farzaneh-Far A, Phillips HR, Shaw LK, Starr AZ, Fiuzat M, O'Connor CM, et al. Ischemia change in stable coronary artery disease is an independent predictor of death and myocardial infarction. JACC Cardiovasc Imaging. 2012; 5:715–724.
crossref
27. Zellweger MJ, Hachamovitch R, Kang X, Hayes SW, Friedman JD, Germano G, et al. Threshold, incidence, and predictors of prognostically high-risk silent ischemia in asymptomatic patients without prior diagnosis of coronary artery disease. J Nucl Cardiol. 2009; 16:193–200.
crossref
28. Gibbons RJ, Abrams J, Chatterjee K, Daley J, Deedwania PC, Douglas JS, et al. ACC/AHA 2002 guideline update for the management of patients with chronic stable angina--summary article: a report of the American College of Cardiology/American Heart Association Task Force on practice guidelines (Committee on the Management of Patients With Chronic Stable Angina). J Am Coll Cardiol. 2003; 41:159–168.
crossref
29. Yancy CW, Jessup M, Bozkurt B, Butler J, Casey DE Jr, Drazner MH, et al. 2013 ACCF/AHA guideline for the management of heart failure: executive summary: a report of the American College of Cardiology Foundation/American Heart Association Task Force on practice guidelines. Circulation. 2013; 128:1810–1852.
crossref
30. McMurray JJ, Adamopoulos S, Anker SD, Auricchio A, Böhm M, Dickstein K, et al. ESC guidelines for the diagnosis and treatment of acute and chronic heart failure 2012: the Task Force for the Diagnosis and Treatment of Acute and Chronic Heart Failure 2012 of the European Society of Cardiology. Developed in collaboration with the Heart Failure Association (HFA) of the ESC. Eur Heart J. 2012; 33:1787–1847.

SUPPLEMENTARY MATERIALS

Supplementary Table 1

Baseline Characteristics According the Treatment Groups

Supplementary Fig. 1

Distribution of propensity scores and standardized differences in the mean or proportion of variables before and after matching. (A, B, and C). Distribution of propensity scores before and after propensity score matching. (D, E, and F). Standardized differences in the mean or proportion of variables before and after propensity score matching. Each circle indicates the individual covariates in the propensity score model, and each line indicates how they changed after propensity score matching.
TOOLS
Similar articles