Severe fever with thrombocytopenia syndrome (SFTS) is a tick-born hemorrhagic fever caused by a novel
Phlebovirus of the
Bunyaviridae family termed the SFTS virus. Since 2009, more than 3500 SFTS cases have been reported in China, Korea, and Japan.
1 SFTS varies widely in severity, ranging from inapparent infection to self-limiting febrile illness or death.
2 The average fatality rate of SFTS cases in China was reported at 12%, although it reached 30% in some areas.
34 In Korea, the fatality rate is approximately 30%.
5 Due to both a high fatality rate and lack of a specific treatment, SFTS has become a major public health threat in endemic areas.
A previous report described successful treatment of two patients with SFTS who progressed rapidly to multiple organ dysfunction (MOD) with plasma exchange (PE) and ribavirin.
6 Since then, PE alone or PE combined with ribavirin has occasionally been used to treat rapidly progressing SFTS in some Korean hospitals. In the present study, we collected data on all SFTS cases from these hospitals and compared the clinical outcomes between PE-treated patients (PE group) and non-treated patients (non-PE group).
This retrospective cohort study was conducted at nine Korean hospitals. All consecutive patients aged >18 years who presented with new-onset fever and had a documented SFTS virus infection between May 2013 and August 2015 were included in the study. SFTS virus infection was confirmed by reverse transcription polymerase chain reaction, which was performed according to a standardized protocol at the Korean Center for Disease Control and Prevention.
7 Implementation of therapeutic modalities including PE was determined according to the clinical judgment of the responsible physician(s). PE was performed using fresh-frozen plasma as a plasma substitute: the volume given was determined in accordance with the patient's height, weight, and hematocrit level. Data on demographics, comorbidities, clinical features, laboratory findings, severity indices of illness, treatments, and outcomes were collected by reviewing the patients' medical records. Comorbidities included cardiovascular, pulmonary, hepatobiliary, connective tissue, neuromuscular disorders, malignancy, immunosuppression, and diabetes mellitus. The primary outcome was in-hospital mortality. Secondary outcomes included 30-day survival and the length of intensive care unit (ICU) or hospital stay.
Continuous variables were compared using Student's t-test, the Mann-Whitney U-test, or the Kruskal-Wallis test. Categorical variables were compared using Pearson's χ2 test or Fisher's exact test. The Kaplan-Meier method was used to estimate the cumulative probability of survival in SFTS patients, and the log-rank test was employed to compare 30-day survival between treatment groups. To identify risk factors associated with 30-day mortality, univariate and multivariate analyses were performed using a Cox proportional hazards model, and the results are presented as hazard ratios (HRs) and 95% confidence intervals (CIs). IBM SPSS Statistics version 22 (IBM Corporation, Somers, NY, USA) was used for all statistical analyses. Two-tailed p values <0.05 were considered to indicate statistical significance.
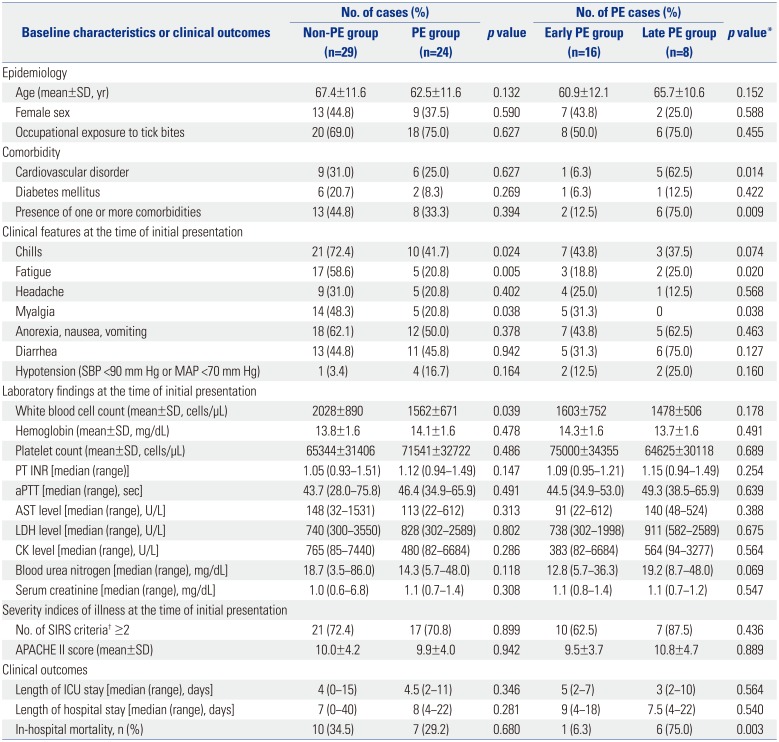
A total of 53 patients confirmed as having SFTS virus infection between May 2013 and August 2015 were included: 24 (45.3%) PE cases and 29 (54.7%) non-PE cases (
Table 1). At the time of initial presentation, chills, fatigue, and myalgia were more common in the non-PE group (all
p<0.05), whereas the mean white blood cell count was lower in the PE group (
p=0.039). There were no significant differences in other baseline characteristics between the two groups. In the PE group, the median interval from symptom onset to implementation of PE was 6 days (range 3–18 days). The median volume of plasma substitute was 2491 mL/session (range 815–8238 mL/session), and the median number of PE sessions was three (range 1–5). The overall in-hospital mortality rate was 32.1% (17/53). Multiple organ failure (8 cases) was the most common cause of death, followed by shock (3 cases), acute coronary syndrome (2 cases), hemorrhage (1 case), and other causes (3 cases). The in-hospital mortality rate did not differ between the PE and non-PE groups [29.3% vs. 34.5%, relative risk (RR) 0.846, 95% CI 0.380–1.883,
p=0.680]. Survival did not differ between the PE and non-PE groups (mean survival time 24.0 days vs. 22.6 days,
p=0.622 by log-rank test) (
Fig. 1A). There were no significance differences in the length of the ICU or hospital stay (
p=0.281 and 0.680, respectively).
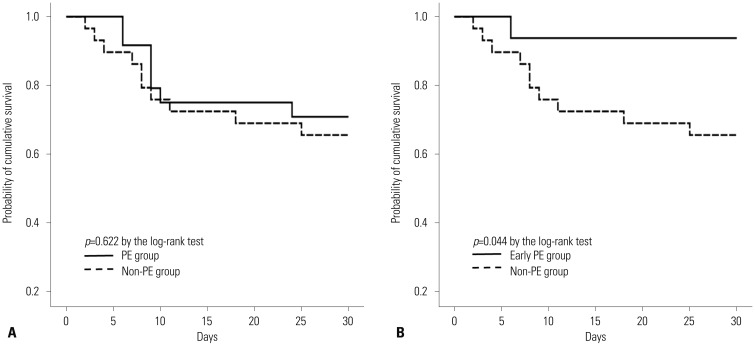 | Fig. 1Comparison of 30-day survival between treatment groups. (A) PE group vs. non-PE group. There was no significant difference in 30-day survival between the two groups (mean survival time 24.0 days vs. 22.6 days, p=0.622 by the log-rank test). (B) Early PE group vs. non-PE group. Survival was longer in the early PE group than in the non-PE group (mean survival time 28.4 days vs. 22.6 days, p=0.044 by the log-rank test). PE, plasma exchange.
|
Table 1
Baseline Characteristics and Clinical Outcomes between Treatment Groups
|
Baseline characteristics or clinical outcomes |
No. of cases (%) |
p value |
No. of PE cases (%) |
p value*
|
|
Non-PE group (n=29) |
PE group (n=24) |
Early PE group (n=16) |
Late PE group (n=8) |
|
Epidemiology |
|
|
|
|
|
|
|
Age (mean±SD, yr) |
67.4±11.6 |
62.5±11.6 |
0.132 |
60.9±12.1 |
65.7±10.6 |
0.152 |
|
Female sex |
13 (44.8) |
9 (37.5) |
0.590 |
7 (43.8) |
2 (25.0) |
0.588 |
|
Occupational exposure to tick bites |
20 (69.0) |
18 (75.0) |
0.627 |
8 (50.0) |
6 (75.0) |
0.455 |
|
Comorbidity |
|
|
|
|
|
|
|
Cardiovascular disorder |
9 (31.0) |
6 (25.0) |
0.627 |
1 (6.3) |
5 (62.5) |
0.014 |
|
Diabetes mellitus |
6 (20.7) |
2 (8.3) |
0.269 |
1 (6.3) |
1 (12.5) |
0.422 |
|
Presence of one or more comorbidities |
13 (44.8) |
8 (33.3) |
0.394 |
2 (12.5) |
6 (75.0) |
0.009 |
|
Clinical features at the time of initial presentation |
|
|
|
|
|
|
|
Chills |
21 (72.4) |
10 (41.7) |
0.024 |
7 (43.8) |
3 (37.5) |
0.074 |
|
Fatigue |
17 (58.6) |
5 (20.8) |
0.005 |
3 (18.8) |
2 (25.0) |
0.020 |
|
Headache |
9 (31.0) |
5 (20.8) |
0.402 |
4 (25.0) |
1 (12.5) |
0.568 |
|
Myalgia |
14 (48.3) |
5 (20.8) |
0.038 |
5 (31.3) |
0 |
0.038 |
|
Anorexia, nausea, vomiting |
18 (62.1) |
12 (50.0) |
0.378 |
7 (43.8) |
5 (62.5) |
0.463 |
|
Diarrhea |
13 (44.8) |
11 (45.8) |
0.942 |
5 (31.3) |
6 (75.0) |
0.127 |
|
Hypotension (SBP <90 mm Hg or MAP <70 mm Hg) |
1 (3.4) |
4 (16.7) |
0.164 |
2 (12.5) |
2 (25.0) |
0.160 |
|
Laboratory findings at the time of initial presentation |
|
|
|
|
|
|
|
White blood cell count (mean±SD, cells/μL) |
2028±890 |
1562±671 |
0.039 |
1603±752 |
1478±506 |
0.178 |
|
Hemoglobin (mean±SD, mg/dL) |
13.8±1.6 |
14.1±1.6 |
0.478 |
14.3±1.6 |
13.7±1.6 |
0.491 |
|
Platelet count (mean±SD, cells/μL) |
65344±31406 |
71541±32722 |
0.486 |
75000±34355 |
64625±30118 |
0.689 |
|
PT INR [median (range)] |
1.05 (0.93−1.51) |
1.12 (0.94−1.49) |
0.147 |
1.09 (0.95−1.21) |
1.15 (0.94−1.49) |
0.254 |
|
aPTT [median (range), sec] |
43.7 (28.0−75.8) |
46.4 (34.9−65.9) |
0.491 |
44.5 (34.9−53.0) |
49.3 (38.5−65.9) |
0.639 |
|
AST level [median (range), U/L] |
148 (32−1531) |
113 (22−612) |
0.313 |
91 (22−612) |
140 (48−524) |
0.388 |
|
LDH level [median (range), U/L] |
740 (300−3550) |
828 (302−2589) |
0.802 |
738 (302−1998) |
911 (582−2589) |
0.675 |
|
CK level [median (range), U/L] |
765 (85−7440) |
480 (82−6684) |
0.286 |
383 (82−6684) |
564 (94−3277) |
0.564 |
|
Blood urea nitrogen [median (range), mg/dL] |
18.7 (3.5−86.0) |
14.3 (5.7−48.0) |
0.118 |
12.8 (5.7−36.3) |
19.2 (8.7−48.0) |
0.069 |
|
Serum creatinine [median (range), mg/dL] |
1.0 (0.6−6.8) |
1.1 (0.7−1.4) |
0.308 |
1.1 (0.8−1.4) |
1.1 (0.7−1.2) |
0.547 |
|
Severity indices of illness at the time of initial presentation |
|
|
|
|
|
|
|
No. of SIRS criteria† ≥2 |
21 (72.4) |
17 (70.8) |
0.899 |
10 (62.5) |
7 (87.5) |
0.436 |
|
APACHE II score (mean±SD) |
10.0±4.2 |
9.9±4.0 |
0.942 |
9.5±3.7 |
10.8±4.7 |
0.889 |
|
Clinical outcomes |
|
|
|
|
|
|
|
Length of ICU stay [median (range), days] |
4 (0−15) |
4.5 (2−11) |
0.346 |
5 (2−7) |
3 (2−10) |
0.564 |
|
Length of hospital stay [median (range), days] |
7 (0−40) |
8 (4−22) |
0.281 |
9 (4−18) |
7.5 (4−22) |
0.540 |
|
In-hospital mortality, n (%) |
10 (34.5) |
7 (29.2) |
0.680 |
1 (6.3) |
6 (75.0) |
0.003 |

Of the 24 PE cases, 16 (66.7%) were treated with PE within 7 days of symptom onset (early PE group), and eight (33.3%) were treated with PE after 7 days of symptom onset (late PE group). Comparison of the early PE and non-PE groups revealed that the latter was more likely to have one or more comorbidities or fatigue (all
p<0.05). There were no significant differences in other baseline characteristics between the early PE and non-PE groups (all
p>0.05). The in-hospital mortality of the early PE group did not differ from that of the non-PE group (6.3% vs. 34.5%, RR 0.181, 95% CI 0.026–1.291,
p=0.067). The early PE group survived longer than the non-PE group (mean survival time 28.4 days vs. 22.6 days,
p= 0.044 by log-rank test) (
Fig. 1B).
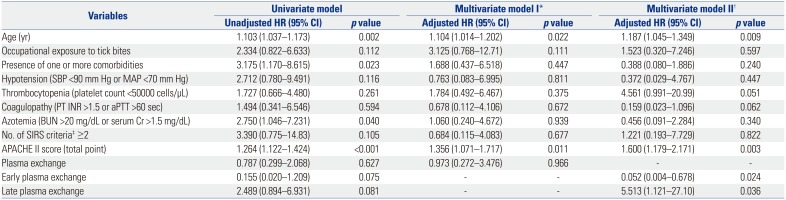
In the multivariate model adjusted for several baseline characteristic and PE implementation as a whole, an increased risk of 30-day mortality was associated with older age (adjusted HR 1.104, 95% CI 1.014–1.203,
p=0.022) and a higher Acute Physiology and Chronic Health Evaluation (APACHE) II score (adjusted HR 1.356, 95% CI 1.071–1.717,
p=0.011) (model I in
Table 2). In the multivariate model adjusted for several baseline characteristics and early and late implementation of PE, older age (adjusted HR 1.187, 95% CI 1.045–1.349,
p=0.009), a higher APACHE II score (adjusted HR 1.600, 95% CI 1.179–2.171,
p=0.003), early PE implementation (adjusted HR 0.052, 95% CI 0.004–0.678,
p=0.024), and late PE implementation (adjusted HR 5.513, 95% CI 1.121–27.10,
p=0.036) were identified as independent risk factors for 30-day mortality (model II in
Table 2).
Table 2
Univariate and Multivariate Analyses of Risk Factors Associated with 30-Day Mortality
|
Variables |
Univariate model |
Multivariate model I*
|
Multivariate model II†
|
|
Unadjusted HR (95% CI) |
p value |
Unadjusted HR (95% CI) |
p value |
Unadjusted HR (95% CI) |
p value |
|
Age (yr) |
1.103 (1.037–1.173) |
0.002 |
1.104 (1.014–1.202) |
0.022 |
1.187 (1.045–1.349) |
0.009 |
|
Occupational exposure to tick bites |
2.334 (0.822–6.633) |
0.112 |
3.125 (0.768–12.71) |
0.111 |
1.523 (0.320–7.246) |
0.597 |
|
Presence of one or more comorbidities |
3.175 (1.170–8.615) |
0.023 |
1.688 (0.437–6.518) |
0.447 |
0.388 (0.080–1.886) |
0.240 |
|
Hypotension (SBP <90 mm Hg or MAP <70 mm Hg) |
2.712 (0.780–9.491) |
0.116 |
0.763 (0.083–6.995) |
0.811 |
0.372 (0.029–4.767) |
0.447 |
|
Thrombocytopenia (platelet count <50000 cells/μL) |
1.727 (0.666–4.480) |
0.261 |
1.784 (0.492–6.467) |
0.375 |
4.561 (0.991–20.99) |
0.051 |
|
Coagulopathy (PT INR >1.5 or aPTT >60 sec) |
1.494 (0.341–6.546) |
0.594 |
0.678 (0.112–4.106) |
0.672 |
0.159 (0.023–1.096) |
0.062 |
|
Azotemia (BUN >20 mg/dL or serum Cr >1.5 mg/dL) |
2.750 (1.046–7.231) |
0.040 |
1.060 (0.240–4.672) |
0.939 |
0.456 (0.091–2.284) |
0.340 |
|
No. of SIRS criteria‡ ≥2 |
3.390 (0.775–14.83) |
0.105 |
0.684 (0.115–4.083) |
0.677 |
1.221 (0.193–7.729) |
0.822 |
|
APACHE II score (total point) |
1.264 (1.122–1.424) |
<0.001 |
1.356 (1.071–1.717) |
0.011 |
1.600 (1.179–2.171) |
0.003 |
|
Plasma exchange |
0.787 (0.299–2.068) |
0.627 |
0.973 (0.272–3.476) |
0.966 |
- |
- |
|
Early plasma exchange |
0.155 (0.020–1.209) |
0.075 |
- |
- |
0.052 (0.004–0.678) |
0.024 |
|
Late plasma exchange |
2.489 (0.894–6.931) |
0.081 |
- |
- |
5.513 (1.121–27.10) |
0.036 |
The clinical course of SFTS can be divided into three stages: fever (1–7 days after symptom onset), MOD (7–13 days after symptom onset), and convalescence.
8 A cytokine-mediated inflammatory response has been shown to play an important role in the pathogenesis of SFTS.
910 In particular, SFTS virus infection triggers a cytokine storm during the early stage of illness, which can cause disease progression to MOD.
11 PE can restore homeostasis in patients with sepsis by removing harmful substances (e.g., inflammatory cytokines) and by replacing deficient blood components (e.g., coagulation factors), when fresh-frozen plasma is used as a plasma substitute.
12 We hypothesized that PE could modulate the cytokine storm during the early stage of SFTS, preventing progression to MOD and thereby leading to favorable outcomes. This was why PE cases were subdivided into early PE and late PE groups. According to multivariate analyses in the present study, PE implementation (as a whole) was not associated with mortality, whereas early PE implementation was identified as an inverse risk factor for mortality. This finding suggests that PE may play an important role in the early stage of illness, which can maximize its survival benefits in SFTS patients.
Several SFTS cases who were successfully treated with PE have been reported in Korea.
131415 There is no consensus yet on whether PE can improve the clinical outcomes of SFTS patients, in whom PE should be implemented, or when PE should be initiated. The present study aimed to answer these questions. In the present study, PE implementation exerted no favorable effect on in-hospital mortality or 30-day survival rate. In the subgroup analyses, early PE cases showed a longer survival than non-PE cases (
p=0.044). Because of the small sample size, however, the significant difference in survival time was no longer apparent after correcting for multiple comparisons between subgroups. In addition, the present study was retrospective and non-randomized in nature; thus, it may have been affected by selection bias. The presence of one or more comorbidities was more common in the non-PE group than in the early PE group. In addition, the mean age of the non-PE group was slightly higher than those of the PE and early PE groups, although the difference was not significant. Such minor differences in baseline characteristics between subgroups may have affected the clinical outcomes. Finally, as PE implementation depended entirely on the clinical judgments of the attending physicians, cases with self-limiting SFTS may have been included in the PE or early PE group.
In summary, the results of the present study highlighted an inverse association between early PE implementation and 30-day mortality, which may provide rationale for the early use of PE in SFTS patients. To overcome the limitations of the present study, larger randomized trials with early PE implementation in high-risk SFTS patients for death are needed.


 PDF
PDF ePub
ePub Citation
 Print
Print


 XML Download