

 PDF
PDF ePub
ePub Citation
 Print
Print


INTRODUCTION
Myotonic dystrophy type 1 (DM1) is caused by a CTG trinucleotide repeat expansion in the 3′untranslated region of the dystrophia myotonica-protein kinase (DMPK) gene on chromosome 19q13.1 A disease of the muscles, DM1 leads to progressive weakness and wasting, especially in the distal muscle. Patients with DM1 also show abnormalities in a variety of other systems, including the heart and brain, presenting symptoms of cardiac conduction defects, cognitive impairment, personality changes, and hypersomnia.1
Cognitive deficits have been observed in 24–75% of DM1 patients,234 including reduced visuospatial/constructional abilities, attention, verbal memory, and even severe cognitive decline. Several neuropsychological studies have shown reduced intelligence quotient (IQ) scores and concurrent deficits in executive function and visuospatial construction ability.35 In association with the cognitive deficits observed in DM1, structural and functional abnormalities of the brain have been reported, which include white matter lesions and atrophy,6 decreased cerebral glucose metabolism,7 hypoperfusion in the fronto-temporo-parietal cortex,5 and reduced cerebral blood flow.35 Voxel based morphometry has revealed gray matter atrophy in the bilateral frontal, parietal lobes, and in the temporo-occipital gyrus, while diffusion tensor imaging (DTI) has highlighted regional white matter atrophy in the corpus callosum.89
Although it has been widely accepted that the size of CTG expansion is closely related to clinical severity of DM1,1011 the relationship between CTG repeats size and structural changes in the brain has yet to be proven. Only limited evidence has demonstrated a correlation of CTG repeat size with neuropsychological tests,1213 and there are some contradictory results.14 As the brain is composed of highly specialized functioning areas, area information in relation to CTG repeats size would hold important clinical implications.
The aim of the present study was to delineate global changes in cortical thickness and white matter integrity in patients with DM1, compared to age-matched healthy controls, using structural magnetic resonance imaging (MRI) and DTI. Furthermore, areas that were highly correlated with CTG repeat size were explored both in the cortical and white matter areas, as well as its relevance to IQ scores.
MATERIALS AND METHODS
Participants
Nine patients with adult DM1 who were treated at Gangnam Severance Hospital agreed to participate in this study. The inclusion criteria were 1) age between 20 and 60 years and 2) genetic confirmation of DM1, which was established by polymerase chain reaction (PCR) and Southern blot analysis. Abnormal nucleotide repeats in the 3′-untranslated end of the DMPK gene amplification were detected by PCR-Southern blot analysis from serum DNA. DM1 was diagnosed based on the presence of 50 or more CTG repeats.
Patients with DM1 were age and education level-matched with nine healthy control participants. The MRI data from the patient group were compared with those from the control group.
This study was approved by the Institutional Review Boards of Gangnam Severance Hospital and the Hallym University Sacred Heart Hospital. Written informed consent was obtained from all of the participants.
Methods
MRI acquisition
We acquired MR images using a 3T Philips Intera Scanner (Philips Intera, Amsterdam, the Netherland) located at Hallym University Sacred Heart Hospital, which was equipped with an eight-channel head coil. High-resolution T1-weighted imaging was acquired using multi shot turbo field echo pulse sequence [repetition time (TR)=9.3 ms; echo time (TE)=4.6 ms; flip angle=8°; field of view (FOV)=230×230 mm, slice thickness=1 mm, 160 slices]. DTI was conducted using a diffusion-weighted-echo planar imaging sequence (TR=10427 ms; TE=60 ms; slice thickness=2.25 mm; no gap; FOV=230×230 mm). A total of 60 slices were obtained with 45 independent diffusion gradient directions using b=1000 s/mm2 and one image with b=0 s/mm2.
Cortical thickness analysis using 3D T1 volume
T1-weighted 3D volume images were analyzed with FreeSurfer software (v5.0, Athinoula A. Martinos Center for Biomedical Imaging, Charlestown, MA, USA). FreeSurfer is a semi-automated brain morphometry tool, and details on this post-processing sequence have been described elsewhere.15 Briefly, a single MPRAGE image was automatically normalized for intensity inhomogeneity to obtain a high contrast-to-noise volume. Identification of the gray/white matter boundary (white matter surface) and, in turn, the gray/CSF boundary (gray matter surface)15 was automatically processed using the intensity-normalized volume. Cortical thickness measurements were then obtained by calculating the distance between these two boundaries across the entire cortical mantle of each hemisphere.
Diffusion tensor image analysis
First, we performed voxel-wise analyses of fractional anisotropy (FA) maps across subjects using tract-based spatial statistics (TBSS) on data from patients with DM1 and controls. In this process, eddy currents correction, non-brain tissue removal, DTI data calculation, skeletonization to generate a white matter tract skeleton,16 and statistical analysis between groups were all conducted. Then, FA values were extracted from the region of interests (ROIs) (orbitofrontal left, optic radiation both, external capsule both, postcentral left, insular both) using the fslmeants commands. Lastly, the mean FA values of each ROI were correlated with the number of CTG repeats.
Intelligence quotient testing
The Korean version of the Wechsler Adult Intelligence Scale (K-WAIS) was used to evaluate the patients' cognitive functioning. IQ tests were administered within 1 or 2 days difference of the MR acquisition. The Wechsler Adult Intelligence Scale is an individually administered, neuropsychological test for the measurement of intellectual capacity using IQ to quantify capacity. The test consists of subtests for verbal IQ, performance IQ, and full scale IQ. The full-scale IQ score is derived from the combination of the verbal and performance scores. On the K-WAIS, IQ scores ranging from 90–109 are ‘average’, and IQ scores ranging from 80–89 are ‘below average’
Statistics
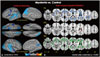
A general linear model was used to analyze cortical thickness values, which were estimated at each vertex across the cortical surface for comparison between patients with DM1 and controls, with cortical thickness as the dependent variable. Age was included as a nuisance variable. The left and right cortical surfaces of each hemisphere were analyzed separately. Clusters of vertices exceeding p<0.01 with differences in thickness according to grouping, with age as a nuisance variable, were identified, and cluster-wise statistical significances were calculated via 10000 instances of a Monte Carlo simulation (p=0.01) (Fig. 1A). The relationship between the mutation effect and cortical thickness was investigated by including the number of CTG repeats into the general linear model as covariates as described above and using uncorrected p<0.001 as a reduced threshold for significance (visualized with uncorrected p<0.01) (Fig. 1B).
For DTI analysis, each DTI metric [FA, axial diffusivity (AD), and radial diffusivity (RD)] was projected onto the skeletons in cluster-wise statistical comparisons. Independent t-tests were conducted using permutation-based non-parametric testing and incorporating age as a nuisance variable. We formed clusters at t>4 and tested for significance at p<0.05, corrected for multiple comparisons across space (Fig. 1B). The relationship between the mutation effect and FA values was investigated by including the number of CTG repeats into the model as covariates using uncorrected p<0.005 as a threshold for significance (Fig. 2B). Spearman correlations between the number of CTG repeats and either cortical thickness or FA value were considered significant at p<0.05.
The Wilcoxon signed-rank test was used for cognition subscale analysis to evaluate differences between verbal and performance IQ scores of patients with DM1. Additionally, we used Spearman's correlation analyses to detect relationships between IQ scores and the number of CTG repetitions.
RESULTS
Comparison between DM1 and controls
Demographic characteristics
In the control group, six men and three women were included with ages ranging from 27 to 55 years [47 (27, 55) median (interquartile range (IQR)]. The group of patients included five men and four women with ages ranging from 27 to 52 years [42 (36, 48) median (IQR)]. The average duration of disease was 5.2±1.4 years. The patients had a median of 300 (150, 400) CTG elongations (ranging from 120 to 400) (Table 1). The baseline demographic characteristics showed no significant difference between groups (p>0.05).
Cortical changes
Cortical thickness was significantly reduced in the clusters of the bilateral superior temporal cortices (including the supramarginal cortex), precuneus, lateral occipital cortex, superior frontal, precentral, and postcentral cortices in the patient group, compared to controls. The thickness of the entorhinal cortex was only decreased in the right hemisphere (Fig. 1A).
White matter changes
Voxel-based mapping using TBSS showed decreased FA values in widespread areas, including bilateral orbitofrontal cortices, anterior frontal fibers (includes genu portion corpus callosum), the insular cortex, the external capsule, and the occipital cortex (includes optic radiation) in patients, compared to control subjects. Increased RD, which is suggested to be related with a myelinopathy condition, was noted in the patient group, compared to the control subjects, in similar but more widely distributed areas. However, analyses of the AD values demonstrated that only the genu of the corpus callosum and both anterior and posterior corona radiata were increased in the patient group, compared to the control group (Fig. 1B).
Correlation with CTG repeats
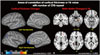
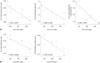
Cortical thickness of the middle temporal, supramarginal, and lateral occipital cortices in the left hemisphere and in the medial orbitofrontal and inferior parietal cortices in the right hemisphere were negatively correlated with the number of CTG repeats (p<0.001, uncorrected) (Figs. 2A and 3A, Table 2), while white matter integrity measured by FA values in the orbitofrontal and entorhinal areas, as well as the anterior corona radiata and lateral occipital white matter, in the left hemisphere and the precuneus white matter in the right hemisphere were negatively correlated with the number of CTG repeats (p<0.003, uncorrected) (Figs. 2B and 3B, Table 3).
Intelligence quotient scores
All patients completed the K-WAIS. Only one patient had a below average full scale IQ at 84. The others had IQ scores in the average (IQ 90–109) or above ranges. The performance IQ was lower than verbal IQ; in particular, picture completion, block design, and object assembly were relatively lower in the subtest of performance IQ. There were no differences between verbal and performance IQ scores (p=0.11). In addition, no statistically significant correlation was found between IQ scores and the size of CTG repeats.
DISCUSSION
In the present study, analyses of patients with DM1 demonstrated changes in gray and white matter in the widely distributed network of the frontal, temporo-occipital, medial parietal, and sensorimotor areas. These differences between patients and control subjects were similar in distribution but more extensive in white matter. In relation to CTG expansion size, significant negative correlation were found with the cortical thickness in the right medial orbitofrontal cortex, left middle temporal, supramarginal, and the lateral occipital cortex, along with FA in the orbitofrontal, left entorhinal, anterior coronal, and lateral occipital cortices.
Research on brain involvement in adult-onset DM1 has increased in recent years, revealing cognitive dysfunction, as well as underlying brain anomalies.17 Previous neuroimaging studies have demonstrated predominant white matter abnormalities rather than cortical changes in the brain. Symmetrical subcortical white matter lesions with a breakdown of myelin sheaths and relative preservation of axons in patients with DM1 are the most common previously reported pathological marker.1819 Group comparison between patients and control subjects in this study revealed higher occurrence of white matter abnormalities than cortical abnormalities, which was in line with previous reports.1820 Detailed analyses of white matter microstructure using DTI showed that white matter lesions mostly represent myelinopathy, as areas of change in mean diffusivity values were mostly influenced by RD values, except corpus callosal changes in AD. This finding together with the correlation between white matter lesion severity and disease duration suggests that DM1 represents a slow demyelinating process.1820 The demyelination eventually progresses to axonopathy, leading to ventricular dilatation, which is significantly more common in patients with severely disturbed intellect.2 Previously reported data also suggest changes in the widely distributed white matter involving most of the cerebrum and cortical fibers.91721
Considering documented impairment on tests of frontal lobe function, such as attention demanding-dual tasks and frontal executive functions in DM1,35 white matter pathology observed in our study may suggest that this type of deficit does not correlate with cortical atrophy but specifically with white matter lesions in the frontal lobes, including orbitofrontal, inferior frontal, and prefrontal white matter. As demonstrated by our results, decreased integrity of connectivity, as well as cortical pathology, was located mostly in the ventral side connecting the fronto-temporal cortex. These findings may be relevant to the behavioral symptoms related to fronto-temporal cortex, including dysexecutive syndrome, apathy, depression, anxiety, obsessive-compulsive, avoidant, and passive-aggressive behavior, which was observed in DM1.6 In the present study, we also found changes in diffusion metrics in the external capsule, which might be related to decreased verbal fluency resulting from impairment in semantic processing.22
We also observed pronounced changes in cortical thickness and white matter integrity, mainly in the temporo-occipital and parietal areas in the medial side, including the precuneus. Cortical changes in patients with DM1 have been well documented using MRI, including regional neuronal loss in the parietal region, extending to the anterior and superior middle temporal and occipital lobes.582324 It is interesting to note that the precuneus, in combination with the anterior cingulate, is an important node of the default mode network. The present results revealed decreased cortical thickness and white matter integrity, which may underlie decreased alertness and autobiographical memory.252627
The overall IQ scores, as measured by the K-WAIS, were within the normal range in the present study, in contrast with lower-than-age and education-matched controls reported in earlier studies.71228 Patients with DM1 with IQ scores similar to those of the normal population reportedly have impairments in visual functions, including visual perception, constructional ability, and visual memory.529 The performance IQ was lower than the verbal IQ in all the cases in the present study, but this was not statistically significant. We believe that this finding is related to both cortical and white matter abnormalities in occipital lobes. In addition, given that the visuospatial attention network is closely linked to increases in signal-to-noise ratio in the visual pathway, attention deficits in patients with DM1 described in previous studies might be explained by the present findings of occipital changes.430
Considering documented evidence of impairment in tests of frontal lobe function in patients with myotonic dystrophy,35 the white matter pathology observed in this study may suggest that this type of deficit does not correlate with cortical atrophy but instead with white matter lesions in the frontal lobe, including the orbitofrontal, inferior frontal and prefrontal regions. A recently published study showed greater MD increases and FA decreases are related to more cortical thinning in healthy subjects, in areas with partial overlapping with but outside the projected tract endings.31 Our results were different as the white matter integrity was far more changed than that of the cortical thickness in our patient group; this would not be mere changes in cortical thickness outside the tract projection.
DM1 is a trinucleotide repeat disorder of the non-coding region, and there is some evidence that the severity of DM1 correlates with the number of CTG repeats.132 Previous results showed that the number of CTG expansions correlates with disease severity, inversely to age of onset, and diffuse subcortical involvement,333435 especially in the frontal lobes.1236 Although the results of those studies demonstrated correlations between cortical changes in diverse brain areas and increased CTG repeats, it is interesting to note that frontal areas and brain areas involved in memory showed significant differences between the patient and control groups. Transgene DMPK RNA levels in the frontal cortex were found to be approximately three times higher than those of endogenous murine DMPK RNA in homozygous mice carrying over 1000 CTG.37 These findings are consistent with a higher relative expression of the transgene in this brain region co-occurring with longer CTG repeats and may support findings of a correlation between number of CTG repeats in the medial frontal and prefrontal white matter areas.37 The findings may also be related to the dysexecutive syndrome observed in patients with DM1.35 Our TBSS results indicating differences in the hippocampus and parahippocampal gyrus may be clinically significant because these areas are known to contribute significantly to learning and memory processes.38 These structures are also connected with the precuneus, which has been established as an important node for the default mode network that is related to the mental processes presumed to be ongoing in a resting state.39 In addition, the precuneus is connected to the orbitofrontal cortex and the medial prefrontal cortex, which have been implicated in the integration of cognitive and emotional stimuli,4041 and therefore, may suggest functional implications in related symptoms. However, very little is known about the relationship between brain abnormalities and cognitive dysfunction in patients with DM1. Therefore, further studies are needed to understand brain involvement in the disease duration and range of cognitive function.
There are several limitations to this study: first, this study included a small number of participants; therefore, observations here may not be generalizable to all patients with DM1. Secondly, IQ test was performed only in the patient group, which made it difficult to interpret related IQ group differences. However, if one considers the fact that this study focused mainly on the relationship with CTG repeats, as well as the IQ results, which showed average score, it might be plausible to interpret the results as above. Another limitation of this study is the correlation analysis finding is based on the IQ tests not based on whole neuropsychological tests, which is warranted a future study about the relationship the CTG repeats how it correlated with neuroimaging metrics.
In conclusion, our results suggest that DM1 patients show 1) changes in gray and white matter in widely distributions of similar networks, although more extensively in white matter characterized by myelinopathy, 2) gray and white matter integrity that is correlated with CTG repeats, and 3) that the anatomical location correlated with CTG repeats expansion size is well related with the characteristic cognitive deficits of these patients, although these lesions show no correlation with IQ tests.


 XML Download