

 PDF
PDF ePub
ePub Citation
 Print
Print


INTRODUCTION
Specific IgE (sIgE) identification is essential for the diagnosis and treatment of IgE-mediated allergic diseases, such as allergic rhinitis, asthma, atopic dermatitis, food and drug allergies, bee-sting allergy, and anaphylaxis. Allergen avoidance and decisions regarding allergen immunotherapy are based on sIgE detection and corresponding symptoms. As the detection of sIgE indicates only sensitization, not an allergy itself, both the selection of test allergens and the interpretation of test results require highly sophisticated judgments. Moreover, when designing test panels, biogeographic characteristics and culinary culture should be considered.12 As well, clinicians should take into account the patient's age, exposure history with relevant manifestations, and allergen cross-reactivity in making decisions regarding the causative allergen(s).3
Due to the diversity of sIgE detection methods, it is important to understand the characteristics (validity, reliability, strengths, and limitations) of each test.4 Serologic tests are more convenient than skin tests, since they do not require patients to stop medications. Also, in the case of anaphylaxis patients, there is no need to wait for recovery of histamine release capability after a severe anaphylactic reaction. Serologic tests also involve no risk of recurrence of allergic reactions due to testing. Moreover, there are no concerns regarding variability associated with the proficiency of the operator, the test site, or underlying medical illnesses, especially skin diseases.45
In Korea, multiplex sIgE detection is commonly used to screen for allergic diseases. In this study, the diagnostic capability of a new Korean multiplex sIgE assay was compared with that of the ImmunoCAP system, which is the current gold-standard method for allergy diagnosis.
MATERIALS AND METHODS
Participants
This study was conducted between January 2014 and December 2015 at the Allergy and Asthma Center at Severance Hospital, Yonsei University Health System (Seoul, Korea). Patients diagnosed with allergic rhinitis, asthma, atopic dermatitis, food allergy, chronic urticarial, or anaphylaxis were enrolled in the study. Patients ranging from 6 to 75 years of age were included. Patients receiving immunotherapy were excluded. All participants provided written or verbal informed consent. This study was approved by the Institutional Review Board of the Yonsei University Health System (Approval no. 1-2014-0068).
Blood sampling
Blood samples were collected from 218 patients using serum separation vacuum tubes (Greiner Bio-One, KremsmÜnster, Austria). After centrifugation, the serum was collected from each sample and stored at -70℃ for simultaneous testing. After enrollment of the final patient, all samples were sent to two laboratories for sIgE analysis. No accompanying clinical data were provided in order to ensure blind testing.
sIgE detection assays
The ImmunoCAP (Thermo Fisher Scientific, Uppsala, Sweden) and AdvanSure™ AlloScreen (LG Life Science, Seoul, Korea) assays were compared with respect to sIgE detection. Both tests were carried out according to standard instructions provided by the respective manufacturers. Thirteen allergens were compared: 10 inhalant allergens [Dermatophagoides pteronyssinus (D. pteronyssinus), Dermatophagoides farinae (D. farinae), cat and dog dander, Alternaria, birch, oak, ragweed, mugwort, and rye grass] and three food allergens (egg white, cow's milk, peanuts). The cutoff for a positive result for both the ImmunoCAP and AlloScreen assays was 0.35 kU/L. Both assays adopted the same class determination range, expressed as kU/L: class 0 (0.00–0.34 kU/L), class 1 (0.35–0.69 kU/L), class 2 (0.70–3.49 kU/L), class 3 (3.50–17.49 kU/L), class 4 (17.50–49.99 kU/L), class 5 (50.00–99.99 kU/L), and class 6 (>100 kU/L).
Statistical analyses
To assess the validity and reliability of the multiplex and singleplex assays, IBM SPSS Statistics for Windows software, version 23.0 (IBM Corp., Armonk, NY, USA) was used. First, the sensitivity, specificity, and positive and negative predictive values were calculated based on the ImmunoCAP results. The total agreement ratio was calculated as follows: (number of both tests showing a positive result+number of both tests showing a negative result)/total number of tests.6 This agreement was analyzed by Pearson's chi-square test. These categorical crosstable data were also compared using Cohen's kappa analysis. Kappa values were interpreted as follows: almost perfect (0.8–1.0), substantial (0.6–0.8), moderate (0.4–0.6), fair (0.2–0.4), and poor (<0.2).7 Second, class assessment was compared using gamma analysis. The closer the gamma index is to 1 indicates stronger association. Third, intra-class correlation (ICC) was used for comparison of sIgE titers.89 Therein, values closer to 1 indicate good agreement between the two methods. p<0.05 indicated statistical significance.
RESULTS
Participants and allergens
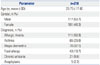
A total of 218 patients were enrolled in this study. Their mean age was 25.7 years. Males comprised 53.7% of the study group. Allergic rhinitis was the most common disease among the patients (50.9%), followed by asthma, atopic dermatitis, food allergy, chronic urticarial, and anaphylaxis (Table 1). The number of patients tested for sIgE against each of the 13 allergens and the number of patients testing positive for sIgE against each allergen according to the ImmunoCAP assay are shown in Table 2.
Qualitative comparison: positivity and negativity
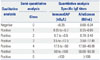
Diagnostic agreement between the assays, as determined by positivity and negativity, is summarized in Table 3. The total agreement ratio ranged from 0.74 (oak) to 0.97 (Alternaria). Kappa index classifications were as follows: almost perfect (D. pteronyssinus, D. farinae, cat dander, Alternaria), substantial (dog dander, birch, mugwort, peanuts), and moderate (oak, ragweed, rye grass, egg white, cow's milk). The kappa indices ranged from 0.51 (cow's milk) to 0.93 (Alternaria). p-values calculated using Pearson's chi-square and Cohen's kappa analysis were all <0.001.
Semi-quantitative comparison: class consistency (class 0–6)
The AlloScreen assay groups test results into classes numbered 0 to 6. Likewise, the ImmunoCAP assay groups test results for both sIgE titers in classes numbered 0 to 6. Even though the two systems are fundamentally different, we compared them in terms of class determination consistency. The results are shown in Table 4. Except for oak allergen, the gamma index of all other allergens examined was >0.8. The Spearman's correlation coefficients were >0.7 except for oak, rye grass, and egg white. For both indicators, a value close to 1 indicates that the tests are in good agreement.
Quantitative comparison: sIgE titer determination
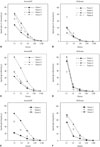
The ICCs for each allergen are shown in Table 5. The ICCs were >0.5 for all of the allergens examined with the exception of oak and mugwort. The results of Passing-Bablok regression analyses were not significant. Scatter plots of sIgE titers for each allergen are shown in Fig. 1. In addition, we checked the sIgE titers of serially diluted serum specimens (Fig. 2). ImmunoCAP showed good linearity as a quantitation assay. Despite the limitation of being a semi-quantitation assay, AlloScreen showed fair linearity in this dilution test.
DISCUSSION
In this study, we compared the AlloScreen and ImmunoCAP assay systems. AlloScreen is a simultaneous test for multiple allergens that employs a semi-quantitative enzyme immunoassay (EIA). There are currently six representative simultaneous tests for multiple allergens available in Korea: AdvanSure™ AlloScreen (LG Life Science, Seoul, Korea), MAST CLA Allergy Test (Hitachi Chemical Diagnostics, Inc., Mountain View, CA, USA), Polycheck Allergy (Biocheck GmbH, Munster, Germany), RIDA Allergy Screen (R-biopharm, Darmstadt, Germany), PROTIA Allergy-Q (ProteomeTech, Seoul, Korea), and RIDA Allergy Screen (R-Biopharm, Darmstadt, Germany). AlloScreen can test 44 to 62 kinds of allergens simultaneously with 3.5 hours of analysis time with automation process; required serum amount is 100 µL.
The principal tests mentioned above that are available in Korea utilize different technologies, and therefore, the results are not necessarily comparable. One difference is the use of quantitative fluorescent EIA (ImmunoCAP) versus semi-quantitative EIA (AlloScreen).10 The AlloScreen test procedure is as follows: each allergen is fixed on a membrane strip in the Allo-Screen panel. Serum sample (containing IgE) incubation, washing, incubation with biotinylated anti-IgE, washing, and incubation with streptavidin-alkaline phosphatase and substrate proceed sequentially. For color development, nitro-blue tetrazolium chloride and 5-bromo-4-chloro-3′-indolyphosphate ptoluidine salt are utilized, and the resulting signals are analyzed using AlloStation equipment. There are also methodological differences between the ImmunoCAP and AlloScreen assays with respect to allergen coating (covalent binding to a solid phase), color development (β-galactosidase and methylumbelliferyl-β-D-galactoside), and signal detection (fluorescence intensity).11 For allergen coating, the two assays compared in this study utilize different methods, which can lead to differences in IgE binding. ImmunoCAP uses multiporous nitrocellulose block, which enables thee-dimensional coupling of allergen and its IgE. In this process, allergens are attached to the solid phase via biotinylation. On the other hand, AlloScreen uses nitrocellulose membrane, which enables two-dimensional coupling without modification of allergen.8
Differences also exist with respect to allergen sources and allergenic extract quality control. Mongolian oak (Quercus mongolica) and Saw tooth oak (Quercus acutissima) are dominant species in Korea instead of white oak (Quercus alba), which is used for ImmunoCAP and AlloScreen.1213 Well standardized, commercially available Mongolian oak or Saw tooth oak allergen is not available. Therefore, Korean oak allergy patients are diagnosed using foreign oak tree. In Korean allergy patients, the relatively low agreement ratio on oak pollen can be explained by the oak allergen used in the test.
For the above-mentioned reasons, quantitative data regarding sIgE titer are not well correlated. In addition, AlloScreen has been developed as a semi-quantitative method, such that quantification precision can differ from that in ImmunoCAP. Several studies have compared multiplex and single-plex test results obtained with various assays. A comparison of the RIDA qLine Allergy (R-Biopharm AG, Darmstadt, Germany) and ImmunoCAP assays revealed that the RIDA system is more likely to return false-positive results.14 Another study comparing three multiplex sIgE assays [RIDA Allergy Screen (R-Biopharm), MAST Optigen allergy system (Hitachi Chemical Diagnostics), and Polycheck Allergy (Biocheck GmbH)] showed that the MAST Optigen allergy system provides better sensitivity and that the Polycheck Allergy provides better specificity.15 The AlloScreen was also compared with skin prick test16 and showed good correlation and agreement.
As medical costs and insurance systems differ in each country, clinicians must be well-informed regarding the strengths and weaknesses of available diagnostic assays in terms of their use in actual patient testing. The fact that sIgE is detected by different assays is not a guarantee that the results are comparable.17 Detection of in vitro sIgE does not mean that it is the cause of allergic disease. Clinical manifestation after exposure of allergen, cross-reactivity between the allergens should be considered for interpretation of sIgE assay.
In order to minimize the disadvantages of in vitro tests, many companies have sought to improve the quality of their products.18 The AdvanSure™ AlloScreen is a updated version of the AdvanSure™ Allergy Screen.819 AlloScreen shows stronger agreement with ImmunoCAP than Allergy Screen.8 As these assays were developed in an East Asian country, the panel composition was differentiated to include Asian sensitization profiles: Humulus japonicus as an inhalant allergen, and mackerel and chrysalis as food allergens.2021
The current study has some limitations. First, this study was performed considering sensitization but not a clinical diagnosis of allergy, because the clinical relevance of sensitization was not considered. Clinical manifestations of allergen exposure in the study subjects were not objectively identified. Second, the results of single-plex sIgE assays can differ,62223 although this study compared the AlloScreen assay only with the ImmunoCAP assay, as it is highly certified for single-plex sIgE detection. Third, false positivity and false negativity of the Allo-Screen assay were discriminated based on ImmunoCAP test results, not clinical manifestation. Finally, the cut-off value for sIgE positivity can differ between allergens.11
In conclusion, the results of the AlloScreen assay correlated well with those of the ImmunoCAP assay with regard to common inhalant and food allergens. However, as each diagnostic method has unique characteristics, the results are not necessarily interchangeable.

 XML Download