Journal List > Yonsei Med J > v.58(4) > 1032190

Park, Yoon, Kim, Moon, Lee, Jang, and Kim: Pathologic Impact of Insulin Resistance and Sensitivity on the Severity of Liver Histopathology in Pediatric Non-Alcoholic Steatohepatitis

Abstract

Purpose

Insulin resistance (IR) has an important role in the development of non-alcoholic steatohepatitis (NASH). We aimed to analyze the association between liver histopathology and IR in pediatric patients with NASH.

Materials and Methods

In 24 children with non-alcoholic fatty liver disease (NAFLD), we investigated whether the hepatic pathologic characteristics have relations with following three biochemical indices; IR index including homeostasis model assessment of IR (HOMA-IR), quantitative insulin sensitivity check index (QUICKI), and insulin sensitivity indices-free fatty acid (ISI-FFA).

Results

Among 24 patients, 16 (66.6%) had a high NAFLD activity score (NAS), which is diagnostic of NASH. Higher serum triglyceride level was significantly correlated with a high NAS. Higher steatosis grades were significantly associated with low insulin sensitivity (p=0.023). In addition, severe lobular inflammation was associated with higher IR: HOMA-IR (p=0.014) and QUICKI (p=0.023). Severe fibrosis correlated with low insulin sensitivity and high IR indexes: ISI-FFA (p=0.049), HOMA-IR (p=0.028), and QUICKI (p=0.007).

Conclusion

Patients with high IR had more severe lobular inflammation and hepatic fibrosis. Analyses of biochemical and endocrine parameters can be applied to determine the severity of the hepatic pathologic status in patients with NASH, especially in children who cannot undergo a liver biopsy.

INTRODUCTION

The incidence of obesity has been increasing rapidly in many countries. In Korea, the incidence of obesity was 1.7 times higher in 2011 compared to 9.7% incidence 10 years ago.1 The incidence of non-alcoholic fatty liver disease (NAFLD) in Korea, Japan and north Asian countries has increased 3 folds from less than 10% to 30% over four decades since 1980s, and mostly related with metabolic consequence of over-nutrition with obesity such as insulin resistance (IR), diabetes, and metabolic syndrome.2 Non-alcoholic steatohepatitis (NASH), the severe form of NAFLD, is a common cause of chronic liver disease in children and adolescents, and the number of NASH patients has increased with the increasing number of obese children.3
NAFLD shows evidence of hepatic steatosis either by imaging or histology, and is associated with no causes of secondary hepatic fat accumulation. NAFLD may present as a spectrum of disease, ranging from asymptomatic steatosis with elevated or normal aminotransferases, NASH, and cirrhosis with complications of liver function, to hepatocellular carcinoma.4 NASH includes the presence of hepatic steatosis and inflammation with hepatocyte injury such as ballooning with or without hepatic fibrosis.5
In one-third of NASH patients, progression to liver fibrosis was found within 5 years of diagnosis, and the prevalence of cirrhosis development was found to be 11 times higher in patients with NASH than in patients with simple hepatic steatosis.6 Additionally, NAFLD in children may be associated with significantly shorter survival than the general population because of liver failure or cirrhosis, especially in NASH patients.7 To evaluate the severity of NASH, a liver biopsy is required, in which fibrosis is an important factor.
IR has an important role in the development of NASH by increasing hepatic fatty acid β-oxidation and oxidative stress. Free fatty acids (FFAs) also cause IR by inhibiting insulin-stimulated glucose uptake and glycogen synthesis. IR is impaired insulin sensitivity, which is a decreased tissue response to insulin-mediated cellular actions. This condition is commonly associated with obesity in both children and adults. However, a standard method to evaluate IR in children has not yet been established, although several methods are used to measure IR or insulin sensitivity. The euglycemic and hyperinsulinemic clamp study is the most accurate technique, however, this method is time consuming and requires frequent blood sampling.8 For more simplified measurement of IR, fasting insulin and glucose, homeostasis model assessment of IR (HOMA-IR), insulin sensitivity indices-FFA (ISI-FFA), and quantitative insulin sensitivity check index (QUICKI) have been developed.91011 In addition, several previous studies analyzed the association between IR and NASH.12 A recent Korean study clearly showed higher body mass index (BMI), higher HOMA-IR values, and increased triglyceride (TG) ≥150 mg/dL associated with the occurrence of NAFLD in non-obese subjects.13
Italian national survey earlier defined IR as HOMA-IR >2.5 in pre-pubertal children and HOMA-IR >4 in pubertal children,14 and cut-off values for HOMA-IR according to age and gender have been proposed in Korean children and adolescents,15 and Korean men.16 However, there is limited data on the correlations between clinical manifestations and analysis of liver histopathology, especially in children and adolescents. Therefore, we aimed to investigate clinical characteristics according to the severity of NASH, and explore the relationship between NASH status and IR by using the IR indicators such as HOMA-IR, QUICKI, and ISI-FFA.

MATERIALS AND METHODS

Subjects

The study subjects included 41 children (25 males, 16 females) with NAFLD in whom liver biopsies were performed to assess the severity of liver pathology between July 2006 and September 2014, at the Department of Pediatrics, Hanyang University Hospital. The patients were 7 to 15 years old and did not have a hepatitis A, B, or C virus infection or a history of alcohol consumption, parenteral nutrition, or use of drugs.
Anthropometric data including body weight, BMI, and waist circumference were evaluated. To compare BMI across different ages and both genders, BMI Z-scores were calculated. The Z-score represents the number of standard deviations above or below the mean value based on standardized tables for children, as indicated by the Korean Journal of Pediatrics.17
Clinical features and biochemical findings including alanine aminotransferase (ALT), aspartate aminotransferase (AST), TG, cholesterol, high density lipoprotein-cholesterol, low density lipoprotein-cholesterol, FFA, fasting glucose, fasting insulin, IR, and insulin sensitivity were analyzed retrospectively. These laboratory tests were performed during the same period as the liver biopsy.

Insulin resistance and insulin sensitivity

IR and insulin sensitivity were calculated as follows: HOMA-IR=fasting insulin (µIU/mL)×fasting glucose (mmol/L)×0.55/22.5.10 ISI-FFA=2/(insulin×FFA+1); mean normal values of ISI (FFA) are reported to be around 1 in adults.1819 QUICKI was calculated as 1/[log fasting insulin (µIU/mL)+log fasting glucose (mg/dL)]. Impaired QUICKI was suggested as QUICKI below than 0.43 to 0.91 in the children.2021

Liver biopsy and histology

Liver biopsy was performed by an 18-gauge automatic gun [Autovac (BARD Angiomed, Karlsruhe, Germany)]. Before the biopsy, we selected the area in the right intercostal space to avoid the pleura and blood vessels, and disinfected the skin with povidone-iodine; local anesthesia was performed on the area of skin puncture. The needle of the biopsy gun was advanced 1–2 cm into the hepatic capsule, and at least 1.5 cm of tissue was biopsied from each patient under ultrasonic guidance.
NAFLD scoring system, designed and validated by the pathology committee of the NASH-Research Network, was used to evaluate the liver biopsy samples.22 Main histological features described in NASH/NAFLD, including steatosis, ballooning change, lobular inflammation, portal inflammation, and fibrosis, were scored using this scoring system. Simple steatosis is defined to show fatty infiltration in the hepatic tissue without fibrosis or ballooning. Steatosis was graded on a four-point scale: grade 0 (<5%), grade 1 (5–32%), grade 2 (33–66%), or grade 3 (>66%). Lobular inflammation was graded on a four-point scale: grade 0 (no foci), grade 1 (<2 foci/200×field), grade 2 (2–4 foci/200×field), or grade 3 (>4 foci/200×field). Portal inflammation was graded on a three-point scale: grade 0 (none), grade 1 (minimal), or grade 2 (greater than minimal). Hepatocyte ballooning change was graded on a three point scale: grade 0 (none), grade 1 (few ballooning cells), or grade 2 (many ballooning cells). Fibrosis was graded on a five-point scale: grade 0 (none), grade 1 (zone 3 perisinusoidal), grade 2 (perisinusoidal and portal/periportal), grade 3 (bridging fibrosis), or grade 4 (cirrhosis).
We calculated the NAFLD activity score (NAS) as an objective marker of NASH grade based on the sum of steatosis, lobular inflammation, and ballooning change scores and the group with score ≥5 were defined as NASH. Among the total 41 children, pathologic changes compatible with NAFLD were noted in 24; NASH with high NAFLD score was found in 16, and mild pathologic change with low NAFLD score was found in 8.

Statistical analysis

SPSS Statistics ver. 21.0 (IBM Co., Aronk, NY, USA) was used for statistical analysis of the data. A Mann Whitney U-test was performed for comparative analysis of the lab findings according to NAS. For the associations between clinical laboratory findings and liver pathology, a Jonckheere-terpstra test was performed. A p value less than or equal to 0.05 was considered statistically significant. This study was approved by the Institutional Review Board (IRB) of our institute (2015-11-016-002).

RESULTS

Clinical characteristics and endocrine features

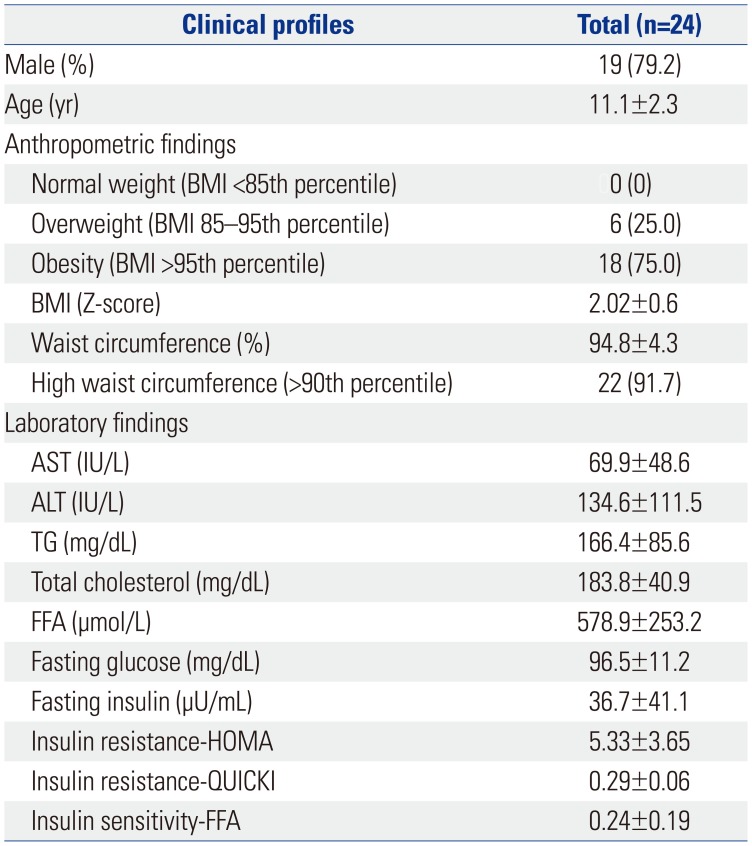
The mean patient age was 11.1±2.3 years (range, 7–15 years), and the majority of the 24 NASH patients were male (19 males and 5 females). Clinical characteristics and laboratory findings are summarized in Table 1. All patients had a BMI above the 85th percentile, and 18 patients were obese. The levels of AST and ALT were elevated to 69.9±48.6 and 134.6±111.5 IU/L, respectively. The FFA level was 578.9±253.2 µmmol/L, and fasting glucose and insulin were 96.5±11.2 mg/dL and 36.7±41.1 µIU/mL, respectively. The mean values of HOMA-IR were 5.33±3.65, QUICKI, 0.29±0.06, ISI-FFA, and 0.24, respectively.

Histopathology of patients with NAFLD

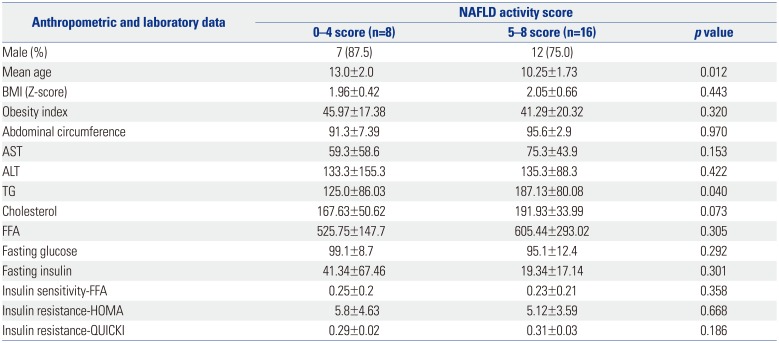
The 24 patients with an NAFLD score were divided into two groups. The low score group included 8 patients with an NAS from 0 to 4, and the high score group included 16 patients with an NAFLD score from 5 to 8. The high NAS group had higher TG levels than the low NAS group; however, the mean age was lower in the high score group than in the low score group (Table 2). The tendencies of TG level and mean age were considered significant. Based on the p values for IR and sensitivity, however, these values were not considered significantly different between the two groups.

The association between the hepatic pathologic findings and clinical and laboratory data

The severity of steatosis was statistically significantly associated with higher age, AST, and ISI-FFA. The severity of ballooning change was statistically associated with AST and TG. The severity of lobular inflammation was associated with the indices for HOMA-IR and QUICKI, and that of fibrosis was associated with higher indices of IR; fasting insulin, ISI-FFA, HOMA-IR, and QUICKI. In contrast, portal inflammation had no association with any clinical or biochemical laboratory data (Table 3).

Insulin resistance in children with NASH

Hepatic fibrosis was highly related with IR. The severity of the fibrosis was strongly associated with higher fasting insulin, HOMA-IR, and lower QUICKI, ISI-FFA (Table 4).

DISCUSSION

It has been well known that NASH is a hepatic portion of metabolic (IR) syndrome.232425 NASH has recently become one of the leading indications of liver transplantation in the United States.26 Furthermore, liver transplantation outcomes are worse in recipients with NASH or metabolic syndrome. Many recipients die due to cardiovascular complications and sepsis within a short follow-up period of 5 years.27 In 330 young patients with NASH who were morbidly obese, insulin-resistant, complicated with liver cirrhosis and end-stage liver failure, and underwent liver transplantation, 4% were pediatric patients, and 6% were younger than 25 years. The post-transplantation prognosis in these patients was very poor, and 30% died within a 4-year follow-up period.28
There are few studies on liver histopathology in NASH patients because it is difficult to perform a liver biopsy in pediatric patients. The present study highlights that severe hepatic pathology, such as hepatic fibrosis, is related with IR or insulin sensitivity index.
There are several potential mechanisms underlying NASH. One strong hypothesis among them is the ‘two-hit theory.’ The ‘first hit’ is an excessive hepatocyte TG accumulation resulting from IR and can be described as a TG imbalance. Fatty liver is caused by an accumulation of TG that is related with the first hit. This explains why a higher NAS is correlated with a higher TG level, as shown in Table 2. There are several mechanisms that affect the TG level. The first mechanism is an increased uptake of FFA. FFA contains TG that is hydrolyzed to FFA by lipoprotein lipase. Excessive FFA in the liver is converted to TGs, which leads to the accumulation of TG in the liver. The second mechanism is the suppression of FFA synthesis or increased synthesis in liver cells. This phenomenon depends on the intake of nutrients that can serve as substrates for fatty acid synthesis. Other mechanisms include reduced catabolism of FFA in liver cells or decreased release of TGs from liver cells. Increased IR can lead to the inhibition of lipolysis in lipid cells and the release of FFA from lipid cells in the liver.12
The ‘second hit’ involves an inflammatory injury to the liver due to oxidative stress. An increase in peroxidation and oxidative stress can activate stellate cells and accelerate liver fibrosis.12 As shown in Table 1 in the present study, most NASH patients were overweight and had large waist circumferences. We speculate that obesity stimulates the second hit because of fibrosis since leptin may be an important link between obesity and fibrosis. Oh, et al.29 also showed that the degree of NAFLD correlated with the degree of obesity. Obesity was shown to be required for the development of liver fibrosis in a steatohepatitis model.30
Jee, et al.31 found that hepatic ultrasonography was associated with NAS, steatosis, and ballooning change. Hepatic fibrosis, however, was not correlated with hepatic ultrasonography, therefore, a liver biopsy is still necessary to determine the most important information about the pathology of hepatic fibrosis. The finding in the present study suggests the relevance between IR and the degree of fibrosis because of the statistically significant correlation between these measures; one can predict the degree of liver fibrosis through the IR and ISI using a blood test. A liver biopsy is a very invasive test, which makes it difficult to perform in NAFLD patients. Furthermore, parents of many pediatric patients are very reluctant to allow their children to undergo a liver biopsy. In the future, we can apply this association to confirm liver fibrosis without biopsy. Although not statistically significant, high insulin level and HOMA-IR were observed even in the group with lower NAS, as shown in Table 2. It might be explained by the fact that fibrosis could progress in some patients with lower NAS, which was calculated by the sum of steatosis, lobular inflammation, and ballooning change, excluding fibrosis score.
In a study on adults with NAFLD, more severe hepatic fibrosis was correlated with increased liver-related morbidity and mortality.32 In addition, NASH has been recognized as an important cause of cirrhosis, liver transplantation, and hepatocellular carcinoma.33 Our present results found a correlation between fibrosis and IR, and that obesity may contribute to this result. Singh, et al.34 showed that the fibrosis progression rate is higher in patients with NASH, while mild degree NAFLD can also lead to fibrosis. NAFLs have mild lobular inflammation without hepatocyte ballooning or fibrosis, although this can progress to definite NASH because of persistent inflammation. In this case, there is a risk of poor outcomes and progressive liver damage, with fibrosis being the key to liver damage progression. In this analysis, the AST and ALT ratios were correlated with fibrosis progression. Recently, AST and ALT have been focused as markers of definite NASH. Our present study showed that higher AST was related to higher steatosis that defines the NASH score, and Patton, et al.35 also found that highly severe NASH was associated with high AST levels.
A previous study showed that HOMA-IR was higher in the NAFLD group than in the control group and was also significantly correlated with liver enzyme levels. Moreover, they found a significant difference in HOMA-IR between simple steatosis patients and NASH patients.36 In adults, QUICKI ranged between 0.45 in healthy individuals and 0.30 in diabetic patients, while it ranged from 0.31 to 0.33 in obese children of Swedish population study and IR pediatric patients.37 In our cohort, impaired IR were identified using HOMA-IR and QUICKI, and especially impaired IR were found in subjects with lobular inflammation and severe fibrosis in liver histopathology. In addition, decreased insulin sensitivity was associated with more severe steatosis and fibrosis. Therefore, there was a significant impairment of IR and decrease of insulin sensitivity in our co-hort, indicating that IR plays an important role in development and progression of NASH. IR indices showed significant differences according to the severity of hepatic fibrosis. On the other hand, however, there was no significant correlation between fasting glucose level and the severity of hepatic fibrosis in our study. Carter-Kent, et al.38 also reported no association between fasting glucose and hepatic fibrosis in children with NASH.
Takahashi, et al.39 reported that steatosis was more severe in pediatric cases than in adult cases. In contrast, ballooning and lobular inflammation were milder in pediatric cases. The severity of periportal fibrosis was almost the same in both cases. In our study, more than half of the patients showed higher grade of steatosis and lower grade of lobular inflammation.
Age can influence the severity of NASH. As shown in Table 2, mean patient age in our study was higher in the high NAS group than in the low score group, and hepatic steatosis was corre-lated with age, AST, and ISI-FFA (Table 3). In liver pathology, hepatic steatosis is known as the ‘first hit’ in the development of NASH.40 Severity of hepatic steatosis was also predicted based on age. Accordingly, the amount of hepatic fat accumulation increases with aging and the duration of obesity. Recently, the effects of hepatic steatosis on IR have been elucidated. Cali, et al.41 reported that NASH patients showed impairment in beta-cell function and a decrease in insulin sensitivity, both of which indicate the severity of hepatic steatosis. The harmful effects of fat accumulation in the liver can affect insulin sensitivity at a multi organ level. Consequently, insulin secretion is decreased so that it is difficult to maintain glucose level, developing beta-cells long-term. A similar Korean study showed that the more hepatic steatosis is severe, the more type 2 DM presents, concluding that IR caused by hepatic fat accumulation may be a critical mechanistic connection.42
In obese children, beta-cell function is reduced according to age. Arata, et al.12 performed a meta-analysis of several studies to suggest the underlying mechanism in the development of IR in pediatric nonalcoholic steatohepatitis and nonalcoholic fatty liver disease; IR is an important factor in the first hit of the two-hit model of NASH.
In conclusion, we found that correlations among hepatic histopathologic findings, clinical characteristics, and IR that have an important role in the development of NASH. Patients with high IR had more severe lobular inflammation and hepatic fibrosis. The higher the serum TG level, the higher the NAS, and the more severe the ballooning change. Finally, analyses of biochemical and endocrine parameters could be applied to determine the severity of hepatic pathologic status in patients with NAFLD, especially in many children who cannot undergo a liver biopsy.

Notes

The authors have no financial conflicts of interest.

References

1. Oh K, Jang MJ, Lee NY, Moon JS, Lee CG, Yoo MH, et al. Prevalence and trends in obesity among Korean children and adolescents in 1997 and 2005. Korean J Pediatr. 2008; 51:950–955.
crossref
2. Farrell GC, van Rooyen D, Gan L, Chitturi S. NASH is an inflammatory disorder: pathogenic, prognostic and therapeutic implications. Gut Liver. 2012; 6:149–171. PMID: 22570745.
3. Watanabe S, Hashimoto E, Ikejima K, Uto H, Ono M, Sumida Y, et al. Evidence-based clinical practice guidelines for nonalcoholic fatty liver disease/nonalcoholic steatohepatitis. J Gastroenterol. 2015; 50:364–377. PMID: 25708290.
crossref
4. Angulo P. Nonalcoholic fatty liver disease. N Engl J Med. 2002; 346:1221–1231. PMID: 11961152.
crossref
5. Brunt EM, Janney CG, Di Bisceglie AM, Neuschwander-Tetri BA, Bacon BR. Nonalcoholic steatohepatitis: a proposal for grading and staging the histological lesions. Am J Gastroenterol. 1999; 94:2467–2474. PMID: 10484010.
crossref
6. Ko JS. [Nonalcoholic fatty liver disease]. Korean J Gastroenterol. 2010; 56:6–14. PMID: 20664312.
crossref
7. Seo JW. Nonalcoholic fatty liver disease in children. Korean J Pediatr Gastroenterol Nutr. 2011; 14:209–221.
crossref
8. Venkatesan P, Tiwari A, Dasgupta R, Carey M, Kehlenbrink S, Wickramanayake A, et al. Surrogate measures of insulin sensitivity when compared to euglycemic hyperinsulinemic clamp studies in Asian Indian men without diabetes. J Diabetes Complications. 2016; 30:287–291. PMID: 26718937.
crossref
9. Katz A, Nambi SS, Mather K, Baron AD, Follmann DA, Sullivan G, et al. Quantitative insulin sensitivity check index: a simple, accurate method for assessing insulin sensitivity in humans. J Clin Endocrinol Metab. 2000; 85:2402–2410. PMID: 10902785.
crossref
10. Matthews DR, Hosker JP, Rudenski AS, Naylor BA, Treacher DF, Turner RC. Homeostasis model assessment: insulin resistance and beta-cell function from fasting plasma glucose and insulin concentrations in man. Diabetologia. 1985; 28:412–419. PMID: 3899825.
11. Belfiore F, Iannello S, Volpicelli G. Insulin sensitivity indices calculated from basal and OGTT-induced insulin, glucose, and FFA levels. Mol Genet Metab. 1998; 63:134–141. PMID: 9562967.
crossref
12. Arata M, Nakajima J, Nishimata S, Nagata T, Kawashima H. Non-alcoholic steatohepatitis and insulin resistance in children. World J Diabetes. 2014; 5:917–923. PMID: 25512797.
crossref
13. Cho HC. Prevalence and factors associated with nonalcoholic fatty liver disease in a nonobese Korean population. Gut Liver. 2016; 10:117–125. PMID: 26260755.
crossref
14. Calcaterra V, Klersy C, Muratori T, Telli S, Caramagna C, Scaglia F, et al. Prevalence of metabolic syndrome (MS) in children and adolescents with varying degrees of obesity. Clin Endocrinol (Oxf). 2008; 68:868–872. PMID: 17980007.
crossref
15. Yi KH, Hwang JS, Kim EY, Lee SH, Kim DH, Lim JS. Prevalence of insulin resistance and cardiometabolic risk in Korean children and adolescents: a population-based study. Diabetes Res Clin Pract. 2014; 103:106–113. PMID: 24290751.
crossref
16. Ryoo JH, Hong HP, Park SK, Ham WT, Chung JY. The risk for insulin resistance according to the degree of non-alcoholic fatty liver disease in Korean men. J Korean Med Sci. 2016; 31:1761–1767. PMID: 27709854.
crossref
17. Cole TJ, Bellizzi MC, Flegal KM, Dietz WH. Establishing a standard definition for child overweight and obesity worldwide: international survey. BMJ. 2000; 320:1240–1243. PMID: 10797032.
crossref
18. Valerio G, Licenziati MR, Iannuzzi A, Franzese A, Siani P, Riccardi G, et al. Insulin resistance and impaired glucose tolerance in obese children and adolescents from Southern Italy. Nutr Metab Cardiovasc Dis. 2006; 16:279–284. PMID: 16679220.
crossref
19. Reinehr T, Kiess W, Andler W. Insulin sensitivity indices of glucose and free fatty acid metabolism in obese children and adolescents in relation to serum lipids. Metabolism. 2005; 54:397–402. PMID: 15736120.
crossref
20. Brown RJ, Yanovski JA. Estimation of insulin sensitivity in children: methods, measures and controversies. Pediatr Diabetes. 2014; 15:151–161. PMID: 24754463.
crossref
21. Hrebícek J, Janout V, Malincíková J, Horáková D, Cízek L. Detection of insulin resistance by simple quantitative insulin sensitivity check index QUICKI for epidemiological assessment and prevention. J Clin Endocrinol Metab. 2002; 87:144–147. PMID: 11788638.
22. Kleiner DE, Brunt EM, Van Natta M, Behling C, Contos MJ, Cummings OW, et al. Design and validation of a histological scoring system for nonalcoholic fatty liver disease. Hepatology. 2005; 41:1313–1321. PMID: 15915461.
crossref
23. Larter CZ, Chitturi S, Heydet D, Farrell GC. A fresh look at NASH pathogenesis. Part 1: the metabolic movers. J Gastroenterol Hepatol. 2010; 25:672–690. PMID: 20492324.
crossref
24. Chitturi S, Abeygunasekera S, Farrell GC, Holmes-Walker J, Hui JM, Fung C, et al. NASH and insulin resistance: insulin hypersecretion and specific association with the insulin resistance syndrome. Hepatology. 2002; 35:373–379. PMID: 11826411.
crossref
25. Marchesini G, Bugianesi E, Forlani G, Cerrelli F, Lenzi M, Manini R, et al. Nonalcoholic fatty liver, steatohepatitis, and the metabolic syndrome. Hepatology. 2003; 37:917–923. PMID: 12668987.
crossref
26. Wong RJ, Aguilar M, Cheung R, Perumpail RB, Harrison SA, Younossi ZM, et al. Nonalcoholic steatohepatitis is the second leading etiology of liver disease among adults awaiting liver transplantation in the United States. Gastroenterology. 2015; 148:547–555. PMID: 25461851.
crossref
27. Wang X, Li J, Riaz DR, Shi G, Liu C, Dai Y. Outcomes of liver transplantation for nonalcoholic steatohepatitis: a systematic review and meta-analysis. Clin Gastroenterol Hepatol. 2014; 12:394–402. PMID: 24076414.
crossref
28. Alkhouri N, Hanouneh IA, Zein NN, Lopez R, Kelly D, Eghtesad B, et al. Liver transplantation for nonalcoholic steatohepatitis in young patients. Transpl Int. 2016; 29:418–424. PMID: 26402655.
crossref
29. Oh MS, Kim S, Jang JH, Park JY, Kang HS, Lee MS, et al. Associations among the degree of nonalcoholic fatty liver disease, metabolic syndrome, degree of obesity in children, and parental obesity. Pediatr Gastroenterol Hepatol Nutr. 2016; 19:199–206. PMID: 27738602.
crossref
30. Leclercq IA, Farrell GC, Schriemer R, Robertson GR. Leptin is essential for the hepatic fibrogenic response to chronic liver injury. J Hepatol. 2002; 37:206–213. PMID: 12127425.
crossref
31. Jee SJ, Kim YJ, Song SY, Paik SS. [Association among histopathology, clinical manifestation, and ultrasonographic grades in pediatric non-alcoholic fatty liver disease]. Korean J Gastroenterol. 2011; 57:158–165. PMID: 21519163.
crossref
32. Matteoni CA, Younossi ZM, Gramlich T, Boparai N, Liu YC, Mc-Cullough AJ. Nonalcoholic fatty liver disease: a spectrum of clinical and pathological severity. Gastroenterology. 1999; 116:1413–1419. PMID: 10348825.
33. Bugianesi E, Leone N, Vanni E, Marchesini G, Brunello F, Carucci P, et al. Expanding the natural history of nonalcoholic steatohepatitis: from cryptogenic cirrhosis to hepatocellular carcinoma. Gastroenterology. 2002; 123:134–140. PMID: 12105842.
crossref
34. Singh S, Allen AM, Wang Z, Prokop LJ, Murad MH, Loomba R. Fibrosis progression in nonalcoholic fatty liver vs nonalcoholic steatohepatitis: a systematic review and meta-analysis of paired-biopsy studies. Clin Gastroenterol Hepatol. 2015; 13:643–654. PMID: 24768810.
crossref
35. Patton HM, Lavine JE, Van Natta ML, Schwimmer JB, Kleiner D, Molleston J. Nonalcoholic Steatohepatitis Clinical Research Network. Clinical correlates of histopathology in pediatric nonalcoholic steatohepatitis. Gastroenterology. 2008; 135:1961–1971. PMID: 19013463.
crossref
36. Rössner SM, Neovius M, Mattsson A, Marcus C, Norgren S. HOMA-IR and QUICKI: decide on a general standard instead of making further comparisons. Acta Paediatr. 2010; 99:1735–1740. PMID: 20545928.
crossref
37. Pirgon Ö, Bilgin H, Çekmez F, Kurku H, Dündar BN. Association between insulin resistance and oxidative stress parameters in obese adolescents with non-alcoholic fatty liver disease. J Clin Res Pediatr Endocrinol. 2013; 5:33–39. PMID: 23367495.
38. Carter-Kent C, Yerian LM, Brunt EM, Angulo P, Kohli R, Ling SC, et al. Nonalcoholic steatohepatitis in children: a multicenter clinicopathological study. Hepatology. 2009; 50:1113–1120. PMID: 19637190.
crossref
39. Takahashi Y, Inui A, Fujisawa T, Takikawa H, Fukusato T. Histopathological characteristics of non-alcoholic fatty liver disease in children: comparison with adult cases. Hepatol Res. 2011; 41:1066–1074. PMID: 22035383.
crossref
40. Day CP, James OF. Steatohepatitis: a tale of two “hits”? Gastroenterology. 1998; 114:842–845. PMID: 9547102.
crossref
41. Cali AM, De Oliveira AM, Kim H, Chen S, Reyes-Mugica M, Escalera S, et al. Glucose dysregulation and hepatic steatosis in obese adolescents: is there a link? Hepatology. 2009; 49:1896–1903. PMID: 19434725.
crossref
42. Chon YE, Kim KJ, Jung KS, Kim SU, Park JY, Kim DY, et al. The relationship between type 2 diabetes mellitus and non-alcoholic fatty liver disease measured by controlled attenuation parameter. Yonsei Med J. 2016; 57:885–892. PMID: 27189281.
crossref
Table 1

Anthropometric and Biochemical Laboratory Data of the Patients

ymj-58-756-i001
Clinical profiles Total (n=24)
Male (%) 19 (79.2)
Age (yr) 11.1±2.3
Anthropometric findings
 Normal weight (BMI <85th percentile) 00 (0)
 Overweight (BMI 85–95th percentile) 6 (25.0)
 Obesity (BMI >95th percentile) 18 (75.0)
 BMI (Z-score) 2.02±0.6
 Waist circumference (%) 94.8±4.3
 High waist circumference (>90th percentile) 22 (91.7)
Laboratory findings
 AST (IU/L) 69.9±48.6
 ALT (IU/L) 134.6±111.5
 TG (mg/dL) 166.4±85.6
 Total cholesterol (mg/dL) 183.8±40.9
 FFA (µmol/L) 578.9±253.2
 Fasting glucose (mg/dL) 96.5±11.2
 Fasting insulin (µU/mL) 36.7±41.1
 Insulin resistance-HOMA 5.33±3.65
 Insulin resistance-QUICKI 0.29±0.06
 Insulin sensitivity-FFA 0.24±0.19

BMI, body mass index; AST, aspartate aminotransferase; ALT, alanine aminotransferase; TG, triglyceride; FFA, free fatty acid; HOMA, homeostasis model assessment; QUICKI, quantitative insulin sensitivity check index.

Table 2

Differences in Anthropometric and Laboratory Data Based on the NAFLD Activity Scores

ymj-58-756-i002
Anthropometric and laboratory data NAFLD activity score
0–4 score (n=8) 5–8 score (n=16) p value
Male (%) 7 (87.5) 12 (75.0)
Mean age 13.0±2.0 10.25±1.73 0.012
BMI (Z-score) 1.96±0.42 2.05±0.66 0.443
Obesity index 45.97±17.38 41.29±20.32 0.320
Abdominal circumference 91.3±7.39 95.6±2.9 0.970
AST 59.3±58.6 75.3±43.9 0.153
ALT 133.3±155.3 135.3±88.3 0.422
TG 125.0±86.03 187.13±80.08 0.040
Cholesterol 167.63±50.62 191.93±33.99 0.073
FFA 525.75±147.7 605.44±293.02 0.305
Fasting glucose 99.1±8.7 95.1±12.4 0.292
Fasting insulin 41.34±67.46 19.34±17.14 0.301
Insulin sensitivity-FFA 0.25±0.2 0.23±0.21 0.358
Insulin resistance-HOMA 05.8±4.63 5.12±3.59 0.668
Insulin resistance-QUICKI 0.29±0.02 0.31±0.03 0.186

BMI, body mass index; AST, aspartate aminotransferase; ALT, alanine aminotransferase; TG, triglyceride; FFA, free fatty acid; HOMA, homeostasis model assessment; QUICKI, quantitative insulin sensitivity check index; NAFLD, non-alcoholic fatty liver disease.

Table 3

Correlations between Biochemical Laboratory Results and Each Pathologic Finding (p values)

ymj-58-756-i003
Biochemical laboratory profile Steatosis Ballooning change Lobular inflammation Portal inflammation Fibrosis
Age 0.023 0.635 0.232 0.298 0.834
BMI (Z-score) 0.354 0.890 0.757 0.168 0.918
AST 0.046 0.027 0.177 0.962 0.093
ALT 0.227 0.160 0.888 0.177 0.326
TG 0.339 0.017 0.122 0.616 0.179
Cholesterol 0.273 0.659 0.143 0.847 0.623
Fasting insulin 0.186 0.508 0.076 0.757 0.040
Fasting glucose 0.978 0.087 0.151 0.463 0.775
ISI-FFA 0.023 0.804 0.448 0.616 0.049
HOMA-IR 0.273 0.283 0.014 0.728 0.028
QUICKI 0.636 0.196 0.023 0.824 0.007

BMI, body mass index; AST, aspartate aminotransferase; ALT, alanine aminotransferase; TG, triglyceride; ISI-FFA, insulin sensitivity indices-free fatty acid; HOMA-IR, homeostasis model assessment of insulin resistance; QUICKI, quantitative insulin sensitivity check index.

Table 4

Correlations between Fibrosis Results and Each Laboratory Finding

ymj-58-756-i004
Fibrosis grade Fasting insulin Fasting glucose ISI-FFA HOMA-IR QUICKI
0 13.15±1.2 106.0±4.24 0.62±0.08 3.44±0.18 0.32±0.01
1 19.5±3.82 92.67±8.87 0.15±0.08 4.5±1.24 0.31±0.01
2 25.63±11.05 96.5±8.89 0.14±0.07 6.19±3.02 0.30±0.02
3 26.2±8.63 93.8±12.93 0.13±0.06 6.3±1.47 0.29±0.01
p value 0.040 0.775 0.049 0.028 0.007

ISI-FFA, insulin sensitivity indices-free fatty acid; HOMA-IR, homeostasis model assessment of insulin resistance; QUICKI, quantitative insulin sensitivity check index.

TOOLS
Similar articles