

 PDF
PDF ePub
ePub Citation
 Print
Print


INTRODUCTION
Colorectal cancer (CRC) develops with multiple cumulative epigenetic and genetic alterations that sequentially lead to the neoplastic transformation of normal colorectal epithelial cells. Some of these transformed cells are diagnosed histopathologically as adenomas or cancers due to changes in cell morphology, wherein a population of daughter cells without morphologic change remains. Such findings have come to be known as field cancerization.12 Field cancerization is a well-documented process of malignant transformation, especially in epithelial tumor development.345
Compared to genetic mutations, epigenetic alterations are more likely to initiate neoplasms, as methylation rates are thought to be faster than genetic mutation rates.678 Aberrant DNA methylation of specific gene promoters has been found in the early precursor lesions for colon adenocarcinomas, proposing that a subset of colon cancers displays an epigenetic field defect.91011 The involvement of aberrant methylation in a field defect in adjacent normal mucosa (ADJ) of patients with CRC has been reported.12 Thus, the detection of normal-appearing mucosa with an epigenetic field defect may identify colorectal epithelium that is at significant risk of acquiring sequential molecular alterations that will lead to colorectal tumor formation and progression.13 Despite considerable evidence of increased methylation of some CpG islands (CGIs) in normal colorectal mucosa of both normal risk and high risk groups,1415 which CGI loci could play a role in cancer risk prediction and whether these differentially methylated genes (DMGs) have a rate-limiting stage of methylation change in the evolution process of colorectal carcinogenesis remains uncertain.
Because CGI hypermethylation is an early event in colorectal tumorigenesis, some epigenetic alterations may be detectable in normal appearing colorectal mucosa in CRC patients that is histologically normal but primed to become neoplastic. Thus, we presumed that adjacent areas of CRC would have a differential methylation profile from that of healthy normal colonic mucosa. In this study, we aimed to focus on left-sided colorectal cancer (LCA), because methylation associated with the serrated pathway is well known in the carcinogenesis in right colon cancer, whereas methylation is not well known in LCA. Also, for the evaluation of methylation levels in the colon mucosa, biopsy specimens were easier to obtain for the left colon than the right colon via endoscopy. We hypothesized that methylation changes in DMGs would be apparent early during colorectal tumorigenesis. To test this, we sought DMG promoters as candidate field defect markers using LCA and normal-looking adjacent tissue sample pairs. Then, we compared the methylation status of selected DMG promoters between ADJ and matched controls to identify a methylation marker for CRC risk prediction, as well as to document the rate-limiting step of aberrant methylation in CRC tumorigenesis.
MATERIALS AND METHODS
Colorectal tissue samples and DNA extraction
LCA samples were collected through resected specimens from patients who were diagnosed with CRC at Wonju Severance Christian Hospital. ADJ tissue samples in patients with LCA were also obtained from two quadrants within the specimens, located 5–10 cm from the lesion. A total of 33 pairs of LCA-ADJ samples were collected (Table 1 and 2) and examined: 11 pairs were from the sigmoid colon, and 22 pairs were from the rectum. Thirty-three age- and sex-matched, left normal colorectal mucosa (LNM) samples were obtained from healthy controls that underwent screening colonoscopy during the same period. Together with fresh-frozen biopsied tissues in LNM, serial sections of paraffin-embedded tissue blocks were made using the simultaneously biopsied specimen and examined for histologic diagnosis. Paraffin-embedded tissue sections showed more than 70% cellularity of cancer cell populations in all cases. This study protocol was approved by the Institutional Review Board of Wonju Severance Christian Hospital (CR312041), and informed consent was obtained from each patient and control.
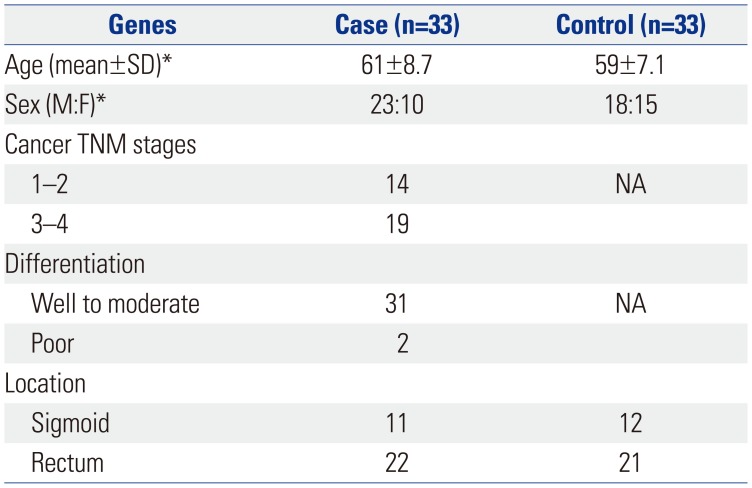
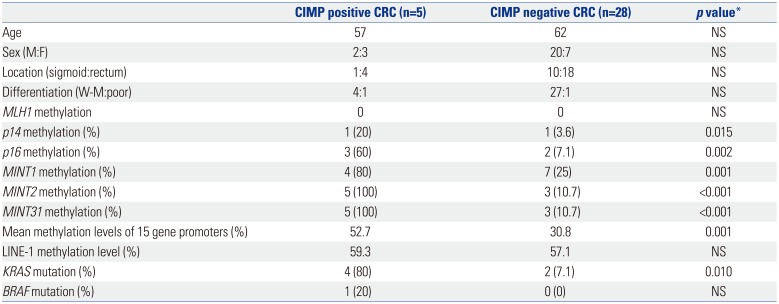
Table 1
Clinicopathological Features of Distal Colon Cancer Cases and Controls
![]()
Table 2
Comparison of Parameters According to the CIMP Status of Distal Cancers
![]()
Bisulfite PCR and pyrosequencing analysis of DNA methylation
Genomic DNA extracted from colorectal tissues were modified by sodium bisulfite treatment16 using Wizard DNA purification resin (Promega, Madison, WI, USA) according to the manufacturer's instructions. Then, a bisulfite-pyrosequencing assay was performed to quantitatively assess DNA methylation levels in the tissue samples.17 Bisulfite PCR primers were designed as close to the transcription start site as possible, and either one-step or two-step PCR reactions were performed using 1 µL of bisulfite-converted genomic DNA. After bisulfite PCR, the PCR product was immobilized on streptavidin-sepharose beads (Amersham, Uppsala, Sweden) and denatured, after which the biotinylated strands were released into an annealing buffer containing the sequencing primer. Pyrosequencing was carried out using PSQ HS 96 Gold SNP Reagents on a PSQ HS 96 machine (Biotage, Uppsala, Sweden). The methylation levels at different sites using pyrosequencing were averaged to represent the degree of methylation for each sample or gene. LINE-1 promoter methylation, as a global methylation index, was assayed using primers and conditions as described previously.18 Each PCR run included separate reactions with template peripheral blood DNA from normal volunteers and blank reactions, with water substituted for DNA as negative controls. SssI methylase-treated DNA served as a positive control. Each pyrosequencing experiment was done at least twice.
Genetic hotspot mutation analysis for KRAS and BRAF
For the detection of hotspot mutations, KRAS mutations at codons 12 and 13 were determined by genomic PCR and pyrosequencing with minor modification.19 Each PCR mix contained forward and reverse primers (each 20 pmol), 2.81 nmol each of dNTP, 3 mmol/L MgCl2, 1×PCR buffer, 1.25 U of Taq polymerase, and 5 µL of template DNA product in a total volume of 50 µL. PCR conditions consisted of initial denaturing at 94℃ for 2 minute; 55 cycles of 95℃ for 20 seconds, 58℃ for 20 seconds, and 72℃ for 40 seconds; and final extension at 72℃ for 2 minute. BRAF mutation (V600E) was also determined by a genomic PCR and pyrosequencing method previously used.20 All primers for genomic PCR amplification and pyrosequencing are listed in Supplementary Table 1 (only online).
Statistical analysis
Methylation levels (%) at each gene promoter and for each sample were analyzed as a continuous variable for all examined CpG sites. The cutoff value for the methylation frequency was defined as the value of mean methylation % of each gene +1 standard deviation (SD) in controls. Comparisons of categorical variables were made using the chi-square test and Fisher exact test where appropriate. Associations between continuous variables or levels of promoter methylation and clinicopathologic variables were evaluated using nonparametric Mann-Whitney test. Analysis of z scores was used to normalize the methylation levels of selected genes, and the total sum of the z scores was used for comparison of methylation status with clinicopathologic features. z score was calculated as follows: z score=(methylation level of each sample-mean value of methylation level)/SD of methylation level. Correlations among methylation densities were evaluated using the Spearman test with significance set at p<0.05. All statistical analyses were performed using SPSS software (version 14.0; SPSS Inc., Chicago, IL, USA).
RESULTS
Clinicopathologic features of distal colorectal cancer cases and controls
Clinicopathologic characteristics of cases with LCA and controls without cancer are shown in Table 1. We observed no significant differences in sex and age between groups. Histologic examination revealed that well or moderately differentiated carcinomas were predominant, compared with poorly differentiated types. Regarding LCA location, 22 (67%) were from the rectum, and 11 (33%) were from the sigmoid colon.
Selection of candidate field methylation markers
Based on a candidate gene approach, we selected a total of 27 candidate markers for promoter-associated methylation (Supplementary Table 1, only online) and carried out bisulfite pyrosequencing analysis. Of these, three candidate markers (BARHL, HAND1, GDNF) were selected by methylated CGI amplification and microarray,21 and three markers (DOK5, SLC16A12, SPOCK2) were chosen by methylated CGI amplification coupled with representational difference analysis in CRC cell lines.22 We collected 21 genes [ABHD9, ALX4, BNIP3, CD8a, ER, GLUT3(SLC2A3), IGFBP3, IRF1, KLF7, MAL, MGMT, MLF1, MYOD, PAX6, PDCD8, PRDM5, RORA, SFRP1, TFAP2C , WIF1, XAF1] from a literature search that were described as potential methylated tumor suppressor genes or age- or cancer-related methylation genes in gastrointestinal cancer cells or tissues.2021222324252627282930 In addition, we examined six classical CpG island methylator phenotype (CIMP) methylation markers (MLH1, p14, p16, MINT1, MINT2, MINT31) to assess associations with the field methylation status of each candidate gene.31 First, we determined the levels of CGI methylation of candidate genes using seven CRC cell lines (CaCo2, HT29, HCT116, LoVo, RKO, SW48, and SW480) obtained from the American Type Culture Collection (Manassas, VA, USA) and compared them with those in normal blood DNA obtained from two healthy individuals (Supplementary Table 2, only online).
Frequent methylation of selected markers in distal colorectal cancer
Using the cancer-adjacent sample pairs, we found 15 DMGs in cancers that could be considered as potential field methylation markers. Thus, 15 markers, except for six CIMP markers, were selected for further study to explore methylation markers of field cancerization. Mean methylation levels in 33 LCA-ADJ pairs and 33 LNMs are shown in Table 3. We confirmed that the methylation levels of these 15 DMGs were significantly higher in LCA than in ADJ samples (p<0.05 for each marker) (Table 3).
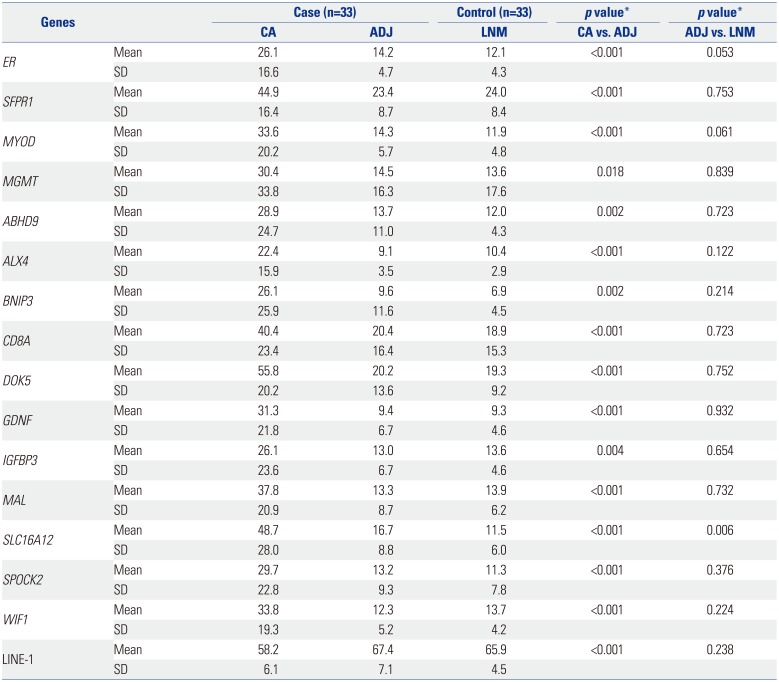
Table 3
Methylation Status of 15 Differentially Methylated Genes and LINE-1 in Case and Control Samples
![]()
Uncommon promoter hypermethylation in distal colorectal cancer field
We further compared the methylation status of these 15 genes between ADJ samples and LNM control samples to identify potential field methylation markers. In terms of methylation level, only solute carrier protein 16 (SLC16A12) showed significantly higher methylation in ADJ than in LNM (16.7% vs. 11.5%, p=0.006). Also, methylation levels of ER and MYOD revealed tendency of marginally higher methylation, but those were not statistically significant. When we classified (dichotomized) cases into CIMP versus non-CIMP LCA samples based on the definition of CIMP case who had at least 3 or more hypermethylations among 6 markers (p14, p16, MINT1, MINT2, MINT31, and MLH1), we found that no gene promoters showed higher methylation in ADJ of CRC cases with CIMP than in those without CIMP.
To assess the possibility of these field methylation markers for cancer prediction, receiver operating curves using quantitative data were plotted for the SLC16A12 candidate field methylation marker (data not shown). Comparing ADJ to normal epithelia, the area under the curve value of SLC16A12 was 0.7. In addition, the sensitivity and specificity using this marker using ADJ samples was low. These findings indicated that aberrant methylation of the SLC16A12 gene in a cancer field would not be sufficient as a marker for CRC prediction.
KRAS and BRAF mutations in cancer and cancer fields
Mutations in KRAS codons 12 and 13 (6/33, 18%) were detected in a significantly higher percentage of CRCs than BRAF V600E mutations (3%, 1/33). However, no mutations were found in the ADJ or control LNM samples. In six of the 33 CRCs with KRAS mutations, the G to A transition of codon 12 (G12D) was most common (three cases), and other mutations were codon 12 GGT-to-GTT (G12V) in two cases and codon 13 GGC-to-GAC (G13D) in one case.
CIMP status, KRAS mutation, and cancer field methylation
Of 33 LCA samples, five (15%) were CIMP positive CRCs, defined by hypermethylation of ≥three of the six classic markers. Clinicopathologic features of CIMP positive samples were not different from CIMP negative samples of LCA (Table 2). hMLH1 methylation (two different loci studied) was not found in any of the LCA samples studied, whereas another five CIMP markers showed significantly higher methylation in CIMP positive LCA samples. Also, the mean methylation levels of 15 DMGs were higher in CIMP positive than in CIMP negative LCA samples (52.7% vs. 30.8%, p=0.001). However, LINE-1 methylation levels were not significantly different between CIMP positive and CIMP negative LCA samples (59.3% vs. 57.2%), and methylation status between CIMP positive and CIMP negative ADJ samples was not different in terms of sum of z scores for 15 DMGs. In addition, methylation status of ADJ showed marginal difference from LNM controls in terms of sum of z scores for 15 DMGs (-0.355 vs. -0.464, p=0.096).
The frequencies of KRAS or BRAF mutation were higher in CIMP positive LCAs than CIMP negative cases (Table 2). LCA with mutant KRAS showed significantly higher methylation, regarding both numbers of DMGs (8/15) and mean methylation level of all 15 DMGs, than those without (54.5% vs. 33.9%, p=0.004). However, these associations of CIMP status or KRAS mutation with cancer tissue methylation did not appear in ADJ samples. These results indicate that methylation profiles of LCA fields, 5–10 cm apart from the cancer lesion, are not an adequate marker for CRC risk prediction or tumor characterization.
Correlation of cancer field methylation between different genes and to age
Based on the data from methylation analyses using continuous percentage variables in ADJ, ER, and WIF1 methylation levels increased with age (R=0.370 and 0.558, p=0.034 and 0.001, respectively), whereas other markers had little correlation to age, except two markers with marginal significance (MAL and SLC16A12, R=0.302 and 0.322, p=0.088 and 0.068, respectively). Also, methylation levels of ER in ADJ samples exhibited modest correlations with SFRP1, MYOD1, and GDNF (R= 0.498, 0.497, and 0.563, p=0.003, 0.003, and 0.001, respectively).
Rare global DNA hypomethylation in cancer field
We also examined global DNA methylation status in ADJ areas (Table 3) using a LINE-1 assay, as described previously.18 Although the mean LINE-1 methylation level in ADJ samples was higher than that in LCA samples of cases (67.4% vs. 58.2%), it was similar to that in LNM controls (65.9%). In addition, CIMP positive CRC samples did not show a difference in LINE-1 methylation, compared with CIMP negative samples (59.3% vs. 57.1%). These results indicate that global DNA hypomethylation is also a rare event in distant CRC fields.
DISCUSSION
A subset of CRCs has an excessive amount of methylated genes, and it composes a distinct molecular subgroup of CRC with a unique phenotype.303132 These CIMP tumors have been frequently found in proximal location but not in distal area, suggesting the different methylation profile in distal, rectosigmoid colon cancer. However, the molecular nature of LCA in regards to CIMP remains unknown. In this study, 15% of LCAs showed CIMP positivity, and this result was relatively low, compared with previous findings.920 The methylation profile of LCA was dependent on CIMP status; mean methylation levels were significantly higher in CIMP positive CRCs (52.7% vs. 30.8%). Based on these findings of the two distinct subclasses of CIMP,20 CIMP1 subgroup showing MLH1 methylation or BRAF mutation was only one, whereas the four remaining CIMP positive LCAs were consistent with CIMP2, showing increased methylation levels for age-related genes or KRAS mutation. These results indicate that methylation profiling in CRC carcinogenesis pathway is dependent on the location of CRC.
In this study, KRAS mutation was closely related to the methylation profile of LCA, wherein LCAs with KRAS mutation showed more dense hypermethylation than those without, for eight of the 15 genes studied. Among these, KRAS mutation was closely associated with MGMT methylation status (p=0.003).12 These results suggest that genetic KRAS mutation is closely related to epigenetic promoter hypermethylation in LCA.
Molecular signatures of field cancerization have been documented for CRC showing multistep carcinogenesis. In multistep carcinogenesis, field cancerization goes through two levels of progression: molecular level alteration whereby histologically normal looking cells undergo sequential cumulative acquisition of genetic and epigenetic change, and phenotypic progression whereby neoplastic cells undergo phenotypic morphological change. At the phenotypic level of field cancerization, epigenetic alterations of multiple genes have been well depicted as an early and common process occurring in precancerous colorectal neoplasm with microscopic or gross morphologic change.33343536 However, alterations in methylation profiles and the rate-limiting step of gene-specific promoter methylation in LCA has not been documented at the molecular level. Thus, molecular profiling of normal-appearing tissue adjacent to cancer as a putative cancer field using appropriate control tissue would uncover useful biosensors for early cancer detection and risk assessment. In the present study, the SLC16A12 gene showed higher methylation in ADJ than in LNM. This indicates the presence of epigenetic field defects for some genes, even before the emergence of morphologic changes in colorectal mucosa in a subset of CRC. However, methylation levels of most DMGs in cancer did not differ between ADJ and LNM, indicating that promoter hypermethylation in distant cancer adjacent areas, a putative CRC field, is uncommon and that rate-limiting step of aberrant methylation during colorectal carcinogenesis is likely to occur with morphological alterations. Furthermore, the role of panels using the above potential field markers for LCA risk prediction would be suboptimal, because the detection sensitivity and specificity using methylation status of adjacent biopsy specimen from distant cancer field was low.
Uncommon aberrant methylation in the LCA field in this study can be explained by several reasons. One possible reason is a gradient of field defects in peri-cancer colorectal epithelium.34353637 In a previous study,12 moving closer to a cancer lesion, a higher methylation level of MGMT in adjacent mucosa was observed. Because the ADJ samples from adjacent mucosa located 5–10 cm away from cancer were obtained in the study, these samples were less likely to be methylated than those located closer to cancer. In addition, we did not find KRAS or BRAF mutations in ADJ samples, suggesting that this distant cancer field might not truly form a patch or field with genetically altered cells. Second, this lack of aberrant methylation in LCA fields is likely to be site-specific. Thus, we cannot exclude the possibility that proximal CRC showing high frequency methylation would show different methylation profiles in the right colon field.
Altered DNA methylation patterns are one of the key molecular events underlying the aging process.1530 Promoter methylation has been shown to increase, while global methylation declines with age in a gene- or tissue-specific manner.1838 Age-related methylation may change the physiology of normal cells in a way that makes them more susceptible to achieving secondary acquisition of molecular hits, which induce premalignant condition or malignant transformation.1215 We observed that age correlates with the methylation levels of some genes not in LNM but in ADJ; ER and WIF1 methylation levels were correlated with age in ADJ from cancer cases, but not in LNM from healthy controls. These observations support the idea that the methylation changes of selected age-related genes, even in a distant cancer field, may be involved as the initiating steps in colorectal carcinogenesis in older adults.
In this study, we used pyrosequencing methylation assay to assess how many DNA alleles out of tested DNA alleles were methylated at target CpG sites. This method makes highly quantitative data regarding the methylation status at single-CpG resolution within the length of the sequence read. However, methylation-specific real-time PCR-based methods, such as MethyLight,39 can yield different results, because this technology can assess the percentage of DNA alleles with concurrent methylation at serial CpG sites among the assayed DNA alleles and can detect very low levels of methylation. Further studies are needed to investigate this possibility.
In summary, we found little difference in the promoter methylation status of multiple DMGTs in non-neoplastic epithelium between patients with and without LCAs. These findings suggest that promoter hypermethylation is a common defect in LCAs and that the rate-limiting step of epigenetic methylation is likely to be a translational period from adjacent mucosa with cancer fields to cancer rather than that from normal mucosa to adjacent tissue with cancer field. More comprehensive high-throughput analyses using methylation biomarkers for the discovery of epigenetic biomarkers for the prediction of cancer field would be warranted.
 XML Download