

 PDF
PDF ePub
ePub Citation
 Print
Print


INTRODUCTION
Rotavirus is the leading cause of acute gastroenteritis in infants and young children. It causes severe diarrhea and can lead to dehydration. Globally, it causes more than a half million deaths each year in children younger than five years. Also, it leads to two million hospitalizations and 25 million outpatient visits among children younger than five years worldwide. 12 Despite improvements in sanitation and hygiene, the incidence of rotavirus gastroenteritis has not markedly decreased, even in developed countries. This is the reason for the development of the rotavirus vaccine.
In August 1998, the RotaShield® (Wyeth, Delaware Valley, PA, USA) vaccine was first approved to prevent rotavirus gastroenteritis. Soon after its introduction, the risk of intussusception (IS) increased 20 to 30 times over the expected risk for children of this age group within two weeks following their first dose of the RotaShield® vaccine.3456 Based on the results of investigations, the US Centers for Disease Control and Prevention estimated that one or two additional cases of IS would be caused among each 10000 infants vaccinated with the RotaShield® vaccine. In October 1999, RotaShield® was withdrawn from the market.
RotaTeq® (Merck, West Point, PA, USA), a pentavalent rotavirus vaccine, and Rotarix®, a monovalent rotavirus vaccine, were licensed in the United States in 2006 and 2008, respectively. 78 Because of the previous association between rotavirus vaccination and IS, large studies were done before licensing. No increased risk was found for IS after each vaccine.910 In 2009, rotavirus vaccination was recommended by the World Health Organization for all infants.11 Post-licensure studies of the association between vaccine and IS have been published in the United States, Australia, and Latin America. Studies from Australia, Brazil, and Mexico and one of three studies from United States have found an increased risk of IS.101213141516171819
In Korea, a recent study has estimated the incidence of rotavirus-related gastroenteritis in children less than five years old to be 56.9 cases/1000 children.20 Rotavirus gastroenteritis rarely causes mortality, although it causes significant morbidity in Korea. In Korea, RotaTeq® and Rotarix® were first used in 2007 and 2008, respectively. Even though it has not been included in the National Immunization Program (NIP), the rate of rotavirus vaccination has been increasing consistently, and in 2010, the rate had reached 60.8%. However, no studies have been conducted in Korea that prove or disprove the association between rotavirus vaccination and IS. The aim of this study was to evaluate the association between the rotavirus vaccine and IS in Korea.
MATERIALS AND METHODS
We reviewed the medical records of children below 12 months of age who the visited the outpatient clinic and emergency room of Severance Children's Hospital from January 1, 2005, to December 31, 2013. Confirmed IS cases were identified retrospectively by searching hospital databases using ICD-9-CM codes. Each case was confirmed with ultrasonography by an expert radiologist. We collected information regarding the vaccination schedule of all patients. As our hospital started to use only pentavalent rotavirus vaccine in November 2007, we analyzed the data of the RotaTeq® vaccine only. We defined the risk window to constitute four weeks after the vaccination day, because rotavirus vaccination-associated IS is known to occur within one month after vaccination, especially following the first dose.3
We first compared the pre-vaccination and post-vaccination times of patients with IS. The observation period was divided into two-month intervals. Standard Poisson-based met were used, and 95% confidence intervals (CIs) were calculated.
Then, we compared our vaccine-associated IS cases in our study with those from the United States data, which were part of the Vaccine Safety Datalink project.19 We used comparative incidence figures (CIFs) and 95% CIs calculated by Byar's method. Based on the difference in the incidence of IS in the two compared countries, we adjusted the CIFs accordingly.2122
Lastly, we compared the observed number of cases with expected numbers. The relative risk was obtained by dividing the number of observed excess by the number of expected cases. The number of expected cases of IS in the risk window period was calculated by multiplying the child-time at risk post vaccination by the estimated background incidence of IS. The former was obtained by identifying the number of children who had received the RotaTeq® vaccine during the period of observation from our hospital's database. Calculations were made separately for each dose of the vaccine. The annual incidence of IS in our hospital was estimated by dividing the number of cases of IS by the number of children younger than 12 months old.
We calculated the ratio of observed to expected incidence (standardized incidence ratio), which provides an estimated relative risk under the assumption of constant relative risk. Standard poisson-based methods were used, which produced 95% CIs for these relative risks. IBM SPSS statistics, version 20 (SPSS Inc., Chicago, IL, USA) were used to conduct all the analysis.
This study was approved by the Institutional Review Board of Severance Hospital, Yonsei University College of Medicine, Seoul, Korea (IRB number: 4-2016-0314).
RESULTS
From January 1, 2005 to December 31, 2013, a total of 63915 children below 12 months of age visited our hospital. From November 1, 2007 to December 31, 2013, a total of 10530 doses of RotaTeq® vaccine were prescribed to 4206 infants (Tables 1 and 2). In the same period, 65 cases of IS were identified and treated in children below 12 months of age (Fig. 1, Table 3). There was a total of 12 cases diagnosed as IS after RotaTeq® administration. Ten of these were diagnosed more than four weeks after vaccination for rotavirus and could not be defined as rotavirus vaccination-associated IS. Two cases were identified within four weeks of RotaTeq® administration. No cases of IS were found after the first dose of RotaTeq® in our hospital. Both cases were treated by manual reduction.
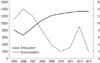
When we calculated the incidence over the observation period, divided into two-month intervals, we observed a periodic increase in incidence; however, the overall pattern was a decline in incidents. When we compared the incident rate using standard poisson-based methods, a decrease in the risk ratio by 0.51 was observed, and there were no increased risks of IS on post-vaccination status, compared with pre-vaccination status (Fig. 2, Table 4).
Since there were only two cases of rotavirus vaccination determined among the total cases identified as IS, we compared our data with the United States for the same type of rotavirus vaccination to identify whether pentavalent rotavirus vaccination increases the risk of IS (Table 5).19 Compared with the six cases among 999123 doses in United States from April 2008 to March 2013, the calculated CIF was 31.63 (CI, 31.33–31.93). However, after taking into consideration the difference in the background incidence rate of IS between the two countries,22 the incidence rate was determined to be seven times higher in Korea than in the US.
Rather than comparing this pattern with that of another country, we decided to compare these results within our hospital. The expected case per vaccination was calculated using the background rate. Based on the assumption that IS is not associated with rotavirus vaccination, we calculated the relative risk and 95% CI (Table 6). The results for our hospital showed that the rotavirus vaccine caused no increasing risk of IS.
To aid our understanding of the outcome of this study, we examined the rotavirus antigen test results from 2005 to 2013 in our hospital (Table 7). A decreasing pattern for the rate of positive rotavirus antigen tests was observed.
DISCUSSION
Generally, natural rotavirus infection is not believed to cause IS.23242526 However, the first-developed live oral tetravalent rotavirus, RotaShield®, was withdrawn due to an increasing risk of IS. This is thought to be based on a difference in the viral strain used in that vaccine; however, its mechanisms are not fully understood yet.27 Despite the fact that post-licensure studies showed no increased risk of IS after rotavirus vaccination, this matter is still the subject of debate. According to a recent study conducted in the United States, RotaTeq® was found to increase cases of IS by approximately 1.5 (95% CI, 0.2 to 3.2) per 100000 recipients after one dose, although no significant increase in risk was shown after the second and third doses.2829 In Mexico, the first dose of the rotavirus vaccine was associated with an increased risk of IS between 5.3 and 5.8 within seven days after vaccination. By contrast, in Brazil, a second dose of the vaccine increased the risk of IS by 1.9 to 2.6 within seven days after vaccination, while no increased risk of IS was seen after the first dose.16 In Australia, two studies conducted showed opposite results. One found an increased risk of IS after both pentavalent and monovalent vaccination.18 However, another showed no overall increased risk of IS after both types of vaccination.17
When we used CIFs, the rotavirus vaccine-associated IS rate at our facility was 31.63 times higher than that of the United States report. However, after taking into consideration the difference in the background incidence rate of IS between the two countries, the incidence rate was seven times higher in our hospital. However, one thing that needs to be considered here is that our data, which are from a single center study, are smaller compared to the United States data. Also, given that our facility is a tertiary medical center, the number of patients diagnosed and treated for IS may be much higher than the number of patients who visit for the sole purpose of receiving vaccinations. Nevertheless, when we compared the cases with the expected cases, there was no increased IS risk associated with pentavalent rotavirus vaccination during the window period of four weeks post-vaccination, compared to the background incidence rate. These factors could have contributed to such discrepancy. In fact, a decreasing tendency was observed. Also, a fewer number of patients tested positive for rotavirus antigen overall.
There are some limitations in this study. First, it was not based on nationwide data. Since the data were collected only in our hospital, the numbers of corresponding data were small. Despite the results that showed RotaTeq® does not increase the risk of IS, it is thought that the precision of the estimates was affected by the number of cases. Second, the incidence rate of natural IS in Korea is unknown. The trend of the incidence rate of IS in children below 12 months of age in our hospital showed a decreasing pattern, from 142 cases to 15 cases per 100000 children during the observation period. This is quite low compared with 47 cases in United States,13 81 cases in Australia,30 28.9 in Singapore,31 19.70–47.83 in Thailand,32 and 38 in Switzerland.33 There is one report from Jeonbuk Province in Korea showing 236 cases per 100000 children below 12 months of age,22 although nationwide data are needed to fully understand and interpret the results of this study. Third, our data were collected by reviewing electronic medical records. There could have been some missing data regarding medical conditions that can foster IS. Rotavirus vaccination is not included currently in the NIP in Korea. This means that it is not covered by insurance as Korea has a National Health Insurance System. This makes it extremely difficult to assess rotavirus vaccination status of all children in the country. We are planning to expand our study by obtaining data from multiple centers and eventually from all of Korea. Lastly, this study only investigated the effects of a pentavalent vaccine. Our center uses RotaTeq only, and thus, we do not have any information on the effects of Rotarix®, which is a monovalent vaccine.
Many studies examining whether IS is associated with rotavirus vaccination are being conducted, and no consensus has been reached yet. However, the fact that rotavirus-associated morbidity has decreased has been established in many countries is why we need to weigh the risks against benefits.
Rotavirus vaccines are still not included in the Korean NIP. As mentioned previously, there are rare mortalities, but considerable morbidities, still associated with rotavirus gastroenteritis. Rotavirus has strong infectivity and can spread to more than 50 children in one minute. To cover rotavirus vaccination within the NIP, stronger evidence regarding the safety and effectiveness of this vaccination is needed. Towards this, a large study should be conducted to determine the association between rotavirus vaccination and IS.


 XML Download