

 PDF
PDF ePub
ePub Citation
 Print
Print


INTRODUCTION
Acute kidney injury (AKI) is a common clinical problem in critically ill patients.123 The prevalence of AKI among intensive care unit (ICU) patients varies between 30–50%, with an attributed mortality rate varying between 28–90%.1234 Sepsis is a leading cause of AKI in clinical practice.5 It is estimated that more than 20% of septic patients may show some degree of AKI, and the mortality rate of this subgroup reaches up to 35%.6 Tissue hypoperfusion is the main reason for the development of sepsis-induced AKI.
Serum creatinine has typically been used for AKI diagnosis. However, the release of creatinine varies with age, gender, diet, muscle mass, drugs, hepatic dysfunction, and immobility.78910 Furthermore, serum creatinine levels become abnormal with a more than 50% reduction in the glomerular filtration rate (GFR).78910 Therefore, there is a delay between injury and the subsequent rise in serum creatinine, indicating that it might require up to 48 h before a sufficient increase becomes detectable.78910 Thus, the diagnosis of AKI and prognostic prediction in patients with AKI are important in routine ICU practice. If AKI is diagnosed as early as possible, preventive measures, such as avoiding nephrotoxic drugs and radiocontrast exposure, can be undertaken. Therefore, early diagnosis can help to prevent the development and progression of acute renal dysfunction.
Serum cystatin C is a new biomarker that has been used in recent years to diagnose AKI as early as possible.11 Cystatin C is a nonglycosylated 13-kDa protein and is a member of the cystatin superfamily of cysteine protease inhibitors. It is regularly produced by all nucleated cells, freely filtered at the glomerulus, mostly reabsorbed at the proximal tubule via megalin-mediated endocytosis, and finally catabolized. Cystatin C is well known as a good predictor of AKI development in critically ill patients. Compared to serum creatinine, the level of serum cystatin C is not significantly affected by age, gender, race, or muscle mass.2
The use of serum cystatin C as an early detector of AKI has been evaluated in several studies.78910 However, the role of serum cystatin C for the prediction of renal function recovery has not been well established. Therefore, the aim of this study was to assess the value of serum cystatin C for the early detection and prediction of renal function recovery in patients with sepsis.
MATERIALS AND METHODS
Study population
This study was a prospective cohort study, performed in a medical ICU of a 2500-bed tertiary university hospital in South Korea. The medical ICU is a 30-bed closed unit that is managed by certified ICU specialists who only care for ICU patients. We consecutively enrolled patients with sepsis admitted to the ICU for 5 months. Patients were excluded if they were <16 years of age or with a known history of chronic renal disease.
Sepsis was defined as the identification of infection site, in addition to two or more of the following systemic inflammatory response syndrome criteria: 1) body temperature less than 36℃ (96.8°F) or greater than 38℃ (100.4°F); 2) heart rate greater than 90 beats/min; 3) tachypnea of greater than 20 breaths/min or arterial partial pressure of carbon dioxide less than 4.3 kPa (32 mm Hg); and 4) white blood cell count of less than 4000 cells/mm3 (4×10⁹ cells/L) or greater than 12000 cells/mm3 (12×109 cells/L).12 Septic shock was defined as sepsis-induced hypotension persisting despite adequate fluid resuscitation.13 All eligible patients in this study were managed according to the guidelines of the “Surviving sepsis campaign: international guidelines for management of severe sepsis and septic shock: 2008”.13
AKI was defined according to the Risk, Injury, Failure, Loss of kidney function, and End-stage kidney disease criteria.14 The classification system includes separate criteria for creatinine [risk: 1.5-fold increase in serum creatinine level or >25% decrease in GFR; injury: two-fold increase in serum creatinine level or >50% decrease in GFR; and failure: three-fold increase in serum creatinine level or 75% decrease in GFR or increase in serum creatinine level to ≥4 mg/dL (≥354 µmol/L) with an acute increase ≥0.5 mg/dL (≥44 µmol/L)] and urine output (risk: urine output <0.5 mL·kg-1·h-1×6 h; injury: urine output <0.5 mL·kg-1 ·h-1×12 h; and failure: urine output <0.5 mL·kg-1·h-1×24 h or anuria×12 h).14 When AKI occurred within 3 days after ICU admission, patients were classified as AKI group. Recovery of AKI was defined as a post-AKI serum creatinine level within 25% of the baseline (pre-hospitalization value) and independence from renal replacement therapy (RRT).
For each patient, age, gender, body mass index (BMI), comorbidity, infection strain, administration of vasoactive drugs, length of ICU stay, and 28-day mortality were recorded. In addition, Acute Physiology and Chronic Health Evaluation II (APACHE II) scores, Sequential Organ Failure Assessment (SOFA) scores, and laboratory data, including cystatin C and serum creatinine levels, were collected on days 0 (ICU admission), 1, 3, and 7. In this study, we defined “recovery” as recovery of AKI within 1 month after ICU admission; otherwise, the patients were classified in the “non-recovery” group.
Blood sampling and assays
Blood samples were obtained by an indwelling arterial catheter or venous puncture as soon as possible after the patient was admitted to the ICU. Follow-up blood samples from days 1, 3, and 7 were obtained at a fixed time (5 AM) for all eligible patients. The levels of creatinine and cystatin C were measured using commercial kits with an automated analyzer (Hitachi 7600-200-DDP, Hitachi Ltd., Tokyo, Japan).
Statistical analysis
Continuous variables were compared using the Student t-test or Mann-Whitney U test, depending on the distribution, and are presented as mean±standard deviation. Categorical variables were compared using Pearson's chi-squared test or Fisher's exact test and are presented as absolute frequency and percentages.15 The changes in serum levels of cystatin C over time between groups were compared using linear mixed model analysis after adjusting for age, sex, and BMI. For logistic regression analysis, univariate analysis was performed first, and p<0.05 was considered statistically significant.1617 Additionally, multivariate analysis was performed using the forward stepwise data selection method.1617 Cut-off values of 0.05 and 0.1 were applied to either enter or remove covariates into or from the final model. The effect of age, gender, and SOFA score was evaluated using Cox proportional-hazard models, in which adjusted p-values<0.05 were considered statistically significant. Hazard ratios and 95% confidence intervals (CIs) were calculated. All statistical analyses were carried out using SPSS version 20 (SPSS Inc., Chicago, IL, USA).
RESULTS
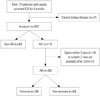
A total of 179 patients with sepsis were admitted to the ICU of a university-affiliated hospital in Korea. Among them, 17 patients who had a history of chronic kidney disease were excluded. Among the remaining 162 patients, AKI developed in 113 patients (43 of risk, 40 of injury, and 30 of failure). Thirty of these AKI patients were excluded because they died within 3 days after ICU admission (n=18) or the serum cystatin C measurement was not available after day 3 (n=12) (Fig. 1).
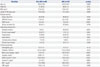
The baseline demographic and clinical characteristics at admission to the ICU (day 0) of the 162 included patients are shown in Table 1. Age and gender were similar between the non-AKI and AKI groups. The APACHE II scores and SOFA scores were significantly higher in the AKI group than in the non-AKI group (p=0.004 and p<0.001, respectively). Diabetes mellitus and hypertension were more frequent in the AKI group.
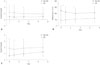
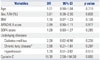
Levels of blood urea nitrogen, creatinine, and cystatin C were significantly higher in the AKI group (all p<0.001). The changes in serum creatinine, GFR, and cystatin C levels of the AKI and non-AKI groups over time are shown in Fig. 2. Similarly to the changes in levels of serum creatinine and GFR, serum cystatin C levels were significantly higher in patients with AKI, compared to non-AKI patients, on days 0, 1, 3, and 7. In the analysis adjusted for age, sex, APACHE II score, SOFA score, and underlying diseases, higher serum cystatin C levels on day 0 were significantly associated with development of AKI [odds ratio (OR)=19.30; 95% CI=2.58–144.50, p=0.006] (Table 2).
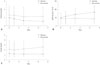
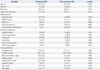
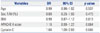
Characteristics of recovery and non-recovery groups at admission to ICU (day 0) for AKI patients (n=83) are shown in Table 3, which excludes patients who died within 3 days after ICU admission (n=18) or those for whom cystatin C was not measured after day 3 (n=12) from AKI patients (n=113) (Fig. 1, Table 3). Age, gender, BMI, SOFA score, and underlying diseases were not significantly different between the two groups, and blood levels of creatinine were not significantly different between the two groups. Among the kidney biomarkers tested, only the levels of cystatin C were higher in the non-recovery group than in the recovery group (p=0.003). The changes in serum creatinine, GFR, and cystatin C levels of the recovery and non-recovery groups over time are shown in Fig. 3. Serum cystatin C levels were significantly higher in patients in the non-recovery group, compared with the recovery group patients, on days 0, 1, 3, and 7. Linear mixed model analysis showed significant differences in the variation in cystatin C levels over time between the recovery and non-recovery groups (p=0.001). After adjusting for age, gender, BMI, and SOFA score, the levels of serum cystatin C at admission to the ICU (day 0) were found to be significantly associated with recovery of AKI (OR=1.64; p=0.048) (Table 4).
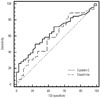
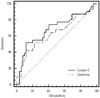
The value of cystatin C and creatinine levels measured on day 0 for predicting renal function was assessed with evaluation of receiver operating characteristic (ROC) curves, which are shown in Figs. 4 and 5, respectively. The ROC curve using cystatin C showed a higher area under the curve (AUC) value than that for creatinine; however, the difference between the cystatin C and creatinine AUC values was not statistically significant (0.650 vs. 0.601; p=0.294). Similarly, an ROC curve using cystatin to predict RRT showed a higher AUC value than that using creatinine, but again without statistical significance (0.681 vs. 0.635; p=0.331).
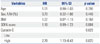
In addition, the effects of age, gender, BMI, SOFA score, and cystatin C levels on 28-day mortality were analyzed by Cox proportional hazard model (Table 5). For survival analysis, patients were divided into two groups according to cystatin C levels. The cut-off value was 1.30 mg/dL on day 0. Relative risk of mortality was significantly associated with cystatin C level (p=0.025). High cystatin C level group showed significantly worse prognosis than low cystatin C level group.
DISCUSSION
This study revealed an association between serum cystatin C levels and both AKI and renal function recovery. In multivariate analysis, increases in serum cystatin C levels at ICU admission were significantly associated with AKI, and higher levels of serum cystatin C in patients with sepsis at ICU admission were associated with recovery of AKI among the AKI patients. The performance of serum cystatin C for the diagnosis of AKI and prediction of renal function recovery was easy to assess and comparably better than that of creatinine.
Sepsis remains a serious problem in critically ill patients, and the mortality rate in patients with sepsis is increased dramatically when complicated by AKI. Therefore, accurate evaluation of AKI is essential in patients with sepsis. In clinical practice, AKI is typically diagnosed by measuring the serum creatinine level; however, creatinine has been shown to be a relatively insensitive and late indicator of AKI.18 In a mouse model, Doi, et al.19 showed that sepsis reduced the production of creatinine, which blunted the increase in serum creatinine after sepsis, potentially limiting the detection of AKI with this marker. Furthermore, Mårtensson, et al.20 found that the inflammatory response induced by sepsis had no impact on the plasma levels of cystatin C during the first week in the ICU, indicating that cystatin C might have benefits over creatinine as a marker of AKI. This situation highlights the need for new biomarkers that could provide better measures of renal injury, especially in patients with sepsis.
In healthy subjects, serum cystatin C is excreted through glomerular filtration and is metabolized completely by the proximal tubules. It has been shown to be less influenced by muscular mass than serum creatinine.21 Serum cystatin C has been validated as a superior GFR biomarker to detect chronic kidney disease in several specific populations with decreased or abnormal muscular mass, such as in elderly and cirrhotic patients.22
Moreover, several studies and a subsequent meta-analysis demonstrated the superiority of plasma cystatin C over serum creatinine for the detection of minor reductions and acute changes in GFR.2324 However, the superiority of serum cystatin C has for AKI diagnosis and prognosis has not been consistent.25 Several studies conducted in critically ill patients have suggested the better performance of serum cystatin C for detecting AKI.1126 However, reports comparing biomarker performance in sepsis-induced AKI are relatively scarce. Di Nardo, et al.27 showed that median serum cystatin C levels were significantly increased in children with severe sepsis with AKI, compared with patients without AKI, suggesting that cystatin C could be a more specific biomarker of AKI in children with severe sepsis. Similarly, in the present study, increases in serum cystatin C levels at ICU admission were significantly associated with AKI in an adjusted analysis for age, sex, SOFA score, and underlying diseases. However, there is a limitation in comparing the results between these two studies, because only adults were enrolled in our study. Dai, et al.28 found that the plasma cystatin C levels were significantly associated with AKI development in patients with sepsis, even after adjustment for confounders, thus supporting the results of our study.
Although serum cystatin C has long been recognized as a good biomarker of renal injury and performs better than the conventional biomarkers, such as creatinine and nitrogen urea, in reflecting renal function,2329 the association between serum cystatin C and prediction of renal function recovery in sepsis-induced AKI has not been well established. Perianayagam, et al.30 measured serum cystatin C in 200 patients with AKI, 83 of whom died or underwent RRT. They found that the serum cystatin C level performed just as well as the serum creatinine level, serum urea nitrogen level, and urine output in predicting dialysis requirement or in-hospital death. Since hospitalized adult patients who were not critically ill patients were also enrolled in the study, it is difficult to directly compare their results to those of the present study. Royakkers, et al.31 reported that serum cystatin C and urine cystatin C were poor biomarkers for the prediction of AKI and stated the need for RRT in a prospective multi-center cohort study of ICU patients. However, their study included heterogeneous AKI patients in the ICU (i.e., not only sepsis-induced AKI), and only 39.1% of the patients had septic shock, compared to 85.8% of the patients, in the present study. This difference in disease severity between the cohorts makes it difficult to directly compare the results between studies. In a cohort study of ICU patients, plasma cystatin C predicted sustained AKI and death or RRT and performed similarly to plasma creatinine as a biomarker.7 These results are similar to ours; however, only 18.2% of the patients in that cohort had sepsis. Furthermore, the results of these previous studies may be limited, owing to the relatively low event rates, such as death or RRT. In most previous studies evaluating the role of serum cystatin C in AKI patients, not only sepsis-induced AKI patients were enrolled, and the primary outcome was mainly the composite of dialysis therapy requirement or in-hospital death. In contrast, in our study, only sepsis-induced AKI patients were enrolled, and the primary outcome of interest was renal function recovery within 1 month.
Nevertheless, our study has some limitations. First, this prospective observational study was a single-center study with a relatively small sample size. However, serial follow up for biomarkers for kidney injury was carried out to potentially compensate for this weakness. Second, other new biomarkers, such as neutrophil gelatinase-associated lipocalin, were not analyzed. Third, although serum cystatin C level is less influenced by age, sex, and muscle mass, compared with serum creatinine level, it may still be affected by other unmeasured variables, such as levels of glucocorticoids,32 thyroid hormones,33 and insulin.34 However, glucocorticoids and insulin were used in all patients according to the same protocol, thereby minimizing these potential influences. Third, this study enrolled sepsis-AKI and sepsis-no-AKI patients, while not screening no-AKI and no-sepsis-AKI patients. Fourth, when AKI occurred within 3 days after ICU admission, patients were classified as AKI group. As a result, predictive value of cystatin C may have been limited.
In conclusion, this study showed that the serum cystatin C level can be associated with the development and worsening of AKI in ICU patients with sepsis. Larger and multi-center studies appear to be justified to confirm these results and to establish serum cystatin C as a useful biomarker for early diagnosis and prognosis of AKI.
 XML Download