Journal List > Yonsei Med J > v.58(3) > 1032153

Cho, Cudhea, Park, Mozaffarian, Singh, and Shin: Burdens of Cardiometabolic Diseases Attributable to Dietary and Metabolic Risks in Korean Adults 2012–2013

Abstract

Purpose

In line with epidemiological and sociocultural changes in Korea over the past decades, reliable estimation of diseases as a result of dietary and metabolic risks is required. In this study, we aimed to evaluate the contributions of dietary and metabolic factors to cardiometabolic diseases (CMDs) in Korean adults (25–64 years old) during 2012–2013.

Materials and Methods

Distribution of risk factors and cause-specific mortality by gender and age per year was obtained from the Korea National Health and Nutrition Examination Survey and Statistics Korea, respectively. The association between the two was obtained from published meta-analyses. The population-attributable fraction attributable to the risk factors was calculated across gender and age strata (male and female, age groups 25–34, 35–44, 45–54, and 55–64) in 2012 and 2013.

Results

The results showed that during the period studied, high body mass index [5628 deaths; uncertainty intervals (UIs): 5473–5781] and blood pressure (4202 deaths; UIs: 3992–4410) were major metabolic risks for CMD deaths, followed by dietary risks such as low intake of whole grain (4107 deaths; UIs: 3275–4870) and fruits (3886 deaths; UIs: 3227–4508), as well as high intake of sodium (2911 deaths, UIs: 2406–3425). Also, males and the younger population were seen more prone to be exposed to harmful dietary risk than their female and older counterparts.

Conclusion

The findings provide the necessary information to develop targeted government interventions to improve cardiometabolic health at the population level.

INTRODUCTION

Cardiometabolic disease (CMD), including cardiovascular disease (CVD) and diabetes mellitus (DM), is a leading cause of death globally that has killed approximately 38 million people. 1 In Korea, more than 45% of deaths were caused by noncommunicable diseases (NCDs).2 There is also a continuously increasing trend on the prevalence of cardiometabolic risks consisting of DM, hypertension and dyslipidemia, according to Korea National Health and Nutrition Examination Survey (KNHANES) 2012–2013.3 As such, cardiometabolic abnormalities are expected to contribute more to CVDs deaths by 2030. Considering that CMDs can be prevented or delayed,4 identifying the modifiable dietary and metabolic risk factors is important to reduce the risk of contracting the disease.
The Global Burden of Disease (GBD) study in 2010 and 2013 estimated the contribution of suboptimal diets and metabolic risk factors to chronic diseases in multiple regions,56 using the comparative risk assessment (CRA) method. The CRA is defined as the systematic evaluation of the changes in population health, with result from modifying the population distribution of exposures to a desirable level of one or a group of risk factors.7 For example, the GBD 2013 reported that the most prominent dietary risks were low intake of fruit and whole grains and high intake of sodium, implying that the importance of dietary risks had increased.6 While these risk factor specific assessments are useful for estimating disease burden in the Western region, the quantitative impact of risk factors on CMD deaths and burdens in Asian countries is still limited. On the other hand, there has been increased exposure to suboptimal lifestyles and metabolic risk in Korea over the past decade of fast economic growth, ageing population and spread of western diets.89 In line with these sudden epidemiological and sociocultural changes, a reliable estimation of the association between the disease and dietary and metabolic risks in Korea is required. This includes the necessity to characterize and estimate the effects of dietary risk factors on the mortality of the chronic disease in the Korean population. So far, studies have shown only the connection between health loss as a result of the disease, using disability-adjusted life years,81011 without investigating the contribution of relevant risk factors.
In this study, we aimed to evaluate the contributions of dietary and metabolic factors to CMDs, including cardiovascular conditions, stroke, and DM in Korean people aged 25 to 64 yrs during 2012–2013 using recent national representative data. Results may provide understanding of the correlation of CMDs to dietary risks among this population in Korea, which ultimately could help policymakers develop targeted interventions to improve public health.

MATERIALS AND METHODS

To estimate burden possible causes of stroke, CVD and DM in Korea, we conducted population-level CRA using 7 dietary factors (8 factors in 2013) and 4 metabolic factors. The detailed methods and standardised protocol described elsewhere in details.56

Selection of risk factors

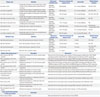
We selected 7 dietary factors (8 factors in 2013) and 4 metabolic factors which have convincing or probable evidence for a causal effect on coronary heart disease, stroke, other CVDs or DM based from well-conducted randomized clinical trials and longitudinal cohort studies. Table 1 shows selected dietary and metabolic risks. The dietary risk factors included low intake of fruits, vegetables, whole grains, nuts and omega 3 fatty acid (in 2013 only), and high intake of processed meats, unprocessed meats (red meats) and sodium. Metabolic risk factors included high levels of fasting plasma glucose (FPG), total cholesterol (TC), systolic blood pressure (SBP), and body mass index (BMI).

Data sources

We used the KNHANES data to obtain the distributions of each risk factor. Relative risk (RR) for causal relationship between risk factors and diseases was obtained from published systematic reviews and meta-analyses of epidemiological studies.1213 We used cause-specific death number from national mortality surveillance report collected by Statistics Korea (KOSIS). Theoretical minimum risk exposure distributions (TMREDs) were obtained from previous literature.612

Risk factor distribution

We used two latest KNHANES rounds (2012 and 2013) to measure population distribution of exposures (Table 1). The KNHANES is a nationwide cross-sectional survey conducted by a Ministry of Health and Welfare from 1998 to present. A nationally representative sample was chosen from the Korean population using stratified, multistage probability cluster sampling method that considers each participant's geographical area, age, and gender. The KNHANES was approved by the Institutional Review Board of the Korea Centres for Disease Control and Prevention. Detailed information on the KNHANES is available elsewhere.14 Among the participants of the KNHANES, we restricted analyses to those aged between 25 and 64 years as provided by the nutrition survey during the survey years. We also limited CRA analyses on the participants without missing data on nutrition survey and health examination. To exclude the effect of outliers, participants with upper or lower 3 standard deviation (SD) of mean value for risk factors were excluded. In terms of dietary risks, subjects who have rice less than once a day for a year using a given scale were excluded because it does not fit the common dietary pattern of Koreans. After exclusion, a total sample size was set at 2500 to obtain the distributions of risk factors.

Dietary risks

Intake levels of dietary factors were obtained from the KNHANES. The KNHANES includes 112 items of semi-quantitative food frequency questionnaire (FFQ) data in 2012 to reflect how often subjects consumed a particular food over the prior 12-month period using a 9-point scale (9=thrice a day, 8=twice a day, 7=once a day, 6=5–6 times per week, 5=2–4 times per week, 4=once per week, 3=2–3 times per month, 2=once a month, 1=less than once a month or never). Then, we calculated the amount of daily intake (g/day) for each food item by multiplying the serving size per time (g/time) with intake frequency per day (time/day). The serving size of each food item was obtained from Korea Rural Development Administration (KRDA).15 The amounts of total energy (kcal) and salt intake (mg) were obtained through a 1-day 24-hour recall method.16 The mean and SD of each dietary risk were estimated by gender, age, and year after adjustment for total energy intake using the residual method.17

Metabolic risks

Data on metabolic risks were also collected from KNHANES. Trained experts measured anthropometry such as weight, height, and blood pressure, following standardized protocols. BMI levels of each individual were calculated as weight (kg)/height squared (m2). SBP was measured by mercury sphygmomanometer (Baumanometer, Copiague, NY, USA) on the right arm on a sitting position. Blood samples were collected through an antecubital vein after fasting for 10 to 12 hours. Serum levels of FPG (mmol/L), and TC (mmol/L) were measured using a Hitachi Automatic Analyzer 7600 (Hitachi, Tokyo, Japan).

Causal effects of risk factors on disease-specific mortality

Each risk factor was matched with the disease based on convincing or probable evidences for a causal effect (Table 1). We obtained data on RR of mortality (or incidence) on CVDs, stroke, and DM per unit of risk factors from most recent published systematic reviews and meta-analyses of epidemiological studies and randomized controlled trials.13

Theoretical minimum-risk distributions

To measure the mortality risk in all population levels of exposure based on dietary and metabolic factors, we used an optimal distribution of exposure as a standard, known as theoretical minimum-risk exposure distribution (Table 1). TMRED is an alternative exposure distribution, based on which has the lowest effect on mortality rate in epidemiological studies or the levels observed in low-exposed populations. The optimal levels for risk factors with protective effects were defined as the intake levels to which beneficial effects are observed in populations that posed the highest level of benefit (e.g., high intake of fruits, vegetables, whole grains, nuts, whole grains, and omega 2 fatty acid). For risk factors with harmful effects (e.g., high intake of processed or unprocessed meats, sodium, and high levels of FPG, SBP, BMI, and TC), standard level was selected based on exposure levels associated with the lowest level of harm. The TMREDs were set to zero when zero exposure of risk factors led to minimum risk (e.g., processed meats).

Disease-specific deaths

Data on disease-specific deaths by gender and age during covered years was obtained from the KOSIS, which provides national surveillance statistics in Korea. All deaths were recorded and assigned a code from the International Classification of Disease. We used mortality data attributable to CMDs as follows: DM (E10-14), ischemic heart disease (IHD; I20-25), ischemic stroke (ISTK; I63, I67), haemorrhage stroke (HSTK; I60-62), aortic aneurysm and dissection (I71), hypertensive heart disease (I11), and rheumatic heart disease (I00-09). The obtained mortality number was summed according to age and gender group between 2012 and 2013.

Statistical analyses

Estimation of death attributable to dietary intake

We computed the proportional reduction in cause-specific deaths that would result from an optimal level of risk factor exposure known as population attributable fraction (PAF). The PAF for each continuous risk factor was calculated using following equation:
PAF=x=0mRRxPxdxx=0mRR(x)P(x)dxx=0mRR(x)P(x)dxymj-58-540-e001
Where x=the level of exposure; m=the maximum exposure level; P(x)=current distribution of exposure in the population; P'(x)=alternative levels of exposure distribution; RR(x)=the RR of mortality at exposure level x. We calculated the number of deaths from each disease attributable to causally related risk factors by multiplying its PAF with total cause-specific mortality. We conducted all analyses separately by gender and age group (25–34, 35–44, 45–54, and 55–64 yrs) in 2012 and 2013.

Estimation of uncertainty

We calculated the uncertainty of the attributable mortality to each risk factor as caused by sampling variability. The Monte Carlo simulation was used to quantify the uncertainty from exposure data and RRs. This simulation approach combined the uncertainties of exposure distributions and RRs in each agegender group. We drew 1000 times from the exposure distribution for each age-gender group using its mean and standard error, assuming that each distribution to be normal. We separately generated 1000 draws of the log-normal distribution of RR for each risk factor on disease outcomes. These were used to generate 1000 mortality estimates for each age-gender group. We reported 95% of uncertainty intervals (UIs) based on resulting distributions of 1000 estimated attributable deaths. Analysis was conducted using Stata (StataCorp LLC, College Station, TX, USA) and R v.3.2.2 (http://www.R-project.org).

RESULTS

Distribution of dietary and metabolic risks in Korea 2012–2013

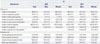
Beneficial dietary risk factors, namely the consumption of fruits, vegetables and nuts, slightly decreased in Korean adults aged 25–64 yrs in 2013 than in 2012 (Table 2). On the other hand, the intake of harmful dietary factors such as processed and unprocessed meats increased, while that of sodium decreased during the same period (Table 2). Overall, women consumed more beneficial food and less of harmful food than men. In 2013, men had lower amount of omega 3 fatty acid than women. The intake of fruits, vegetables and nuts was relatively higher in older group whereas that of meats was lower in those groups when compared with the 25–34 years old group (data not shown). The distribution of metabolic risk factors showed no significant changes between 2012 and 2013. There were also no remarkable differences in metabolic risk factors between men and women, while women had lower blood pressure than men.

Deaths from stroke, CVD, and DM in Korea

The number of deaths due to stroke, CVD and DM is presented in Supplementary Table 1 (only online). Total number of CMD deaths slightly decreased in 2013 compared to that in 2012 (8381 to 7954). During the two-year period, CMD resulted into 12258 deaths among men (38% of CMD deaths due to IHD, 26% HSTK, 25% DM, 8% ISTK, and 3% other CVDs) and 4106 deaths among women (43% of CMD death due to HSTK, 25% DM, 20% IHD, 9% ISTK, and 4% other CVDs). There was lower CMD mortality in women than men. Men aged more than 35 years old had twice higher mortality from CMDs than women in the same age group.

Stroke, CVD, and DM mortality attributable to metabolic risk by age and gender

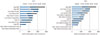
Fig. 1 shows that high BMI was the leading cause of CMD death (5628 deaths; UIs: 5473–5781), followed by high blood pressure (4202 deaths; UIs: 3992–4410) in 2012 and 2013. High levels of TC and FPG were responsible for more than a thousand deaths from CMDs in each year. Metabolic risks were responsible for higher mortality from CMDs among men than women. The younger population were affected more by risk of high BMI and TC levels, while their older counterparts were seen more affected by risk of high SBP and FPG levels.

Stroke, CVD, and DM mortality attributable to dietary risk by age and gender

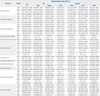
Low intakes of fruits and whole grains were the leading cause of CMD death in 2012 and 2013. A total of 4107 deaths (UIs: 3275–4870) and 3886 deaths (UIs: 3227–4508) were attributed to low intake of fruits and whole grains intake, respectively. They were followed by risk of low intake of vegetables and nuts (Table 3 and 4). Among harmful dietary factors, high consumption of sodium was responsible for the highest number of CMD deaths during the same two-year period. In 2013, low intakes of omega 3 fatty acids accounted for approx. 1200 deaths due to IHD (Table 4). Meanwhile, high consumption of meat showed minimal effect on CMD mortality in Koreans. Men showed higher mortality from dietary risk than women. The PAFs for each dietary risk were higher among the younger population (data not shown).

DISCUSSION

In this study, we comprehensively evaluated the contribution of dietary and metabolic risks to CMDs in the Korean population aged 25 to 64 yrs using the CRA framework. Using 2012 and 2013 data, results showed that high BMI was found to be the leading contributor to CMD mortality among Koreans. In addition, among individual dietary factors, low intake of fruits and whole grains along with high intake of sodium were responsible for most Korean CMD deaths.
In line with previous findings,56 results in the present study showed that high BMI, followed by high SBP, also resulted into most number of CMD deaths in Korea. The risk of high BMI-related metabolic abnormalities has been increasing globally.18 In this study, nearly 45% of DM deaths and 20% of IHD deaths were attributable to obesity. This could be partly explained by nutritional transition Korea underwent through the years that saw the adoption of more Western diet characterized by high sugars and mainly animal-based, accompanied by a decline on physical activity, an increase of energy intake, and consequently, a rise of body weight.8919 Alternatively, this could be partly attributed to the sample population used in the study which restricted its evaluation to persons younger than 65 years old due to limited data availability. It should be noted that there is a high prevalence of hypertension among the elderly. In contrast, only a small number of CMD deaths were attributed to high levels of FPG and TC. Results suggest the need for adoption and implementation of effective interventions to reduce cases of metabolic risk factors.
Diet quality has a major impact on the prevention and management of NCDs.20 According to GBD 2010, dietary risk factors and physical inactivity collectively caused 10% of the disease deaths.5 Of the individual dietary factors, the largest attributable burden in GBD 2010 was associated with diets low in fruits, vegetables, nuts, seeds and seafood-derived omega-3 fatty acids and those high in sodium, processed meats and trans-fat.5 These dietary risks have been generally known as convincing and probable factors for NCDs such as cancers, CVD and DM in various well-designed randomised trials and observational studies.21 Moreover, Danaei, et al.4 suggested that high dietary sodium, low dietary omega-3 fatty acids, and high trans-fat contribute to majority of deaths in the US. Similar to previous GBD studies,56 suboptimal consumption of fruits and whole grains and high intake of sodium accounted for large proportion of CMD deaths among Koreans. Increased intake of fruits has been reported to be associated with reduced risk of CVD in many epidemiological studies.2223 Globally, intake of low fruit and vegetables is responsible for 2.6 million deaths or 31% of CVDs event/deaths.2425 Previous observational studies showed that an increase of 150 g of fruit and vegetable consumption per day was associated with a 30% reduction in CHD risk.26 Kim, et al.27 reported that dietary fruits and fresh vegetables were significantly associated with inverse trend of blood pressure in the Korean population. Also, dietary whole grains have been reported to be inversely associated with CVD and risk factors through well-established meta-analysis;28 higher intake of whole grains could lower the risk of cardiovascular events by 29%. An intervention study in Korea showed that replacing refined rice with whole grain in a meal was associated with reduced risk of coronary artery disease and DM.29 In the present study, we found that average consumption of fruit and whole grain was much lower than TMRED, which requires active intervention at national level, whereas the contribution of high intake of sodium to CMDs was seen reduced, but still high in 2012 and 2013. Koreans are known as one of the highest sodium consumers in the world, consequently having the highest mortality from cancer and CVD associated with salt consumption. 3031 Along with global call for salt reduction, there have also been nutritional policies put in place in Korea to reduce sodium, including one as part of the “National Nutrition Care/Management in Korea,” program since 2005.32 Therefore, average sodium intake decreased from 4516.9 mg in 1998 to 4027.5 mg in 2013, according to Korea Health Statistics.3 This, in effect, lowered also CVD deaths as a result of reduced salt consumption, implying the importance of intervention on dietary risks management.
Of special interest is the observation that the CMD mortality attributable to processed and unprocessed meat was remarkably lower than other countries.33 Recent evidence from the systematic review and meta-analysis suggests that increasing consumption of red meat, especially processed, may have adverse health effects.3435 These negative effects do not come only from highly contained saturate fatty acid (SFA) and cholesterol, but also from the processing itself to change the taste or extend the food's shelf life through curing, smoking, salting or adding preservatives. Our results were in line with expectations of an inverse association of meat with cardiovascular mortality in East Asian population, but one which requires further confirmation. Even though there is an increase in meat consumption, Koreans are still at the moderate level when compared with global average (unprocessed red meat: 41.8 g/day and processed meat: 13.7 g/day).36 Results suggest that reasonable and moderate unprocessed red meat intake, despite its SFA and cholesterol content, is an important animal protein source and contributes to essential micronutrient requirements.37 Interestingly, previous studies on the Korean population indicated that meat and vegetable-rich dietary pattern in adults are associated with lower incidence of metabolic syndrome.38 The differences in dietary pattern can lead to different effect of meat among Koreans and also emphasizing it's importance at the national level as far as CMD mortality is concerned. Further observational and intervention studies on different roles of meat in this population are required.
On the other hand, this study also showed specific effects of dietary and metabolic risks depending on age and gender. Among Koreans, male and younger population were more likely to have harmful dietary lifestyles than female and older population. Deaths from CMD in middle-aged people were seen most affected by high levels of blood pressure, while those among the young were noticed to be predominantly affected by obesity. These results draw attention to the importance of age- and gender-specific nutrition intervention and health management to prevent CMD mortality.
The present analysis has several strengths. Our present study is the most detailed analysis of the burden of CMD cases in Koreans, with focus on nation-specific dietary and metabolic risk factors that could lead to CMD deaths. We used nationally representative data for risk factors, and cause-specific mortality. Furthermore, we used most recent RR for risk factor-CMD relationships. We also examined uncertainty in the current distribution of risk factors, effect of risk factors on CMDs, and cause-specific mortality by age and gender. However, potential limitations should also be considered. First, distribution of risk factors was estimated from a restricted sample population aged 24 to 64 yrs, because of unavailability of nutrition survey data, in spite of the fact that the elderly aged >65 yrs are more likely to have higher mortality than their younger counterparts. Thus, overall effect of risk factors is biased towards this younger population, possibly lowering the impact on our estimated burdens of deaths. Second, even though KNHANES provides data on semi-quantitative amount of dietary intake from 2012, it estimated food consumption within categories rather than the exact amount. Aggregation based on food items using semi-quantitative data was not possible since food items in semi-quantitative FFQ were investigated with different units between items. Therefore, we imputed intake amount data using portion size with unified unit (g/day) using KRDA guideline. Therefore, there is a possibility of over- or under estimation of intake amounts, comparing to actual intake amount of each dietary factors. Third, whereas effects of risk factors on CMDs have been confirmed by previous studies, there is a possibility of residual confounding. Nevertheless, the current RR represented the best available evidence for the effects of risk factors on CMDs. Fourth, we used RR and TMRED from mixed population such as Western and Asian population. There is, therefore, a possibility that estimates of attributable burden could not be clearly assessed. However, previous studies indicated that RR and TMRED might vary but there was insufficient evidence to identify significant differences in those between populations.39 Furthermore, the use of RRs pooled from international meta-analysis studies strengthened the generality of current study and contributed to generating estimates for disease burdens in Korea comparable to those from other countries.
In conclusion, using a CRA model, we confirmed that both metabolic and dietary risk factors contributed to CMD mortality in Korean adults aged 24–64 yrs during 2012–2013. Along with continuous socio-economic and health changes in Korea, the present findings highlight the need for a national effort and intervention to reduce dietary and metabolic risks through evidence-based surveillance system. Our results can serve as bases to develop targeted intervention programs or guidelines to improve public health, not just by reducing consumption of harmful food, but also by encouraging people to eat healthy foods and observe good lifestyles to help prevent CMD deaths.

Figures and Tables

Fig. 1

Deaths attributable to total effects of individual risk factors, by disease and years. Data are shown for gender and age groups (25–64 yrs) combined. See Tables 3 and 4 for actual number of deaths and 95% UIs. The number of death attributable to individual risks cannot be added. HSTK, haemorrhagic stroke; ISTK, ischemic stroke; TSTK, total strokes; IHD, ischemic heart disease; DM, diabetes mellitus; WG, whole grains; FA, fatty acid; SBP, systolic blood pressure; BMI, body mass index; TC, total cholesterol; FPG, fasting plasma glucose; UIs, uncertainty intervals.

ymj-58-540-g001
Table 1

Data Source of Risk Factors, Optimal Levels and Related Disease Outcomes

ymj-58-540-i001
Dietary risks Definition Data source (available year) Theoretical minimum risk exposure level Unit for RRs Related disease outcomes
Low intake of fruits Average daily consumption of fruits (fresh, frozen, cooked, canned, or dried, excluding salted or pickled fruits and fruit juice) KNHANES (2012–2013) 300±30 g/day Per 1 serving (100g)/day IHD, ISTK, HSTK
Low intake of vegetables* Average daily consumption of vegetables (fresh, cooked, canned, or dried, excluding pickled or salted vegetables) KNHANES (2012–2013) 400±40 g/day Per 1 serving (100g)/day IHD, ISTK, HSTK
Low intake of whole grains Average daily consumption of whole grains such as barley, and cereal KNHANES (2012–2013) 125±12.5 g/day Per 1 serving (50 g)/day IHD, ISTK, HSTK, DM
High intake of processed meats Average daily consumption of meats processed by smoking, curing, salting or addition of chemical preservatives (ham and sausage) KNHANES (2012–2013) 0±0 g/day Per 1 serving (50g)/day IHD, DM
High intake of unprocessed meat Average daily consumption of red meats (beef and pork, excluding poultry, fish and eggs) KNHANES (2012–2013) 14.3±1.43 g/day Per 1 serving (100g)/day DM
High intake of sodium Average daily intake of sodium from all sources KNHANES (2012–2013) 2000±200 mg/day Per 100 mmol/d (2.3 g)/day Blood pressure mediated effect (CVD)
Low intake of nuts Average daily consumption of peanuts KNHANES (2012–2013) 16.2±1.62 g/day Per 1 servings (4.05 g)/day IHD, DM
Low intake of seafood ω-3 fats Average daily intake of ω-3 fats such as eicosapentaenoic acid and docosahexaenoic acid KNHANES (2013) 250±25 mg/day Per 1 servings (100 mg)/day IHD
Metabolic risks Definition Data source (available year) Theoretical minimum risk exposure level Unit for RRs Related disease outcomes
High fasting plasma glucose Serum fasting plasma glucose, measured in mmol/L KNHANES (2012–2013) 4.9±0.3 mmol/L 1 mmol/L IHD, stroke
High total cholesterol Serum total cholesterol, measured in mmol/L KNHANES (2012–2013) 3.8±0.6 mmol/L 1 mmol/L IHD, ISTK
High systolic blood pressure Systolic blood pressure, measured in mm Hg KNHANES (2012–2013) 115±6 mm Hg 10 mm Hg IHD, HSTK, ISTK, other CVD
High body mass index Body-mass index, measured in kg/m2 KNHANES (2012–2013) 21±1 kg/m2 5 kg/m2 IHD, ISTK, DM, other CVD
Relative risks by age and sex12,13 § Description Data source
Effect of fruits on IHD, ISTK, and HSTK Published meta-analyses of 9, 10, and 7 cohorts studies, respectively Data were from US and European cohorts including 241190 participants and 5603 cases of IHD, 329204 participants and 5517 cases of ISTK, and 175035 participants and 1535 case of HSTK, respectively
Effect of vegetables on IHD, ISTK, and HSTK Published meta-analyses of 9, 9, and 7 cohorts studies, respectively Data were from US and European cohorts including 229937 participants and 6288 cases of IHD, 309135 participants and 5376 cases of ISTK, and 175035 participants and 1535 case of HSTK, respectively
Effect of whole grains on CVD, IHD, and DM Published meta-analyses of 7, 6, and 10 cohorts studies, respectively Data were from US, European, and Asian cohorts including 285217 participants and 7005 cases of CVD, 284682 participants and 4837 cases of IHD, and 385686 participants and 19829 case of DM, respectively
Effect of processed meats on IHD and DM Published meta-analyses of 6 and 9 cohorts studies, respectively Data were from US, European, and Asian cohorts including 614062 participants and 21308 cases of IHD, and 372391 participants and 26234 cases of DM, respectively
Effect of unprocessed meats on DM Published meta-analyses of 10 cohorts studies Data were from US, European, and Asian cohorts including 447333 participants and 28206 cases of DM
Effect of sodium on CVD Published meta-analyses of 11 cohorts studies Data were from US, European, and Asian cohorts including 299785 participants and 9346 cases of CVD
Linear effects of sodium on blood pressure Published original analyses of 103 randomised clinical trial studies Data were from US, European, and Asian randomised clinical trial including 6970 participants
Effect of nuts on IHD Published meta-analyses of 1 randomised clinical trial study and 5 cohorts studies Data were from US, and European cohorts including 193717 participants and 6043 cases of CHD
Effect of nuts on DM Published meta-analyses of 1 randomised clinical trial study and 5 cohorts studies Data were from US, and European cohorts including 230216 participants and 13308 cases of DM
Effect of omega 3 fats on CHD Published meta-analyses of 5 randomised clinical trial and 17 cohorts studies Data were from US, and European cohorts including 402647 individuals and 5822 cases of CHD
Effect of metabolic risk on CVD and DM Published meta-analyses of 123 cohorts studies Data were from US, European, and Asian cohorts including 1.42 million participants
Cause-specific total mortality by year, age, and sex Description
Data on causes of death Vital-registration systems Data were obtained from the national statistics in Korea (KOSIS)

KNHANES, Korea National Health and Nutrition Examination Survey; IHD, ischemic heart disease; ISTK, ischemic stroke; HSTK, haemorrhagic stroke; DM, diabetes mellitus; CVD, cardiovascular disease; TMREDs, theoretical minimum risk exposure distributions; CHD, coronary heart disease.

*Vegetables excluded salted or pickled vegetable, as well as Korean cabbage since most of them are preserved form, The theoretical minimum risk exposure level for each risk factor was obtained from epidemiological studies or the levels observed in low-exposure populations, Intake data was only available in 2013, §Relative risks for diet-disease relationships were obtained from ongoing meta-analyses of published literature, TMREDs for each risk factor were obtained from published literature.

Table 2

Distribution of Risk Factors in Korea 2012–2013

ymj-58-540-i002
Risk factors Yr*
2012 2013
Total Men Women Total Men Women
Dietary risk
 Intake of fruits (g/day) 90.6±2.1 76.4±2.5 105.3±3.2 88.0±2.0 75.4±2.4 103.2±3.3
 Intake of vegetables (g/day) 97.0±1.8 91.6±2.3 102.6±2.8 94.0±1.7 89.0±2.2 99.9±2.7
 Intake of whole grains (g/day) 7.4±0.2 7.8±0.3 7.1±0.3 7.7±0.2 7.6±0.2 7.7±0.3
 Intake of processed meats (g/day) 0.52±0.03 0.52±0.04 0.52±0.05 0.75±0.04 0.84±0.05 0.64±0.04
 Intake of unprocessed meats (g/day) 32.9±0.7 35.4±1.0 30.2±1.0 37.2±0.7 39.4±1.0 34.5±1.0
 Intake of sodium (mg/day) 4893.0±52.5 4914.5±67.4 4870.9±80.8 4075.9±39.7 4161.3±50.6 3978.0±62.3
 Intake of nuts (g/day) 0.44±0.03 0.54±0.04 0.34±0.03 0.37±0.02 0.44±0.03 0.28±0.03
 Intake of seafood ω-3 fats (mg/day)§ - - - 5.48±0.07 5.46±0.09 5.51±0.10
Metabolic risk
 Fasting plasma glucose (mmol/L) 5.32±0.01 5.48±0.02 5.22±0.02 5.37±0.01 5.51±0.02 5.26±0.02
 Total cholesterol (mmol/L) 4.89±0.01 4.88±0.02 4.90±0.02 4.86±0.01 4.85±0.02 4.87±0.02
 Systolic blood pressure (mm Hg) 116.4±0.2 119.7±0.3 114.0±0.3 115.1±0.2 118.6±0.3 112.4±0.3
 Body mass index (kg/m2) 23.7±0.1 24.3±0.1 23.3±0.1 23.7±0.1 24.5±0.1 23.2±0.1

KNHANES, Korea National Health and Nutrition Examination Survey.

*Values were expressed as mean±standard error, Fruit juice was excluded from fruit intake, Vegetables excluded salted or pickled vegetable, as well as Korean cabbage since most of them are preserved form, §Fat intake was investigated only in KNHANES 2013.

Table 3

Number of Cause Specific Deaths Attributable to Risk Factors in Korea 2012

ymj-58-540-i003
Risk factor Disease Attributable death number (95% UI)*
Total Sex Age (yrs)
Men Women 25–34 35–44 45–54 55–54
Low intake of fruits HSTK 1336.8 (1107.1–1548.6) 889.4 (669.3–1071.0) 447.4 (322.2–543.3) 65.3 (45.4–79.6) 264.0 (176.8–328.2) 540.2 (345.4–670.7) 466.3 (303.2–589.8)
ISTK 175.5 (136.8–212.5) 129.5 (95.0–165.4) 46.0 (33.4–57.6) 5.2 (3.7–6.6) 14.9 (10.7–18.8) 51.0 (35.7–66.3) 104.2 (69.3–136.9)
TSTK 1512.3 (1267.6–1733.1) 1018.8 (800.0–1201.0) 493.4 (367.3–591.9) 70.5 (50.7–84.6) 278.9 (191.3–342.1) 591.2 (395.8–725.6) 570.5 (396.0–704.7)
IHD 566.7 (420.5–710.0) 490.7 (339.9–626.7) 76.0 (50.8–99.9) 12.8 (7.2–18.0) 78.4 (42.2–110.1) 202.3 (108.9–289.9) 272.9 (158.3–387.7)
Low intake of vegetables HSTK 856.8 (604.4–1064.7) 565.5 (339.4–748.5) 291.2 (177.9–395.9) 46.1 (24.9–63.1) 180.7 (80.6–255.0) 349.7 (164.7–501.3) 279.4 (140.1–405.8)
ISTK 151.7 (98.1–203.0) 110.7 (59.8–155.4) 41.0 (21.1–57.8) 4.9 (2.3–7.0) 13.9 (6.1–20.1) 44.9 (19.8–66.6) 88.0 (41.7–133.1)
TSTK 1008.5 (756.2–1225.8) 676.2 (447.9–866.9) 332.2 (219.5–436.3) 51.0 (29.2–68.2) 194.6 (93.9–269.0) 394.6 (214.7–547.0) 367.5 (222.4–491.8)
IHD 419.1 (331.7–507.0) 360.4 (276.6–445.9) 58.7 (43.9–72.3) 10.5 (6.8–13.9) 62.4 (39.3–83.8) 152.8 (100.0–204.5) 193.3 (127.5–258.9)
Low intake of whole grains HSTK 601.0 (534.1–665.3) 390.1 (332.1–447.6) 210.9 (178.5–242.0) 31.1 (25.1–36.8) 124.6 (98.9–149.8) 244.4 (193.9–290.5) 200.4 (158.2–236.9)
ISTK 154.2 (131.4–175.4) 110.9 (89.9–130.7) 43.3 (35.6–50.6) 4.8 (3.9–5.6) 13.5 (10.6–16.0) 45.3 (35.5–54.7) 90.6 (69.6–108.6)
TSTK 755.2 (690.8–822.8) 501.0 (438.2–560.6) 254.2 (220.9–286.8) 35.9 (29.8–41.6) 138.1 (112.4–163.1) 289.7 (236.6–337.3) 291.0 (243.4–334.5)
IHD 644.0 (521.6–753.1) 550.4 (429.3–657.3) 93.6 (71.3–113.3) 14.4 (9.8–18.6) 90.2 (61.7–115.1) 232.5 (159.4–295.9) 306.5 (210.4–390.8)
DM 601.3 (477.9–725.0) 450.5 (333.6–565.7) 150.8 (111.2–186.4) 10.8 (8.0–13.6) 61.9 (43.3–77.4) 200.2 (139.0–262.7) 328.2 (223.3–429.3)
High intake of processed meats IHD 5.5 (3.4–7.9) 4.9 (2.8–7.3) 0.6 (0.3–0.9) 0.7 (0.2–1.3) 1.6 (0.5–3.0) 2.0 (0.4–3.7) 1.1 (0.3–2.1)
DM 4.3 (3.3–5.3) 3.2 (2.3–4.3) 1.1 (0.8–1.4) 0.5 (0.3–0.7) 1.1 (0.7–1.5) 1.6 (0.9–2.4) 1.1 (0.6–1.7)
High intake of unprocessed meats DM 74.9 (44.8–108.8) 61.9 (31.9–95.7) 13.0 (7.4–18.5) 2.0 (0.9–3.1) 11.5 (4.8–18.6) 26.4 (8.4–44.6) 35.0 (12.4–62.1)
High intake of sodium HSTK 705.7 (534.7–894.2) 481.0 (328.5–639.6) 224.7 (147.0–307.9) 19.4 (11.0–28.6) 47.0 (0.0–104.9) 421.2 (272.6–571.4) 217.7 (142.1–296.1)
ISTK 178.3 (146.8–209.0) 133.6 (103.0–163.6) 44.7 (33.8–56.3) 2.8 (1.7–3.9) 4.7 (0.0–9.7) 75.0 (59.0–89.3) 95.7 (66.7–125.3)
TSTK 884.0 (712.2–1074.8) 614.6 (468.6–778.1) 269.3 (190.7–350.9) 22.2 (14.0–31.5) 51.7 (5.1–110.2) 496.1 (353.3–643.9) 313.4 (231.7–396.7)
IHD 590.3 (429.0–758.3) 511.7 (355.8–675.1) 78.6 (54.0–107.3) 10.3 (4.3–17.6) 31.6 (0.0–71.2) 296.2 (175.4–424.4) 252.0 (154.2–359.5)
AA 25.5 (20.5–30.8) 20.6 (15.6–25.7) 4.9 (3.5–6.4) 1.3 (0.8–1.9) 2.3 (0.0–4.8) 11.6 (8.3–15.0) 10.3 (7.0–13.7)
HHD 26.8 (22.1–31.1) 21.0 (16.4–25.2) 5.8 (4.5–7.0) 0.8 (0.5–1.1) 0.6 (0.0–1.2) 12.6 (10.0–14.8) 12.7 (8.7–16.4)
RHD 5.0 (3.7–6.3) 2.1 (1.4–2.9) 2.8 (1.8–3.9) 0.3 (0.1–0.5) 0.0 (0.0–0.0) 2.3 (1.5–3.3) 2.3 (1.4–3.3)
Low intake of nuts IHD 876.3 (719.7–1018.9) 748.3 (593.8–884.9) 128.0 (100.3–153.1) 19.5 (14.0–24.1) 119.9 (85.8–148.2) 312.0 (227.4–392.8) 424.7 (297.7–536.0)
DM 261.8 (199.2–327.3) 196.7 (136.5–256.1) 65.1 (45.4–83.5) 4.8 (3.2–6.4) 27.6 (17.0–36.6) 86.0 (55.2–117.6) 143.2 (93.0–194.9)
High fasting plasma glucose TSTK 304.8 (290.4–318.3) 231.0 (216.9–244.0) 73.8 (69.4–78.1) 2.5 (2.0–3.1) 27.2 (24.5–30.0) 114.3 (105.7–123.1) 160.7 (149.5–171.3)
IHD 371.2 (351.3–390.9) 331.8 (312.2–351.9) 39.4 (36.7–4.02) 1.4 (1.1–1.8) 21.3 (18.9–23.7) 119.5 (109.7–128.9) 228.9 (211.6–246.2)
High total cholesterol ISTK 172.3 (167.3–177.1) 119.8 (115.1–124.4) 52.5 (51.1–53.9) 6.2 (5.9–6.6) 20.6 (19.9–21.4) 64.9 (61.9–67.5) 80.4 (76.4–84.4)
IHD 1208.5 (1174.7–1243.0) 1020.5 (987.8–1053.9) 188.0 (183.1–192.8) 25.6 (24.1–27.2) 187.2 (180.3–193.3) 505.1 (484.4–524.9) 490.2 (463.5–514.7)
High systolic blood pressure HSTK 952.2 (913.4–989.6) 657.6 (622.2–691.4) 294.6 (278.6–310.4) 13.6 (10.6–16.8) 85.8 (73.7–99.0) 396.3 (368.5–422.8) 455.8 (432.9–480.0)
ISTK 279.5 (266.5–292.2) 207.4 (194.7–218.8) 72.0 (68.0–75.9) 2.0 (1.6–2.5) 8.7 (7.4–10.0) 72.0 (66.4–77.3) 196.6 (184.2–207.6)
High systolic blood pressure TSTK 1231.6 (1191.3–1270.5) 865.0 (827.5–900.1) 366.6 (350.2–383.8) 15.7 (12.5–18.9) 94.6 (82.7–107.8) 468.3 (439.2–495.8) 652.4 (627.4–679.5)
IHD 875.3 (825.4–923.4) 750.1 (699.7–797.7) 125.1 (117.5–133.1) 6.9 (5.3–8.5) 51.8 (43.7–60.7) 294.8 (267.2–322.2) 521.5 (481.7–559.1)
HHD 39.2 (37.8–40.5) 31.4 (30.1–32.6) 7.8 (7.5–8.1) 0.6 (0.5–0.8) 1.3 (1.2–1.5) 12.6 (11.9–13.3) 24.6 (23.4–25.6)
RHD 7.3 (6.9–7.8) 2.8 (2.6–3.0) 4.5 (4.2–4.9) 0.2 (0.1–0.2) 0.0 (0.0–0.0) 1.8 (1.7–2.0) 5.3 (4.9–5.7)
AA 37.4 (35.5–39.2) 29.0 (27.2–30.6) 8.4 (7.9–9.0) 0.9 (0.7–1.1) 3.7 (3.1–4.4) 11.1 (10.0–12.2) 21.7 (20.2–23.1)
High body mass index HSTK 963.6 (940.8–986.4) 649.9 (629.1–669.8) 313.7 (303.2–324.2) 50.5 (47.9–52.7) 208.3 (200.2–216.5) 396.4 (379.6–413.4) 307.9 (295.3–320.3)
ISTK 179.9 (174.4–184.9) 132.0 (126.6–136.9) 47.9 (46.0–49.8) 5.4 (5.1–5.8) 16.0 (15.3–16.8) 54.2 (51.5–56.8) 104.1 (99.2–108.6)
TSTK 1143.5 (1119–1168.1) 781.9 (760.8–802.4) 361.6 (350.6–372.5) 55.9 (53.4–58.3) 224.3 (216.4–232.6) 450.6 (433.7–467.5) 411.9 (398.1–425.8)
IHD 684.7 (661.5–708.1) 590.2 (566.5–612.0) 94.5 (90.8–98.6) 16.7 (15.5–17.9) 95.3 (89.7–100.6) 248.8 (234.0–263.0) 323.7 (307.4–340.2)
DM 1026.7 (998.5–1052.5) 778.6 (751.5–805.2) 248.1 (240.6–255.4) 14.9 (14.2–15.7) 98.6 (95.2–102.0) 337.1 (323.7–350.8) 575.6 (551.3–598.9)
HHD 25.4 (24.6–26.1) 19.6 (18.8–20.3) 5.8 (5.6–6.0) 1.0 (0.9–1.0) 2.3 (2.2–2.4) 8.5 (8.2–8.9) 13.5 (12.8–14.1)

HSTK, haemorrhagic stroke; ISTK, ischemic stroke; TSTK, total strokes; IHD, ischemic heart disease; DM, diabetes mellitus; AA, aortic aneurysm and dissection; HHD, hypertensive heart disease; RHD, rheumatic heart diseases; UI, uncertainty interval.

*The values were expressed as death number for each risk factors (95% UIs).

Table 4

Number of Cause Specific Deaths Attributable to Risk Factors in Korea 2013

ymj-58-540-i004
Risk factor Disease Attributable death number (95% UI)*
Total Sex Age (yrs)
Men Women 25–34 35–44 45–54 55–54
Low intake of fruits HSTK 1313.3 (1076.3–1507.6) 865.3 (647.7–1025.4) 448.0 (324.5–546.2) 53.2 (36.5–65.3) 238.1 (167.6–290.6) 558.5 (360.6–709.9) 462.5 (291.7–584.4)
ISTK 160.8 (121.5–194.5) 117.3 (81.6–150.2) 43.5 (31.7–55.5) 3.5 (2.5–4.5) 11.6 (8.2–14.4) 45.2 (31.4–58.8) 100.4 (65.3–129.3)
TSTK 1474.1 (1228.4–1670.8) 982.6 (764.5–1149.0) 491.6 (369.9–591.7) 56.7 (39.2–68.9) 249.7 (181.0–302.8) 603.6 (405.1–749.3) 563.0 (389.3–692.2)
IHD 554.1 (412.3–696.5) 483.6 (344.9–624.4) 70.5 (44.5–93.2) 12.3 (6.5–17.4) 74.1 (42.0–105.9) 205.2 (113.2–296.7) 262.4 (159.6–366.0)
Low intake of vegetables HSTK 854.1 (610.7–1069.1) 557.2 (345.9–736.3) 296.9 (181.8–396.8) 36.7 (18.0–50.7) 157.8 (74.6–222.6) 363.2 (176.5–524.3) 295.9 (148.8–425.8)
ISTK 143.0 (90.9–191.6) 103.1 (55.4–148.1) 39.9 (23.8–55.7) 3.3 (1.6–4.7) 10.3 (5.5–14.7) 39.1 (18.4–57.6) 90.2 (41.1–136.1)
TSTK 997.1 (747.1–1220.7) 660.3 (439.6–853.8) 336.8 (221.4–439.8) 40.0 (21.4–53.9) 168.1 (86.7–233.1) 402.3 (212.7–565.0) 386.1 (224.8–528.7)
IHD 418.1 (325.6–499.7) 362.4 (267.0–444.0) 55.7 (41.3–70.4) 10.0 (6.2–13.4) 57.7 (37.3–76.5) 151.6 (99.0–204.1) 198.7 (127.9–267.7)
Low intake of whole grains HSTK 587.3 (519.6–655.6) 374.7 (316.7–430.3) 212.6 (179.6–245.4) 26.0 (21.2–30.6) 111.4 (89.6–133.7) 249.8 (195.4–301.1) 199.7 (156.1–239.7)
ISTK 141.2 (119.3–162.3) 98.9 (78.9–117.6) 42.3 (35.1–49.3) 3.3 (2.7–3.8) 10.2 (8.3–12.1) 39.4 (31.0–46.9) 88.1 (67.0–107.9)
TSTK 728.5 (653.1–801.2) 473.6 (410.5–534.1) 254.9 (221.0–288.6) 29.3 (24.4–33.9) 121.6 (99.3–144.4) 289.3 (236.1–340.5) 287.8 (239.6–333.6)
IHD 619.0 (501.2–734.8) 530.1 (413.9–640.0) 89.0 (67.1–108.0) 14.3 (9.7–18.4) 83.8 (56.5–108.3) 226.6 (152.1–294.1) 294.1 (206.8–379.0)
DM 538.4 (422.3–636.0) 399.7 (295.3–495.2) 138.7 (107.2–170.6) 9.7 (7.2–12.1) 42.6 (29.0–53.0) 189.3 (129.8–239.8) 296.6 (206.4–380.7)
High intake of processed meats IHD 8.6 (4.4–11.4) 7.1 (3.9–10.6) 1.5 (0.3–0.9) 0.8 (0.3–1.5) 3.5 (0.7–6.3) 1.9 (0.5–3.4) 2.4 (0.3–2.9)
DM 5.8 (3.8–6.1) 3.9 (2.9–5.1) 1.9 (0.7–1.3) 0.5 (0.3–0.7) 1.6 (0.9–2.2) 1.5 (0.9–2.2) 2.3 (0.7–2.2)
High intake of unprocessed meats DM 74.3 (44.3–105.4) 59.6 (30.0–89.6) 14.7 (8.3–21.5) 2.4 (1.0–3.8) 7.7 (3.2–12.6) 31.1 (11.3–51.5) 33.0 (11.9–55.2)
High intake of sodium HSTK 657.4 (502.3–815.0) 443.1 (307.6–587.2) 214.2 (136.7–299.0) 17.2 (10.6–24.7) 48.7 (17.8–87.0) 395.8 (261.2–536.0) 195.2 (133.5–266.1)
ISTK 147.8 (121.4–174.7) 105.5 (80.6–130.5) 42.3 (32.3–52.5) 2.1 (1.5–2.7) 3.9 (1.6–6.2) 59.8 (45.0–73.3) 81.9 (60.8–102.9)
TSTK 805.2 (651.1–961.3) 548.6 (409.4–694.4) 256.5 (180.0–341.7) 19.3 (12.6–26.8) 52.6 (22.1–91.4) 455.6 (319.6–597.3) 277.1 (212.4–352.0)
IHD 525.7 (385.5–684.4) 456.2 (320.7–609.3) 69.6 (46.9–95.0) 11.5 (5.1–18.5) 37.5 (14.0–67.8) 265.8 (151.7–392.3) 210.9 (137.5–291.0)
AA 23.4 (19.3–27.8) 18.0 (14.0–22.0) 5.5 (4.0–7.0) 1.1 (0.7–1.5) 1.8 (0.7–2.9) 11.0 (7.8–14.6) 9.5 (7.0–12.4)
HHD 22.6 (18.6–26.5) 20.2 (16.1–24.2) 2.4 (1.9–2.9) 0.5 (0.3–0.6) 1.1 (0.5–1.6) 9.6 (7.1–11.8) 11.5 (8.1–14.5)
RHD 3.3 (2.4–4.2) 1.8 (1.1–2.5) 1.5 (0.9–2.1) 0.0 (0.0–0.0) 0.1 (0.0–0.2) 1.6 (1.0–2.4) 1.5 (1.0–2.1)
Low intake of nuts IHD 846.7 (692.6–976.3) 725.3 (573.0–855.5) 121.4 (94.3–144.8) 19.5 (14.3–24) 113.3 (79.7–140.5) 307.8 (217.2–388.4) 405.8 (292.2–506.8)
DM 232.7 (179.7–286.5) 173.3 (121.7–222.3) 59.4 (41.0–77.9) 4.4 (2.9–5.7) 19.2 (12.4–25.4) 82.6 (49.5–111.7) 126.4 (84.4–170.0)
Low intake of seafood ω-3 fats IHD 754.4 (647.8–848.6) 646.2 (542.4–738.4) 108.2 (90.1–126.2) 17.2 (13.6–20.6) 100.8 (79.1–121) 276.0 (213.3–333.0) 360.3 (282.4–433.6)
High fasting plasma glucose TSTK 314.7 (301.1–329.7) 237.8 (224.7–251.7) 76.9 (72.0–81.4) 2.7 (2.2–3.3) 30.9 (28.3–33.4) 119.0 (110.0–127.5) 161.9 (150.2–172.6)
IHD 373.7 (355.5–393.2) 333.7 (316.1–353.1) 40.0 (36.9–42.8) 1.7 (1.4–2.1) 26.4 (23.9–28.9) 125.7 (114.8–136.3) 219.8 (202.7–236.8)
High total cholesterol ISTK 149.2 (144.0–154.3) 97.5 (92.7–102.3) 51.7 (50.2–53.1) 4.4 (4.2–4.7) 15.2 (14.6–15.7) 52.3 (50.1–54.4) 77.2 (72.7–81.9)
IHD 1124.4 (1092.2–1159.7) 944.7 (912.8–979.6) 179.7 (174.8–184.5) 26.7 (25.1–28.3) 175.3 (169.3–181.2) 455.3 (436.4–475.6) 466.8 (440.5–494.1)
High systolic blood pressure HSTK 896.6 (856.6–936.6) 634.3 (597.5–670.6) 262.3 (244.9–279.4) 9.7 (7.4–12.1) 66.1 (56.1–76.4) 411.8 (381.6–440.8) 408.4 (381.4–435.9)
High systolic blood pressure ISTK 242.6 (229.6–257.1) 182.5 (170.4–195.8) 60.1 (55.8–64.3) 1.2 (0.9–1.5) 5.4 (4.6–6.1) 61.8 (57.0–66.5) 174.2 (161.5–186.8)
TSTK 1139.2 (1094.9–1180.1) 816.8 (778.7–856.8) 322.4 (304.8–341.3) 10.9 (8.6–13.2) 71.5 (61.8–81.5) 473.6 (443.1–503.0) 582.6 (551.6–613.4)
IHD 795.3 (748.4–843.8) 694.4 (647.6–744.4) 100.9 (93.2–108.5) 6.2 (4.7–7.9) 44.6 (37.0–52.4) 285.6 (258.0–312.9) 458.7 (420.7–496.1)
HHD 37.0 (35.3–38.4) 33.6 (32.0–35.0) 3.4 (3.2–3.6) 0.3 (0.2–0.4) 1.5 (1.3–1.7) 10.9 (10.2–11.6) 24.3 (22.8–25.7)
RHD 4.8 (4.4–5.1) 2.5 (2.2–2.7) 2.3 (2.1–2.5) 0.0 (0.0–0.0) 0.1 (0.1–0.2) 1.5 (1.4–1.7) 3.1 (2.8–3.3)
AA 34.5 (32.4–36.5) 26.8 (24.7–28.6) 7.7 (7.2–8.3) 0.6 (0.4–0.7) 2.3 (1.9–2.6) 11.2 (10.2–12.4) 20.4 (18.8–22.1)
High body mass index HSTK 955.9 (934.5–976.7) 642.4 (623.7–660.8) 313.5 (302.2–323.9) 43.2 (41.3–45.2) 185.1 (178.2–192.2) 414.5 (398.8–430.3) 312.5 (298.8–325.8)
ISTK 164.9 (159.4–171.2) 117.1 (111.8–122.8) 47.9 (45.9–49.7) 3.9 (3.7–4.1) 11.9 (11.4–12.4) 47.5 (45.4–49.6) 101.6 (96.4–107.1)
TSTK 1120.9 (1098.8–1142.6) 759.5 (739.7–779.4) 361.4 (350.4–372.1) 47.2 (45.3–49.1) 197.0 (190.1–204.1) 462.0 (446.2–478.3) 414.1 (399.2–429.5)
IHD 674.5 (653.1–697.1) 581.8 (561.2–604.8) 92.7 (88.4–96.9) 18.6 (17.4–19.7) 95.4 (90.4–100.2) 248.4 (234.8–261.6) 311.9 (294.7–329.1)
DM 928.6 (902.9–953.5) 694.0 (669.9–718.0) 234.5 (226.9–242.3) 14.6 (14.0–15.2) 68.3 (66.1–70.7) 323.3 (311.1–335.7) 521.8 (498.2–542.8)
HHD 23.8 (22.9–24.6) 21.2 (20.3–22.0) 2.6 (2.5–2.7) 2.2 (2.1–2.3) 7.3 (6.9–7.6) 13.8 (13.0–14.6) 2.2 (2.1–2.3)

HSTK, haemorrhagic stroke; ISTK, ischemic stroke; TSTK, total strokes; IHD, ischemic heart disease; DM, diabetes mellitus; AA, aortic aneurysm and dissection; HHD, hypertensive heart disease; RHD, rheumatic heart diseases; UI, uncertainty interval.

*The values were expressed as death number for each risk factors (95% UIs).

ACKNOWLEDGEMENTS

This research was supported by Cooperative Research Program for Agriculture Science & Technology Development through the Rural Development Administration of Korea (Project No. PJ010975 to MJS).

Notes

The authors have no financial conflicts of interest.

References

1. World Health Organizaion. Global status report on noncommunicable diseases 2014. Geneva: World Health Organizaion;2014.
2. Statistics Korea. Causes of Death Statistics in 2014. Daejeon: Statistics Korea;2015.
3. Ministry of Health and Welfare of Korea, Korea Centers for Disease Control and Prevention. 2013 Korea Health Statistics. Seoul: Ministry of Health and Welfare of Korea;2014.
4. Danaei G, Ding EL, Mozaffarian D, Taylor B, Rehm J, Murray CJ, et al. The preventable causes of death in the United States: comparative risk assessment of dietary, lifestyle, and metabolic risk factors. PLoS Med. 2009; 6:e1000058.
crossref
5. Lim SS, Vos T, Flaxman AD, Danaei G, Shibuya K, Adair-Rohani H, et al. A comparative risk assessment of burden of disease and injury attributable to 67 risk factors and risk factor clusters in 21 regions, 1990-2010: a systematic analysis for the Global Burden of Disease Study 2010. Lancet. 2012; 380:2224–2260.
6. GBD 2013 Risk Factors Collaborators. Forouzanfar MH, Alexander L, Anderson HR, Bachman VF, Biryukov S, et al. Global, regional, and national comparative risk assessment of 79 behavioural, environmental and occupational, and metabolic risks or clusters of risks in 188 countries, 1990-2013: a systematic analysis for the Global Burden of Disease Study 2013. Lancet. 2015; 386:2287–2323.
7. Murray CJ, Ezzati M, Lopez AD, Rodgers A, Vander Hoorn S. Comparative quantification of health risks conceptual framework and methodological issues. Popul Health Metr. 2003; 1:1.
crossref
8. Lee KS, Park JH. Burden of disease in Korea during 2000-10. J Public Health (Oxf). 2014; 36:225–234.
crossref
9. Lee SK, Sobal J. Socio-economic, dietary, activity, nutrition and body weight transitions in South Korea. Public Health Nutr. 2003; 6:665–674.
crossref
10. Oh IH, Yoon SJ, Kim EJ. The burden of disease in Korea. J Korean Med Assoc. 2011; 54:646–652.
crossref
11. Yoon SJ, Bae SC, Lee SI, Chang H, Jo HS, Sung JH, et al. Measuring the burden of disease in Korea. J Korean Med Sci. 2007; 22:518–523.
crossref
12. Singh GM, Danaei G, Farzadfar F, Stevens GA, Woodward M, Wormser D, et al. The age-specific quantitative effects of metabolic risk factors on cardiovascular diseases and diabetes: a pooled analysis. PLoS One. 2013; 8:e65174.
crossref
13. Shulkin ML, Micha R, Rao M, Singh GM, Mozaffarian D. Abstract P279: major dietary risk factors for cardiometabolic disease: current evidence for causal effects and effect sizes from the global burden of diseases (GBD) 2015 study. Circulation. 2016; 133:Suppl 1. AP279.
crossref
14. Kweon S, Kim Y, Jang MJ, Kim Y, Kim K, Choi S, et al. Data resource profile: the Korea National Health and Nutrition Examination Survey (KNHANES). Int J Epidemiol. 2014; 43:69–77.
crossref
15. Rural Development Administration. Consumer Friendly Food Composition Table for Adults. Suwon: Rural Development Administration;2009.
16. Kesteloot H, Park BC, Lee CS, Brems-Heyns E, Claessens J, Joossens JV. A comparative study of blood pressure and sodium intake in Belgium and in Korea. Eur J Cardiol. 1980; 11:169–182.
crossref
17. Willett W, Stampfer MJ. Total energy intake: implications for epidemiologic analyses. Am J Epidemiol. 1986; 124:17–27.
crossref
18. Goodpaster BH, Krishnaswami S, Harris TB, Katsiaras A, Kritchevsky SB, Simonsick EM, et al. Obesity, regional body fat distribution, and the metabolic syndrome in older men and women. Arch Intern Med. 2005; 165:777–783.
crossref
19. Ezzati M, Riboli E. Behavioral and dietary risk factors for noncommunicable diseases. N Engl J Med. 2013; 369:954–964.
crossref
20. Martinez-Gonzalez MA, Bes-Rastrollo M. Dietary patterns, Mediterranean diet, and cardiovascular disease. Curr Opin Lipidol. 2014; 25:20–26.
crossref
21. Micha R, Kalantarian S, Wirojratana P, Byers T, Danaei G, Elmadfa I, et al. Estimating the global and regional burden of suboptimal nutrition on chronic disease: methods and inputs to the analysis. Eur J Clin Nutr. 2012; 66:119–129.
crossref
22. Farzadfar F, Danaei G, Namdaritabar H, Rajaratnam JK, Marcus JR, Khosravi A, et al. National and subnational mortality effects of metabolic risk factors and smoking in Iran: a comparative risk assessment. Popul Health Metr. 2011; 9:55.
crossref
23. Wiseman M. The second World Cancer Research Fund/American Institute for Cancer Research expert report. Food, nutrition, physical activity, and the prevention of cancer: a global perspective. Proc Nutr Soc. 2008; 67:253–256.
crossref
24. Guilbert JJ. The world health report 2002-reducing risks, promoting healthy life. Educ Health (Abingdon). 2003; 16:230.
crossref
25. Lock K, Pomerleau J, Causer L, Altmann DR, McKee M. The global burden of disease attributable to low consumption of fruit and vegetables: implications for the global strategy on diet. Bull World Health Organ. 2005; 83:100–108.
26. van't Veer P, Jansen MC, Klerk M, Kok FJ. Fruits and vegetables in the prevention of cancer and cardiovascular disease. Public Health Nutr. 2000; 3:103–107.
27. Kim MK, Kim K, Shin MH, Shin DH, Lee YH, Chun BY, et al. The relationship of dietary sodium, potassium, fruits, and vegetables intake with blood pressure among Korean adults aged 40 and older. Nutr Res Pract. 2014; 8:453–462.
crossref
28. Mellen PB, Walsh TF, Herrington DM. Whole grain intake and cardiovascular disease: a meta-analysis. Nutr Metab Cardiovasc Dis. 2008; 18:283–290.
crossref
29. Jang Y, Lee JH, Kim OY, Park HY, Lee SY. Consumption of whole grain and legume powder reduces insulin demand, lipid peroxidation, and plasma homocysteine concentrations in patients with coronary artery disease: randomized controlled clinical trial. Arterioscler Thromb Vasc Biol. 2001; 21:2065–2071.
crossref
30. Kesteloot H, Zhang J. Salt consumption during the nutrition transition in South Korea. Am J Clin Nutr. 2000; 72:199–201.
crossref
31. Joossens JV, Geboers J. Dietary salt and risks to health. Am J Clin Nutr. 1987; 45:5 Suppl. 1277–1288.
crossref
32. Kim YC, Koo HS, Kim S, Chin HJ. Estimation of daily salt intake through a 24-hour urine collection in Pohang, Korea. J Korean Med Sci. 2014; 29:Suppl 2. S87–S90.
crossref
33. Afshin A, Micha R, Khatibzadeh S, Fahimi S, Shi P, Powles J, et al. The impact of dietary habits and metabolic risk factors on cardiovascular and diabetes mortality in countries of the Middle East and North Africa in 2010: a comparative risk assessment analysis. BMJ Open. 2015; 5:e006385.
crossref
34. Aune D, Ursin G, Veierød MB. Meat consumption and the risk of type 2 diabetes: a systematic review and meta-analysis of cohort studies. Diabetologia. 2009; 52:2277–2287.
crossref
35. Pan A, Sun Q, Bernstein AM, Schulze MB, Manson JE, Willett WC, et al. Red meat consumption and risk of type 2 diabetes: 3 cohorts of US adults and an updated meta-analysis. Am J Clin Nutr. 2011; 94:1088–1096.
crossref
36. Micha R, Khatibzadeh S, Shi P, Andrews KG, Engell RE, Mozaffarian D. Global Burden of Diseases Nutrition and Chronic Diseases Expert Group (NutriCoDE). Global, regional and national consumption of major food groups in 1990 and 2010: a systematic analysis including 266 country-specific nutrition surveys worldwide. BMJ Open. 2015; 5:e008705.
crossref
37. Murphy SP, Allen LH. Nutritional importance of animal source foods. J Nutr. 2003; 133:11 Suppl 2. 3932S–3935S.
crossref
38. Baik I, Lee M, Jun NR, Lee JY, Shin C. A healthy dietary pattern consisting of a variety of food choices is inversely associated with the development of metabolic syndrome. Nutr Res Pract. 2013; 7:233–241.
crossref
39. Engels EA, Schmid CH, Terrin N, Olkin I, Lau J. Heterogeneity and statistical significance in meta-analysis: an empirical study of 125 meta-analyses. Stat Med. 2000; 19:1707–1728.
crossref

Supplementary Material

Supplementary Table 1

Total Deaths Due to Cardiovascular Disease, Stroke, and DM in Korea (2012–2013)
TOOLS
Similar articles