Journal List > Yonsei Med J > v.58(3) > 1032150

Park, Rha, Choi, Oh, Choi, Youn, and Yoon: Comparison of Clinical Outcomes between the Right and Left Radial Artery Approaches from the Korean Transradial Coronary Intervention Registry

Abstract

Purpose

Transradial intervention (TRI) shows anatomical and technical differences between the right radial approach (RRA) and left radial approach (LRA). The aim of this study was to evaluate the efficacy and safety using LRA, compared with RRA.

Materials and Methods

A total of 1653 consecutive patients who underwent TRI from November 2004 to October 2010 were enrolled in the Korean multicenter TRI registry. The patients were divided into two groups: the RRA group (n=792 patients) and the LRA group (n=861 patients). To adjust for any potential confounders, propensity score matched (PSM) analysis was performed (C-statistic: 0.726). After PSM, a total of 1100 patients were enrolled for analysis.

Results

After PSM, the RRA group exhibited a larger contrast volume (259.3±119.6 mL vs. 227.0±90.7 mL, p<0.001), a longer fluoroscopic time (22.5±28.0 minutes vs. 17.1±12.6 minutes) and higher access site change (12.3% vs. 1.0%, p<0.001) than the LRA group. Meanwhile, the LRA group showed a shorter procedure time (49.2±30.4 minutes vs. 55.4±28.7 minutes, p=0.003) than the RRA group. After PSM, in-hospital complications and 12-month cumulative clinical outcomes were similar between the two groups.

Conclusion

Of the two TRI methods, LRA was associated with better procedural efficacy, including shorter procedural time, smaller contrast volume, and less access site change than RRA. However, both methods showed similar 12-month cumulative clinical outcomes. Therefore, LRA was deemed superior to RRA in terms of procedural feasibility without a significant difference in clinical outcomes.

INTRODUCTION

The transradial intervention (TRI) has several advantages, such as reduction of bleeding risk, improvement of patients' convenience, and immediate ambulation, as compared with transfemoral intervention (TFI).1 However, the TRI is associated with longer learning curve2 and increased fluoroscopy time, compared with TFI.3 In TRI, there are some anatomical and technical differences between the right radial approach (RRA) and the left radial approach (LRA).45 The aim of this study was to evaluate the impact of the choice of the RRA or the LRA on procedural and in hospital complications, as well as 12-month clinical outcomes, in patients undergoing TRI.

MATERIALS AND METHODS

Study population

The Korean TRI registry was used for this retrospective, observational study. A total of 1653 consecutive patients of 12 centers were enrolled in this study between November 2004 to October 2010. Patients were divided into two groups: the RRA group (n=792 patients) and the LRA group (n=861 patients). Since the baseline characteristics between two groups were not matched due to adjust potential confounders, propensity score matched (PSM) analysis was performed using a logistic regression model. After PSM, a total of 1100 patients were enrolled for this analysis. Detailed data on demographics, medical history, coronary anatomy, procedural process, procedural events, pharmacotherapy, and clinical outcomes from the index procedure were collected using a standardized reporting form. This study received approval from each Institutional Review Board.6

Study outcomes

We accessed clinical outcomes and safety outcomes at 12 months after the index procedure, which were determined before the registry was started.6 Clinical outcomes were major adverse cardiac events (MACE), composed of all-cause mortality, myocardial infarction (MI), target vessel revascularization (TVR), and stroke. All-cause mortality consisted of cardiac and noncardiac deaths. MI was defined as a creatine kinase value of >three times the upper normal limit. TVR was defined as any repeated previous percutaneous coronary intervention (PCI) or bypass surgery of any segment of the target vessel. Stroke was defined as a clinical neurologic deficit from hemorrhagic or ischemic neurologic insult. The safety outcomes were based on the rate of major bleeding. Major bleeding was defined as one of the following: bleeding requiring transfusion of >2 units of packed cells or bleeding that was fatal.7 Fatal bleeding included the following: intracranial bleeding, one that brought about reduction in the hemoglobin level of >5 g/dL or led to substantial hypotension requiring the use of intravenous inotropic agents, one that required surgical intervention, or one that required transfusion of >4 units of packed cells.8 Vascular access related bleeding was defined as one that was related to surgical or procedural interventions, such as access artery dissection, perforation, arteriovenous fistula, pseudoaneurysm or local hematoma requiring transfusion.

Statistics

The covariates that were adjusted for exposure to approach artery included age, gender, hypertension, diabetes mellitus, dyslipidemia, smoking, previous MI, previous coronary artery bypass graft (CABG), PCI, chronic heart failure and previous cerebrovascular accidents (CVAs), chronic kidney disease, number of treated vessels, treated vessels [left descending artery, left circumflex, right coronary artery (RCA), left main, ramus], lesion characteristics (type B2 or C, bifurcation, diffuse, calcification), used drug-eluting stents type (sirolimus-eluting, paclitaxel-eluting, zotarolimus-eluting, everolimus-eluting), overlap stenting and in-hospital medication treatments (aspirin, clopidogrel, cilostazol, beta-blockers, angiotensin converting enzyme inhibitors or angiotensin II receptor blockers, and statins). The C-statistic for the logistic regression model that was used to calculate the propensity score matching for the two groups was 0.726. After PSM, the baseline covariates were compared between the two groups. Various clinical outcomes at 1 year were estimated with the Kaplan-Meier method, and differences between groups were compared with the log-rank test in the PSM patients.

RESULTS

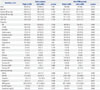
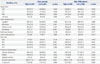
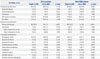
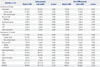
The baseline clinical characteristics of these patients are given in Table 1. After PSM, the baseline clinical characteristics were balanced between the two groups, except the RRA group had higher B-type natriuretic peptide (326.1±840.3 pg/mL vs. 173.4±553.0 pg/mL, p=0.010) (Table 1). The baseline angiographic and procedural characteristics are given in Table 2. After PSM, the baseline angiographic and procedural characteristics were balanced between the two groups, except the RRA group had larger contrast volume (259.3±119.6 mL vs. 227.0±90.7 mL, p<0.001) and longer fluoroscopic time (22.5±28.0 minutes vs. 17.1±12.6 minutes, p=0.005) during procedure, compared with the LRA group. The procedural and in-hospital complications are given in Table 3. After PSM, the RRA group had higher chance of access site change (12.3% vs. 1.0%, p<0.001) than the LRA group. However, procedural complications, including acute thrombosis, dissection, distal embolization, perforation, and side branch occlusion, were similar between the two groups. Access site complications, including hematoma, and in-hospital complication, including cardiogenic shock, acute renal failure, gastrointestinal bleeding, and contrast induced nephropathy, were similar between the two groups. The cumulative clinical outcomes up to 12 months are given in Table 4. After PSM, the cumulative clinical outcomes up to 12 months, including mortality, recurrent MI, repeat revascularization, stent thrombosis, and MACE, were similar between the two groups. However, the RRA group showed a numerically higher incidence of CVA than the LRA group, although the difference between the two groups did not reach statistical significance in-hospital (0.5% vs. 0.1%, p=0.624) and up to 12 months (1.1% vs. 0.2%, p=0.124).

DISCUSSION

The TRI has reduced risk of major bleeding, improved patient comfort and convenience, and reduce inpatient time and costs, compared with TFI.910 In TRI, there are clear differences in techniques, advantages, and disadvantages for the RRA and the LRA. The RRA allows for the operator to stand on the right side and has good backup force for left coronary artery. However, the RRA has poor back up force for the RCA, and it is not adequate for post CABG patients and subclavian artery tortuosity. The LRA is easy to negotiate around the arch and has good back up force for RCA. However, arm positioning of the LRA is challenging in some cases, such obese patients.1112 A previous study reported that the LRA is associated with a shorter learning curve, compared to the RRA.11 In this study, we compared the baseline procedural characteristics between the RRA and the LRA groups using PSM analysis. RRA had larger contrast volume (259.3±119.6 mL vs. 227.0± 90.7 mL, p<0.001) and longer fluoroscopic time (22.5±28.0 minutes vs. 17.1±12.6 minutes, p=0.005) during the procedure, compared with LRA.
In this study, the RRA group had higher chance of access site change (12.3% vs. 1.0%, p<0.001), which seems to be due to difficulty in catheter manipulation, which is particularly troublesome for operators with less experience. However, procedural complications, including acute thrombosis, dissection, distal embolization, perforation, and side branch occlusion, were similar between the two groups. Also access site complications, including hematoma, and in-hospital complication, including cardiogenic shock, acute renal failure, gastrointestinal bleeding, and contrast induced nephropathy, were similar between the two groups. Therefore, we suggest that although RRA had larger contrast volume and longer fluoroscopic time during procedure, compared with LRA, both are safe and effective treatments.
In this study, after PSM, the mortality, recurrent MI, repeat revascularization, stent thrombosis, and MACE, were similar between the two groups. However, although the incidence of CVA (stroke and transient ischemic attacks) was numerically higher in the RRA group, compared to the LRA group, it was not statistically significant in-hospital (0.5% vs. 0.1%, p=0.624) and up to 12 months (1.1% vs. 0.2%, p=0.124).
In RRA, catheters have to pass the opening of the right brachiocephalic artery and bend sharply into the ascending aorta, which may disrupt atherosclerotic plaques with subsequent embolization.13 Also, the longer duration of angiography with RRA contribute an additional embolic source, compared with LRA.1314 Stroke event rates in the general population were 0.4%, and similar results have also been obtained in previous studies where the trans-femoral approach was used: Fuchs, et al.15 reported a stroke event rate of 0.38%. A similar stroke rate was observed in the reports from Emory University (0.05–0.38%)16 and the Cleveland Clinic (0.3%).17 Lund, et al.14 reported that TRI generated significantly more particulate microemboli than TFI. Therefore, in the present study, we suggest that the choice of the LRA may be helpful to reduce the incidence of CVA during TRI.
The present study has several limitations. First, the present study was an observational study and was multicenter based retrospective in design. Because of the design of this study, a cause-result relationship was not established. Second, because this study was not randomized, the operator or center can act as a bias to analyze outcomes of this study. Procedure time, amount of contrast media, and even CVA complication rate could be quite different per operator or center. However, unfortunately, the distributions of RRA and LRA per center were not analyzed, and center or operator factor cannot be ruled out. Therefore, in a future study on the approaching method of PCI, center or operator factors must be mentioned.
In reality, there are some obstacles to performing LRA PCI, because it is difficult for operators to puncture the LRA from the right side of the patient, especially if the patient is obese. Further, the left arm should be abducted to the greatest possible extent towards the operator and placed on a comfortable support for operator's convenience. Therefore, if a craterization room can be set up for operator to be standing on the left side of the patient, LRA could be considered much easier.
In conclusion, while procedural efficacy, including procedural time and contrast volume, were increased and vascular access site change was more frequent in RRA, the incidence of procedural, in-hospital complications, and cumulative clinical outcomes up to 12 months were similar between the two procedures. Therefore, we suggest that LRA seems to be more effective vascular access route than RRA for TRI, although the safety of the two is similar, at least for 12 months.

Figures and Tables

Table 1

Baseline Clinical Characteristics

ymj-58-521-i001
Variables, n (%) Entire patients After PSM patients
Right (n=792) Left (n=861) p value Right (n=550) Left (n=550) p value
Male 538 (67.9) 519 (60.2) 0.001 363 (66) 347 (63) 0.313
Age, yrs 64.3±11.2 66.7±10.9 <0.001 65.1±11.2 65.2±10.7 0.872
Systolic BP (mm Hg) 126.6±21.2 128.4±18.9 0.109 127.5±21.1 127.7±18.3 0.852
Dystolic BP (mm Hg) 76.4±13.2 77.2±11.9 0.314 76.8±13.2 77.2±11.5 0.659
Heart rate 73.2±13.3 74.7±13.9 0.054 73.1±13.0 74.9±14.1 0.054
LVEF (%) 58.2±10.8 56.3±12.8 0.100 58.1±10.9 57.0±12.2 0.337
Diagnosis
 MI 246 (31.0) 252 (29.2) 0.428 166 (30.1) 155 (28.1) 0.466
 STEMI 108 (13.6) 134 (15.5) 0.268 80 (14.5) 72 (13.0) 0.485
 NSTEMI 138 (17.4) 118 (13.7) 0.037 86 (15.6) 83 (15.0) 0.802
 Stable angina 170 (21.4) 201 (23.3) 0.360 124 (22.5) 130 (23.6) 0.668
 Unstable angina 336 (42.4) 351 (40.7) 0.494 232 (42.1) 239 (43.4) 0.670
 Hypertension 506 (63.8) 550 (63.8) 0.997 347 (63.0) 344 (62.5) 0.852
 Diabetes 239 (30.1) 316 (36.7) 0.005 186 (33.8) 182 (33.0) 0.798
 Dyslipidemia 241 (30.4) 254 (29.5) 0.68 149 (27.0) 146 (26.5) 0.838
 CVA 46 (5.8) 56 (6.5) 0.557 38 (6.9) 28 (5.0) 0.204
 Heart failure 32 (4.0) 24 (2.7) 0.160 17 (3.0) 18 (3.2) 0.864
 PAD 11 (1.3) 10 (1.1) 0.680 10 (1.8) 8 (1.4) 0.635
 CKD 17 (2.1) 31 (3.6) 0.079 16 (2.9) 16 (2.9) 1.000
 Dialysis 7 (0.8) 5 (0.5) 0.468 7 (1.2) 5 (0.9) 0.562
 Smoking 420 (53.0) 406 (47.1) 0.017 279 (50.7) 265 (48.1) 0.399
 Current smoking 280 (35.3) 247 (28.6) 0.004 169 (30.7) 167 (30.3) 0.896
 Previous MI 75 (9.4) 64 (7.4) 0.136 44 (8.0) 37 (6.7) 0.419
 Previous CABG 6 (0.7) 1 (0.1) 0.060 0 (0.0) 1 (0.1) 1.000
 Previous PCI 144 (18.1) 140 (16.2) 0.301 99 (18) 91 (16.5) 0.523
Laboratory findings
 HbA1c 6.4±1.3 6.6±1.3 0.069 6.5±1.2 6.5±1.3 0.394
 CK-MB 21.5±94.3 14.8±61.3 0.101 23.9±108.7 15.0±69.9 0.118
 Troponin I 2.9±11.4 7.8±130.3 0.398 3.6±12.8 10.4±166.7 0.440
 Troponin T 0.2±1.4 0.2±1.2 0.546 0.2±1.5 0.2±1.0 0.837
 BNP (pg/mL) 323.3±875.2 211.0±604.2 0.026 326.1±840.3 173.4±553.0 0.010
 hs CRP (mg/dL) 1.6±8.3 1.9±11.5 0.497 1.4±9.2 2.1±14. 0.374
 Creatinine (mg/dL) 0.9±0.3 0.9±0.4 0.272 0.9±0.4 0.9±0.5 0.666

PSM, propensity score matched; BP, blood pressure; LVEF, left ventricular ejection fraction; MI, myocardial infarction; STEMI, ST-segment elevation myocardial infarction; NSTEMI, non ST-segment elevation myocardial infarction; CVA, cerebrovascular accident; PAD, peripheral artery disease; CKD, chronic kidney disease; CABG, coronary bypass graft; PCI, percutaneous coronary intervention; HbA1c, hemoglobin A1c; CK-MB, creatine kinase MB; BNP, B-type natriuretic peptide; hs CRP, high sensitivity C-reactive protein.

Continuous variables are given as the mean SD; categorical variables are given as counts, with percentages in parentheses.

Table 2

Baseline Angiographic and Procedural Characteristics

ymj-58-521-i002
Variables, n (%) Entire patients After PSM patients
Right (n=792) Left (n=861) p value Right (n=550) Left (n=550) p value
Target lesion
 LAD 457 (57.7) 484 (56.2) 0.542 320 (58.1) 304 (55.2) 0.330
 LCx 129 (16.2) 174 (20.2) 0.040 103 (18.7) 106 (19.2) 0.818
 RCA 369 (46.5) 398 (46.2) 0.882 241 (43.8) 251 (45.6) 0.544
 Left main 23 (2.9) 40 (4.6) 0.065 18 (3.2) 22 (4.0) 0.519
Lesion characteristics
 TypeB2/C 590 (74.4) 602 (69.9) 0.038 391 (71.0) 389 (70.7) 0.894
 Bifurcation 214 (27.0) 173 (20.0) 0.001 123 (22.3) 119 (21.6) 0.771
 Diffuse (>2 cm) 307 (38.7) 310 (36.0) 0.247 200 (36.3) 204 (37.0) 0.802
 Calcification 57 (7.1) 172 (19.9) <0.001 53 (9.6) 56 (10.1) 0.762
Multivessel disease* 185 (23.3) 227 (26.3) 0.158 129 (23.4) 133 (24.1) 0.777
Chronic total occlusion 51 (6.4) 75 (8.7) 0.082 40 (7.2) 38 (6.9) 0.814
Stent type
 SES 74 (9.3) 84 (9.7) 0.776 56 (10.1) 53 (9.6) 0.762
 PES 412 (52.0) 325 (37.7) <0.001 235 (42.7) 243 (44.1) 0.627
 ZES 181 (22.8) 333 (38.6) <0.001 164 (29.8) 173 (31.4) 0.556
 EES 293 (36.9) 322 (37.3) 0.865 224 (40.7) 212 (38.5) 0.459
Procedural characteristics
 Adjuvant ballooning 599 (75.6) 590 (68.5) 0.001 398 (72.3) 371 (67.4) 0.076
 LMWH 194 (24.4) 167 (19.3) 0.012 115 (20.9) 111 (20.1) 0.765
 GpIIb/IIIa inhibitor 20 (2.5) 46 (5.3) 0.003 17 (3.0) 15 (2.7) 0.720
 Contrast volume (mL) 268.3±119.7 228.4±92.3 <0.001 259.3±119.6 227.0±90.7 <0.001
 F-time (min) 21.6±26.1 17.0±12.4 0.004 22.5±28.0 17.1±12.6 0.005

PSM, propensity score matched; LAD, left anterior descending artery; LCx, left circumflex artery; RCA, right coronary artery; SES, sirolimus-eluting stent; PES, paclitaxel-eluting stent; ZES, zotarolimus-elution stent; EES, everolimus-elution stent; LMWH, low molecular weight heparin; GpIIb/IIIa inhibitor, glycoprotein IIb/IIIa inhibitors; F- time, fluoroscopic time.

Continuous variables are given as the mean SD; categorical variables are given as counts, with percentages in parentheses.

*Number of coronary arteries narrowed >2.

Table 3

Procedural and In-Hospital Complications

ymj-58-521-i003
Variables, n (%) Entire patients After PSM patients
Right (n=792) Left (n=861) p value Right (n=550) Left (n=550) p value
Procedural complications 65 (8.2) 88 (10.2) 0.158 49 (8.9) 58 (10.5) 0.360
 Acute thrombosis 2 (0.2) 3 (0.3) 1.000 1 (0.1) 2 (0.3) 1.000
 Distal embolization 2 (0.2) 1 (0.1) 0.610 2 (0.3) 0 (0.0) 0.500
 Perforation 3 (0.3) 1 (0.1) 0.355 1 (0.1) 1 (0.1) 1.000
 Side branch occlusion 24 (3.0) 42 (4.8) 0.055 19 (3.4) 30 (5.4) 0.108
 No reflow 20 (2.5) 20 (2.3) 0.789 18 (3.2) 10 (1.8) 0.126
Access site complications
 Access site change 80 (10.1) 10 (1.1) <0.001 68 (12.3) 6 (1.0) <0.001
 Hematoma 7 (0.8) 10 (1.1) 0.576 4 (0.7) 4 (0.7) 1.000
  Minor hematoma (<4 cm) 7 (0.8) 10 (1.1) 0.576 4 (0.7) 4 (0.7) 1.000
  Major hematoma (≥4 cm) 0 (0.0) 0 (0.0) 1.000 0 (0.0) 0 (0.0) 1.000
In-hospital complications
 Cardiogenic shock 20 (2.5) 19 (2.2) 0.670 15 (2.7) 12 (2.1) 0.559
 Acute renal failure 0 (0.0) 4 (0.4) 0.126 0 (0.0) 4 (0.7) 0.124
 Acute heart failure 9 (1.1) 9 (1.0) 0.859 6 (1.0) 6 (1.0) 1.000
 Cerebrovascular accident 4 (0.5) 2 (0.2) 0.435 3 (0.5) 1 (0.1) 0.624
 Gastrointestinal bleeding 5 (0.6) 8 (0.9) 0.493 3 (0.5) 4 (0.7) 1.000
 Transfusion 29 (3.6) 41 (4.7) 0.267 17 (3.0) 27 (4.9) 0.124
 Transfusion (pint) 4.3±7.6 2.3±1.8 0.172 4.5±9.7 2.2±2.0 0.358
 Contrast reaction 5 (0.6) 12 (1.3) 0.125 2 (0.3) 6 (1.0) 0.287
 Contrast induced nephropathy 5 (0.6) 11 (1.2) 0.180 2 (0.3) 5 (0.9) 0.452

PSM, propensity score matched.

Continuous variables are given as the mean SD; categorical variables are given as counts, with percentages in parentheses.

Table 4

Cumulative Clinical Outcomes Up to 12 Months

ymj-58-521-i004
Variables, n (%) Entire patients After PSM patients
Right (n=792) Left (n=861) p value Right (n=550) Left (n=550) p value
Outcomes at 30 days
 Total death 22 (2.7) 29 (3.3) 0.488 14 (2.5) 12 (2.1) 0.691
  Cardiac death 21 (2.6) 25 (2.9) 0.756 14 (2.5) 11 (2.0) 0.544
  Non-cardiac death 1 (0.1) 4 (0.4) 0.376 0 (0.0) 1 (0.1) 1.000
 Recurrent MI 1 (0.1) 1 (0.1) 1.000 1 (0.1) 1 (0.1) 1.000
  NSTEMI 1 (0.1) 1 (0.1) 1.000 1 (0.1) 1 (0.1) 1.000
 Revascularizations 6 (0.7) 5 (0.5) 0.659 5 (0.9) 3 (0.5) 0.726
 TLR 6 (0.7) 5 (0.5) 0.659 5 (0.9) 3 (0.5) 0.726
 TVR 6 (0.7) 5 (0.5) 0.659 5 (0.9) 3 (0.5) 0.726
 Stent thrombosis 6 (0.7) 6 (0.6) 0.885 5 (0.9) 3 (0.5) 0.726
Outcomes at 12 months
 Total death 31 (3.9) 52 (6.0) 0.048 21 (3.8) 26 (4.7) 0.456
  Cardiac death 23 (2.9) 36 (4.2) 0.162 15 (2.8) 16 (2.9) 0.855
  Non-cardiac death 8 (1.0) 16 (1.8) 0.150 6 (1.0) 10 (1.8) 0.314
 Recurrent MI 3 (0.3) 5 (0.5) 0.728 3 (0.5) 3 (0.5) 1.000
  STEMI 0 (0.0) 1 (0.1) 1.000 0 (0.0) 1 (0.1) 1.000
  NSTEMI 3 (0.3) 4 (0.4) 1.000 3 (0.5) 2 (0.4) 1.000
 Revascularizations 33 (4.1) 46 (5.3) 0.263 25 (4.5) 27 (4.9) 0.776
 TLR 23 (2.9) 36 (4.1) 0.162 17 (3.0) 23 (4.1) 0.334
 TVR 33 (4.1) 43 (4.9) 0.422 25 (4.5) 27 (4.9) 0.776
 Stent thrombosis 6 (0.7) 7 (0.8) 0.899 5 (0.9) 3 (0.5) 0.726
 CVA 9 (1.1) 2 (0.2) 0.024 6 (1.1) 1 (0.2) 0.124
 MACE 61 (7.7) 97 (11.2) 0.014 44 (8.0) 53 (9.6) 0.339
 MACCE 70 (8.8) 97 (11.2) 0.102 50 (9.1) 53 (9.6) 0.756

PSM, propensity score matched; MI, myocardial infarction; STEMI, ST-segment elevation myocardial infarction; NSTEMI, non ST-segment elevation myocardial infarction; TLR, target lesion revascularization; TVR, target vessel revascularization; CVA, cerebrovascular accident; MACE, major adverse cardiovascular events; MACCE, major adverse cerebrovascular events.

Continuous variables are given as the mean SD; categorical variables are given as counts, with percentages in parentheses.

Notes

The authors have no financial conflicts of interest.

References

1. Doyle BJ, Rihal CS, Gastineau DA, Holmes DR Jr. Bleeding, blood transfusion, and increased mortality after percutaneous coronary intervention: implications for contemporary practice. J Am Coll Cardiol. 2009; 53:2019–2027.
crossref
2. Spaulding C, Lefèvre T, Funck F, Thébault B, Chauveau M, Ben Hamda K, et al. Left radial approach for coronary angiography: results of a prospective study. Cathet Cardiovasc Diagn. 1996; 39:365–370.
crossref
3. Brasselet C, Blanpain T, Tassan-Mangina S, Deschildre A, Duval S, Vitry F, et al. Comparison of operator radiation exposure with optimized radiation protection devices during coronary angiograms and ad hoc percutaneous coronary interventions by radial and femoral routes. Eur Heart J. 2008; 29:63–70.
crossref
4. Won H, Her AY, Kim BK, Kim YH, Shin DH, Kim JS, et al. Percutaneous coronary intervention is more beneficial than optimal medical therapy in elderly patients with angina pectoris. Yonsei Med J. 2016; 57:382–387.
crossref
5. Choi YJ, Kim JB, Cho SJ, Cho J, Sohn J, Cho SK, et al. Changes in the practice of coronary revascularization between 2006 and 2010 in the Republic of Korea. Yonsei Med J. 2015; 56:895–903.
crossref
6. Shin JS, Tahk SJ, Yang HM, Yoon MH, Choi SY, Choi BJ, et al. Impact of female gender on bleeding complications after transradial coronary intervention (from the Korean Transradial Coronary Intervention registry). Am J Cardiol. 2014; 113:2002–2006.
crossref
7. Jolly SS, Yusuf S, Cairns J, Niemelä K, Xavier D, Widimsky P, et al. Radial versus femoral access for coronary angiography and intervention in patients with acute coronary syndromes (RIVAL): a randomised, parallel group, multicentre trial. Lancet. 2011; 377:1409–1420.
crossref
8. Effects of recombinant hirudin (lepirudin) compared with heparin on death, myocardial infarction, refractory angina, and revascularisation procedures in patients with acute myocardial ischaemia without ST elevation: a randomised trial. Organisation to Assess Strategies for Ischemic Syndromes (OASIS-2) Investigators. Lancet. 1999; 353:429–438.
9. Rao SV, Ou FS, Wang TY, Roe MT, Brindis R, Rumsfeld JS, et al. Trends in the prevalence and outcomes of radial and femoral approaches to percutaneous coronary intervention: a report from the National Cardiovascular Data Registry. JACC Cardiovasc Interv. 2008; 1:379–386.
crossref
10. Jolly SS, Amlani S, Hamon M, Yusuf S, Mehta SR. Radial versus femoral access for coronary angiography or intervention and the impact on major bleeding and ischemic events: a systematic review and meta-analysis of randomized trials. Am Heart J. 2009; 157:132–140.
crossref
11. Sciahbasi A, Romagnoli E, Trani C, Burzotta F, Pendenza G, Tommasino A, et al. Evaluation of the “learning curve” for left and right radial approach during percutaneous coronary procedures. Am J Cardiol. 2011; 108:185–188.
crossref
12. Kim SM, Kim DK, Kim DI, Kim DS, Joo SJ, Lee JW. Novel diagnostic catheter specifically designed for both coronary arteries via the right transradial approach. A prospective, randomized trial of Tiger II vs. Judkins catheters. Int J Cardiovasc Imaging. 2006; 22:295–303.
crossref
13. Jurga J, Nyman J, Tornvall P, Mannila MN, Svenarud P, van der Linden J, et al. Cerebral microembolism during coronary angiography: a randomized comparison between femoral and radial arterial access. Stroke. 2011; 42:1475–1477.
14. Lund C, Nes RB, Ugelstad TP, Due-Tønnessen P, Andersen R, Hol PK, et al. Cerebral emboli during left heart catheterization may cause acute brain injury. Eur Heart J. 2005; 26:1269–1275.
crossref
15. Fuchs S, Stabile E, Kinnaird TD, Mintz GS, Gruberg L, Canos DA, et al. Stroke complicating percutaneous coronary interventions: incidence, predictors, and prognostic implications. Circulation. 2002; 106:86–91.
crossref
16. Weintraub WS, Mahoney EM, Ghazzal ZM, King SB 3rd, Culler SD, Morris DC, et al. Trends in outcome and costs of coronary intervention in the 1990s. Am J Cardiol. 2001; 88:497–503.
crossref
17. Batchelor WB, Anstrom KJ, Muhlbaier LH, Grosswald R, Weintraub WS, O'Neill WW, et al. Contemporary outcome trends in the elderly undergoing percutaneous coronary interventions: results in 7,472 octogenarians. National Cardiovascular Network Collaboration. J Am Coll Cardiol. 2000; 36:723–730.
crossref
TOOLS
Similar articles