

 PDF
PDF ePub
ePub Citation
 Print
Print


INTRODUCTION
Until recently, medical imaging was mostly based on anatomical imaging. However, to address an increased diagnostic need for information related to functional imaging and metabolism, novel imaging approaches have been developed, namely molecular imaging. The advent of molecular imaging can be attributed to the following factors: rapid advances in the field of biotechnology, encompassing various overlapping fields, such as cell biology, genetics, bioinformatics, and proteomics; and the merger between chemistry and nanotechnology.
Molecular imaging differs from indirect experimental approaches and those that rely on microscopic images. The results of the latter approaches are based on laboratory findings and analyses at the molecular or cellular levels to investigate cellular and pathological phenomena, whereas molecular imaging provides a more intuitive approach to gaining insight into disease pathophysiology and cellular mechanisms through in vivo real-time imaging.12 These types of molecular imaging include magnetic resonance imagining (MRI),345678 nuclear imaging,9 and optical imaging,10 and each has their own benefits and limitations. Of these, MRI offers with strong advantages, such as the highest resolution and tissue contrast, and being a noninvasive imaging approach without exposure to radiation. However, compared to that of nuclear imaging or optical imaging, MRI shows low signal sensitivity.11 To increase the sensitivity of MRI, contrast agents, such as paramagnetic gadolinium- and super-paramagnetic iron-oxide-based agents, have been used.12 The inhomogeneity and bio-instability of these magnetic particles, which leads to poor signal enhancement, still contributes to the slow growth of molecular imaging technology; however, recent developments in nanotechnology have ushered in substantial advancements.1314
Molecular MRI includes cell targeting and tracking imaging. The former uses a targeted-probe to diagnose and treat tumors and inflammation, and the latter marks grafted cells so that their movement, proliferation, differentiation, and final fate can be traced for treatment purposes. For cellular MRI, the easiest method is the direct targeting of cells by an MR contrast agent; however, barriers, such as dilution and instability of the contrast agents, limit the quality of the imaging. Nonetheless, the use of a reporter gene has been shown to moderately increase specificity and allow for long-term labeling of target cells. Studies on MRI reporter genes have been undertaken to investigate effective, safe, and more specific imaging methods of cell targeting. However, the MRI reporter genes that have been used thus far, including tyrosine, transferrin receptor (TFR),15 transferrin, and beta-galactosidase, have failed to give reproducible MRI results.16 Remarkably, ferritin, a putative MRI reporter gene, was shown to be associated with a high reproducibility for cellular MRI.171819
Ferritin is an intracellular metalloprotein, comprising a light and a heavy polypeptide chain, and binds to free iron.20 In spite of a low intracellular iron concentration, ferritin is an endogenous nanoparticle that shows a high, intrinsic magnetic property21 that is sustained without the need of an external contrast agent. Thus, ferritin may prove to be a very effective and safe MR contrast agent for cell tracking imaging.1922
This study aims to outline the effectiveness of ferritin as a contrast agent and potential reporter gene for tracking tumor cells and macrophages in mouse models of cancer.
MATERIALS AND METHODS
Ferritin
For labeling of macrophage cells, ferritin from equine spleen was purchased from SIGMA Inc. (cat no. F4503). To verify the function of ferritin as a reporter gene, high-titer adenovirus (2×10¹¹ PFU/mL) of adenovirus 5-human ferritin heavy chain (AD5-hFTH)-GFP was purchased from Vector Biolabs (Vector Biolabs, Malvern, PA, USA). The adenoviral vector was designed so that GFP expression was able to reflect adenoviral transduction and hFTH expression.
Cell culture
All cell lines used in this study were purchased from American Type Culture Collection. RAW264.7, a murine macrophage cell line, was maintained in RPMI medium supplemented with 10% fetal bovine serum (FBS) (Invitrogen, Carlsbad, CA, USA) and 1% penicillin/streptomycin (Invitrogen). U87MG, a human glioblastoma cell line, and HCT116, a human colon cancer cell line, were maintained in DMEM containing 10% FBS and 1% penicillin/streptomycin. All cells were maintained in a humidified incubator at 37℃ with 5% CO2.
Preparation of cell pellets for in vitro MR imaging
For measurement of the effect of ferritin-mediated MR contrast in cells, RAW264.7 cells (5×10⁶) were incubated with equine ferritin, at a working concentration of 5 mg/mL, in serum-free medium. For U87MG cells, 3×10⁶ cells were infected with 2×10⁸ PFU adenovirus encoded hFTH and Mock for 48 h in complete medium containing FeCl3 at the indicated concentrations at 37℃ with 5% CO2. After incubation, all cells were collected by centrifugation at 2000 rpm and washed with phosphate-buffered saline (PBS) three times. Cells were transferred to 0.2 mL thin wall strip tubes, centrifuged, and MRI measurements were taken using the cell pellets.
Animal models and preparation for MRI
The animals used in this study were kept under specific-pathogen-free conditions and maintained in a National Cancer Center animal facility in accordance with the Association for Assessment and Accreditation of Laboratory Animal Care International Animal Care policy (accredited unit; National Cancer Center Research Institute; unit number 1392). Treatments in this study were performed in accordance with an experimental proposal (No. NCC-10-136, NCC-13-163B and 15-NCCIBC-002).
Animal models
Orthotopic glioma model
Six-week-old female BALB/c nude mice were purchased from Central Lab Animal Inc. (Seoul, Korea), and U87MG cells (3×10⁵) were intracranially injected into the right brain of mice following care for two weeks with MRI every four to five days. Briefly, 14 days after inoculation with the U87MG cells, the mice were intracranially injected with 2×10⁸ PFU of Ad-hFTH into the tumor region. Histological studies and MRI experiments were performed at each indicated time point.
Colon cancer model
HCT116 cells (3×10⁶) were subcutaneously injected into the flanks of mice following care for roughly two weeks. The mean tumor volume was roughly 100 mm3. To verify the efficiency of ferritin as a reporter gene, mice were intratumorally injected with 5×10⁸ PFU of Mock or Ad-hFTH in into each left and right tumor site, respectively. To track macrophages containing ferritin, RAW264.7 cells (5×10⁶), previously incubated with equine ferritin (5 mg/mL) for 24 h, were intravenously injected into mice followed by MRI at each indicated time point.
Animal preparation for MRI
The animal was sedated with 1–3% isoflurane through a nose cone. Its core temperature was monitored by a rectal thermistor and maintained at 37℃ by a flow of warm air. An electrocardiogram (ECG) was also taken by attaching a pair of sub-dermal needle electrodes. In order to suppress artifacts associated with motion, respiratory motion was monitored using an air pillow.
MR hardware and imaging parameters
All experiments were performed using a 7T MRI (BioSpec 70/20, Bruker, Germany) with T1-, T2-, and T2*-weighted (T2*w) imaging techniques. A 35-mm-diameter quadrature birdcage-type radiofrequency coil (RF coil) was used for imaging of the subcutaneous cancer. For brain imaging of the model animals, a combination of the four-channel arrayed surface-type receive-only RF coil and 72-mm-diameter transmit-only RF coil was used.
MRI examination was performed for brain cancer model animals, which involved the T1-weighted (T1w) spin echo sequence and T2-weighted (T2w) rapid acquisition with relaxation enhancement (RARE) sequence. Imaging parameters were repetition time (TR)=800 ms (T1w)/2500 ms (T2w); echo time (TE)=10 ms (T1w)/35 ms (T2w); 256×192 acquisition matrix; field of view (FOV)=2×2 cm; slice thickness=0.7 mm; RARE factor=8. T2*w images were obtained using fast low angle shot (FLASH) sequence with the following acquisition parameters: TR=200 ms; TE=4 ms; the geometry parameters used were the same as above.
The T1w spin-echo and T2w RARE sequences were performed for imaging the colon cancer model animals. The acquisition parameters were TR=700 ms (T1w)/2500 ms (T2w); TE=10.5 ms (T1w)/30 ms (T2w); 256×192 acquisition matrix; FOV=2×2 cm; slice thickness=0.7 mm; RARE factor=8.
Prussian blue staining
For analysis of Fe uptake by ferritin, cryosections of colon cancer tissue were fixed with 4% formaldehyde, and then washed with distilled water four times. Before staining, 5% potassium ferrocyanide was mixed with 5% hydrochloric acid at a 1:1 ratio. Fixed specimens were incubated with the mixed solution for 1 hr at room temperature, washed with water four times, and counter stained with Fast Red. The slides were scanned using the Aperio Imagescope v10.2.2.2319 software (Buffalo Grove, IL, USA).
RESULTS
Ferritin-induced magnetic resonance contrast effect in vitro
To investigate whether ferritin works as a reporter, as well as a contrast agent for MRI, we used the serotype 5 adenoviral expression system of Ad-hFTH. A non-replicable adenovirus with a bi-promoter for hFTH and GFP expression was designed to monitor the transduction efficiency of adenovirus by GFP expression (Fig. 1). To examine the contrast effect of ferritin in cells, U87MG cells were infected with Mock and Ad-hFTH and the signal intensity of MR was measured with cell pellets as described in the Materials and Methods. As a result, in vitro tube imaging by adenoviral hFTH in U87MG cells was obtained, visualized as darker signal intensities in higher concentrations of Fe on T2w and T2*w images (Fig. 2). These results suggest the utilization of ferritin for MR contrast.
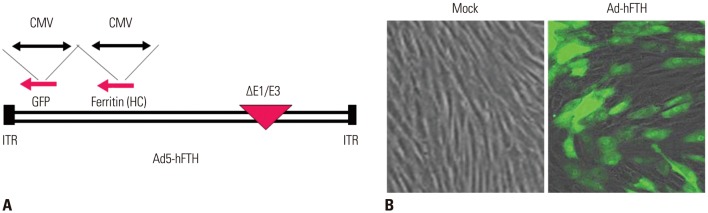
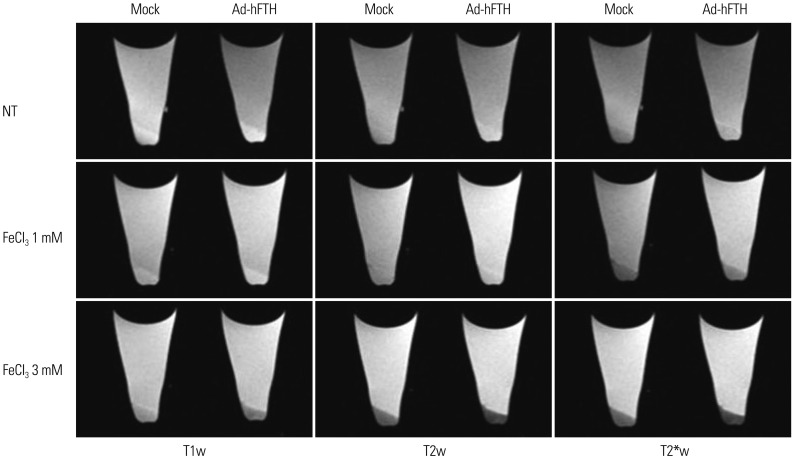
Fig. 1
Adenoviral construct for hFTH expression. (A) Schematic diagram of hFTH expressing an adenoviral vector with the Ad5 backbone and E1/E3 deletion containing the CMV promoter. The adenoviral vector was designed so that GFP expression was able to reflect adenoviral transduction. (B) GFP-positive cells indicate hFTH expression at 48 h after adenovirus infection in U87MG cells. CMV, promoter cytomegalovirus; ITR, inverted terminal repeat sequences; GFP, green fluorescence protein; HC, heavy chain; Ad, adenoviral; hFTH, human ferritin heavy chain.
![]()
Fig. 2
Ferritin-induced magnetic resonance (MR) contrast effect in vitro in U87MG cells. To prepare cell pellets for MR imaging, U87MG cells (3×10⁶) were infected with Mock and Ad-hFTH (2×10⁸ PFU) for 48 h under complete culture conditions. FeCl3 was added at indicated concentrations during infection. After incubation, all cells were pelleted by centrifugation and washed with PBS three times, followed by MRI measurements of cell pellets transferred to strip tubes. Experimental detail is described in the Materials and Methods. T1w, T1-weighted; T2w, T2-weighted; T2*w, T2*-weighted; Ad-hFTH, adenoviral human ferritin heavy chain; PBS, phosphate-buffered saline; NT, no treatment.
![]()
Ferritin as a reporter in cancer mouse models
To examine the effectiveness of ferritin as a reporter for MRI in vivo, when applied to an in vivo glioma model, from serial MRI of mice with injection of Mock and Ad-hFTH, T2w and T2*w images of mouse brain were acquired for six days (Fig. 3). Dark signal intensity at the periphery of the Ad-hFTH tumor appeared at one day after injection, which was distinct with time, and more apparent in T2*w images. There was no signal change around the Mock-injected tumor, with the exception of a linear low signal intensity suggestive of the injection site (Fig. 3B).
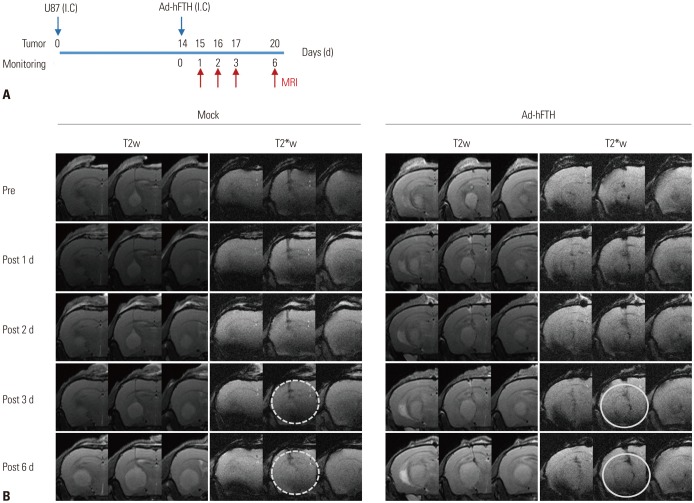
Fig. 3
Serial magnetic resonance imaging (MRI) of ferritin as a reporter in a glioma model with Ad-hFTH. (A) Experimental scheme using U87MG glioma model. (B) From serial MRI of mice after injection of Mock and Ad-hFTH (2×10⁸ PFU), T2w and T2*w images of mouse brain were acquired for six days. Dark signal intensity at the periphery of the Ad-hFTH-treated tumor appeared at day 1 post-injection, which was distinct with time, and more apparent in T2*w images. T2*w axial images show a hypo-signal peripheral rim (white circles) around the tumor three days after injection of Ad-hFTH. There was no signal change around the Mock-treated tumor, with the exception of linear low signal intensity suggestive of the injection site (white dotted circles). I.C., Intracranial injection; Ad-hFTH, adenoviral human ferritin heavy chain; T2w, T2-weighted, T2*w, T2*-weighted.
![]()
Next, we found that the ferritin-induced signal intensity was measured in a colon cancer cell mouse model using HCT116, a human colon cancer cell line, after intratumoral administration of 5×10⁸ PFU adenovirus at the indicated time points (Fig. 4). T2w images of all four mice showed low signal intensity within the Ad-hFTH tumor that appeared at 6 hr post injection, and gradually enlarged at 24 and 48 hr. All mice showed obvious hFTH-induced negative contrast, compared to Mock-infected tumor. In two mice (#1 and 2), curvilinear dark signal intensity (white arrows, Fig. 4), presumed to be hemorrhage, in the periphery of the mass in 6 and 24 h post-injection images disappeared at 48 h.
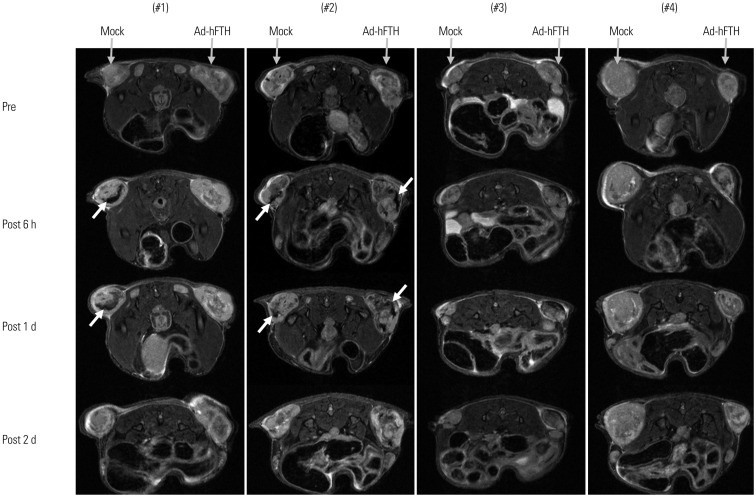
Fig. 4
Magnetic resonance imaging (MRI) of ferritin in a HCT116 subcutaneous tumor model. Ad-FTH (5×10⁸ PFU) was intratumorally injected into the tumor mass at right flank. Mock viruses were also intratumorally injected into the other side of Ad-FTH-treated tumor mass as indicated with gray arrows. To observe the contrast change inside the tumor mass, a series of T2-weighted MR images were acquired. The dark curvilinear signal intensity appeared at 6 h and 24 h after injection (white arrows) disappeared two days post-injection. Ad-FTH, adenoviral human ferritin heavy chain.
![]()
Taken together, these data suggest the potential of ferritin as a reporter for MRI in cancer models.
Ferritin for tracking of macrophage cells in MRI
To validate whether macrophage cells labeled with ferritin are suitable for cancer tracking, we performed in vivo MR imaging of ferritin-labeled RAW264.7 cells in a subcutaneous xenograft mouse model (Fig. 5). RAW264.7 cells were labeled with ferritin (5 mg/mL) and the signal intensity of MR was examined as described in the Materials and Methods. The T2w RARE images (TE/TR 40/200 ms) of the cell pellets showed dark signal intensity in the pellets of RAW264.7 cells with ferritin contrast, compared to that of the PBS control (Fig. 5A).
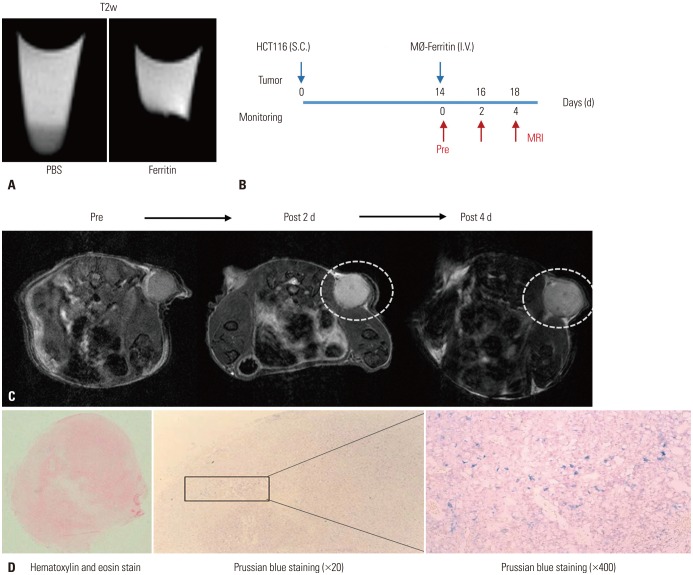
Fig. 5
Tracking of macrophages labeled with ferritin in a colon cancer mouse model using MRI. (A) The macrophage pellets labeled with equine ferritin showed a strong negative enhanced contrast in the conventional T2w images. To prepare macrophage pellets, RAW 264.7 cells were incubated with culture medium containing equine ferritin (5 mg/mL) for 24 h, and then cells were centrifuged in order to collect them at the bottom of tube. (B) Experimental scheme of macrophage tracking in a colon cancer mouse model using HCT116 cells. RAW264.7 macrophage cells labeled with equine ferritin were administrated intravenously (I.V.) after 14 days after subcutaneous (S.C.) inoculation of HCT116 colon cancer cells. MR monitoring was performed every two days after acquiring pre-imaging. (C) In T2w axial images, the dark spot inside the tumor mass (white dotted circle) could be observed four days after the injection of macrophages labeled with ferritin. (D) Prussian blue staining of the tumor mass showed scattered purple dots suggesting iron uptake in the tumor mass. The staining method is described in the Materials and Methods. T2w, T2-weighted.
![]()
Subsequently, MR imaging of mice injected with ferritin-labeled RAW264.7 cells via their tail vein was performed (Fig. 5B and C). Two days after administration of RAW264.7 cells via intravenous injection, MR images of the flank tumor showed a faint dark spot within the tumor mass. The dark spots increased in number and were more distinct on day 4 post-injection of RAW264.7 cells. Next, to confirm the uptake of iron by ferritin, we performed Prussian blue staining of paraffin-embedded tumor sections. Multiple blue dots were observed near vessel structures, suggesting that macrophage cells containing ferritin-mediated iron were distributed (Fig. 5D). These results suggest that macrophage cells can be identified in cancer mouse models via the negative contrast effect of ferritin-labeling.
DISCUSSION
This study showed that negative T2 and T2* contrast enhancement can be identified in a FTH-expressing cancer mouse model by adenoviral gene delivery, suggesting that ferritin could be a potential candidate for a MR reporter gene in cell tracking imaging.
Meanwhile, for long-term cell tracking, the establishment of a stable cell line was predominantly attempted using lentiviral or retroviral expression systems. However, there were some limitations to the use of lentiviruses in this study. One major limitation was that infected cancer cells showed irregular expression levels due to a wide range of copy number variants and increased population of dead cells because of high-titer lentivirus-induced toxicity, and thereby, it required a sorting step and amplification periods for in vivo inoculation. The gene delivery vehicle, which is a determinant of transduction efficiency and safety, is a key element for successful expression. The serotype 5 adenovirus is the most favored gene delivery vehicle, which is currently being used extensively in more than 100 cancer gene therapy clinical trials across the world; adenoviruses have the advantage of being able to transduce in both dividing and non-dividing cells, amplify in high-titer easily, and they do not integrate into the host genome.23 The adenoviral vector used in this study was designed to monitor transduction efficiency through GFP expression, although the GFP expression level is not capable of reflecting hFTH expression perfectly, like the hFTH-IRES-GFP system. The commercially available adenovirus used in this study, the construction of which is shown in Fig. 1A, is able to generate high-titer adenovirus for in vivo use in small volumes, and minimize batch variation.
The hFTH expressed by the adenovirus triggered Fe uptake around inflammatory regions, such as those in cancer. We used macrophage cells known as tropism into the tumor, thereby we provide the evidence that ferritin-labeled macrophage cells are effective monitoring tools of tumor. Like macrophages, stem cells are known to have tumor tropism, as well as wound-related inflammation. Many people have suggested that mesenchymal stem cells may be useful as a gene delivery tool in cancer therapy. Gene delivery requires a tracking system to monitor targeting efficiency and predict therapeutic efficacy. The reporter gene system using ferritin could be a multi-detection system for tracking delivery vehicle locations, cancer regions, and stem cell fates, if adopted in stem cell-mediated gene delivery.24
Ferritin would be considered to function as the MR contrast agent. although the value of relaxivity (R2) is lower than that of commercially available T2 contrast agent, Feridex.25 Actually, the value of R2 of ferritin was measured as 0.00159 mL/µg Fe·1/sec, which is almost half of Feridex, at 0.00298 mL/µg Fe·1/sec (Supplementary Fig. 1, only online). Nevertheless, the R2 value of ferritin seems to be sufficient to act as the MR contrast agent for cellular imaging. Contrast agents based on superparamagnetic particles are in clinical development. Relaxivities are frequently used to give an idea of their efficacy; however, these parameters can only be used if they are concentration independent.26 Usually, superparamagnetic iron oxide nanoparticles can be utilized to label cells.1127 In conventional MRI with superparamagnetic particles, the signal voids arising from the field distortions lead to negative contrast, which is not desirable, as the detection of cells can be masked by native low signal tissue. Additionally, it is difficult to quantify the concentration of the superparamagnetic particles. In order to overcome the negative contrast from the superparamagnetic iron oxide nanoparticles, many imaging techniques have been developed, including positive contrast imaging, susceptibility-weighted imaging, and susceptibility mapping.2829 In positive contrast imaging, the signal is obtained from off-resonance spins around the superparamagnetic iron oxide nanoparticles. The strong field distortion from the superparamagnetic particles can be detected by exciting off-resonance spins.
For susceptibility-weighted imaging and susceptibility mapping, complicated bundles of image post-processes, such as a phase map, are used after the MRI scan. Many studies have reported on more accurate maps and faster calculations. The algorithms for image post-processing are still controversial among many research groups. Due to the complexity and controversy of the quantification, superparamagnetic particle quantification was not applied to the analysis of the animal images in this study. Further investigations of quantitative MRI technique are needed.
In conclusion, through cellular level investigation and in vivo experiments using animal models, this study strongly suggests the effectiveness of ferritin as an endogenous MR contrast agent and as a potential reporter gene that is capable of maintaining cell labeling stability and cellular safety.
 XML Download