

 PDF
PDF ePub
ePub Citation
 Print
Print


INTRODUCTION
Accurate, objective and replicable assessment of psychopathology not only has advantages in clinical practice but also is essential to successful research.1 Understanding, synthesizing and interpreting results from research across diverse populations is only possible if there are comparable studies on similarly characterized research participants who were examined with assessment instruments that can be used reliably and validly in multiple cultural and ethnic groups. The scarcity of such instruments has limited cross-national studies, in particular, the contribution of psychiatry research on Asian children and adolescents to the international research community.
The Behavior Assessment System for Children (BASC) is a comprehensive behavioral rating and self-report scale for the evaluation of not only negative (clinical) but also positive (adaptive) dimensions. It has well-established psychometric properties.2 The BASC-2, a revision of the original BASC, has 100–185 questions, depending on the version (parent, teacher, child), for evaluating psychopathology, personality and adaptive functioning in children and young adults, from 2–25 years old.3 The BASC-2 includes a Teacher Rating Scale, Parent Rating Scale, Self-Report of Personality, Structured Developmental History, and a Student Observation System. The Parent Rating Scale offers a broad assessment of the child's behavioral problems and adaptive functions in both the community and home settings. It consists of three forms: preschool (age 2–5), child (age 6–11), and adolescent (age 12–21). The Parent Rating Scale-Child (PRS-C) includes 9 clinical scales (hyperactivity, aggression, conduct problems, anxiety, depression, somatization, atypicality, withdrawal, and attention problems), 5 adaptive scales (adaptability, social skills, leadership, activities of daily living and functional communication) and 4 composite scales (internalizing problems, externalizing problems, adaptive skills and behavioral symptoms index).3 The reliability and validity of the BASC-2 have been established in various samples. For example, the BASC-2 PRS-C has item consistency in general norm samples with Cronbach's alpha ranging from 0.75 to 0.88, as well as in clinical samples: 0.81 to 0.88.3
The BASC-2 also has demonstrated utility for assessing children with attention deficit/hyperactivity disorder (ADHD),45 in part because the BASC-2 not only detects ADHD symptoms but also other common, comorbid conditions. Indeed, this serves as an illustration that instruments with integrated, multiple behavior ratings, such as the BASC-2, facilitate a more comprehensive appreciation of co-occurring symptoms of developmental psychopathology in relatively common conditions such as ADHD or autism spectrum disorder (ASD).
Parent questionnaires, such as the BASC-2 PRS-C, are often used to assess psychopathology in children. However, parental identification of their offspring's behavioral problems, as well as parental perception of the need for care, can differ depending on cultural background,6 suggesting that it is important to validate the psychometric properties of assessment tools across diverse ethnic and cultural populations when studying developmental psychopathology. This facilitates interpretation and integration of research findings from a growing international developmental psychopathology research community.
Cultural differences in children's behavioral problems and adaptations have been examined for some parental questionnaires, including the Child Behavior Checklist (CBCL) and BASC-2. Crijnen, et al.7 examined variations in CBCL scores across 12 cultures, and reported cross-cultural differences in overall mean scores on the CBCL syndrome scales. Another international comparison study revealed that there were small to medium differences in mean CBCL scale scores among 24 different cultural groups.8 With regard to the BASC-2, a study comparing Colombian and US school children reported cross-cultural variability in anxiety and somatization.9 Another study, comparing Korean, Korean American, and Caucasian American children, reported differences in social, emotional, behavioral, and school adjustment functioning among these groups.10 Such efforts are limited, especially beyond Spanish and English speaking populations, because the BASC-2 PRS-C currently has established reliability and validity only in these two languages.3 There remains a significant need to demonstrate the applicability and generalizability of the BASC-2 in multiple languages and cultures.
The need for common measurement tools across diverse populations led to this study to complete: 1) translation/backt-ranslation and cultural adaptations of the BASC-2 PRS-C for use with Korean children, including an examination of the psychometric properties of the Korean version of BASC-2 PRS-C (K-BASC-2 PRS-C); and 2) cross-cultural comparisons of the psychometric properties and scores between US and Korean children in both general and clinical populations from various diagnostic groups.
MATERIALS AND METHODS
Participants
Study subjects were recruited from children who resided in the Seoul metropolitan area between 2005 and 2010. These children represent two populations: 1) general population (n=2115): a random sample of 1st to 6th graders attending 16 elementary schools that are participating in a total-population prevalence study of ASD was selected as a general norm population; 2) Clinical population (n=219): 6 to 12-year-old children who were evaluated for developmental psychopathology in child and adolescent psychiatry clinics at four university/university-affiliated medical centers (n=134). Korean Board Certified Child and Adolescent Psychiatrists evaluated all children in the outpatient clinics and made clinical diagnoses based on DSM-IV criteria. Additionally, 85 children with confirmed ASD were included in the clinical population; they were drawn from a total-population prevalence study of ASD in the same geographic area.11 All 7 to 12-year-old children in a target city (n=55226) were screened with a parent- and/or teacher-report form for the Autism Spectrum Screening Questionnaire (ASSQ). For screening positive children (parental ASSQ scores in the upper 5th percentile and/or teacher ASSQ scores ≥10), confirmative diagnostic assessments were conducted with the Autism Diagnostic Observation Schedule, Autism Diagnostic Interview-Revised and cognitive testing. Best-estimate clinical diagnoses for ASD, along with diagnoses of comorbid conditions, were generated by teams of child psychiatrists and/or a child psychologist after all relevant data were reviewed.
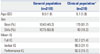
The mean age of the general population was 9.5±1.9 years and that of the clinical population was 9.1±1.8. There was a significantly higher percentage of boys in the clinical population compared to the general population: 81.7% and 49.2%, respectively. The mean full scale, verbal, and performance IQ for the clinical population were 93.7±21.4, 99.0±24.1, and 92.6±19.7, respectively (Table 1). In the clinical population, there were 85 subjects with ASD and 45 (52.9%) of them had more than one comorbid diagnosis. Diagnoses for children without ASD included: ADHD (n=90), anxiety disorders (n=21), tic disorder (n=23), depressive disorders (n=15), intellectual disability/mental retardation (n=7), conduct disorder (n=5), and oppositional defiant disorder (n=5). In the clinical population, 42 (31.3%) of the 134 children with psychiatric diagnoses other than ASD had more than one diagnosis.
Translation and back translation of the BASC-2 PRS-C
The BASC-2 PRS-C was translated by a team of researchers, including child and adolescent psychiatrists, clinical psychologists and an anthropologist. The BASC-2 PRS-C was translated into Korean, and then the K-BASC-2 PRS-C was back-translated into English by a child psychiatrist and an anthropologist, both of whom were bilingual. The back-translated version was reviewed and reconfirmed by a child and adolescent psychiatrist at the University of California San Francisco. After completing the translation and back translation and in response to comments from detailed discussions, the translation was further modified to address specific cultural differences. In order to examine the feasibility of using the translated K-BASC-2 PRS-C, it was administered to the parents visiting the clinics. Once this pilot was completed and reviewed for adequate performance, the instrument was released for use in this study.
Korean Child Behavior Checklist (K-CBCL)
The K-CBCL, a 113 item parent-report questionnaire, is the Korean version of the CBCL; K-CBCL reliability and validity have been demonstrated in Korean children.12 It is composed of a social competence scale and behavior problem scale, and includes 11 subscales.
Cognitive testing
The Korean-Wechsler Intelligence Scale for Children-III (K-WISC-III)13 for verbal children was administered to assess the cognitive function in a clinical population. We used the Leiter-R14 only for those children who had difficulty understanding verbal instructions as demonstrated by their failure to comprehend verbal instructions on the first three items of the K-WISC-III. Only 4 of 85 children with ASD were administered the Leiter-R. Thus, the reported Performance IQ data were derived from either the K-WISC-III Performance IQ subscale or the Leiter IQ score. Verbal or Full Scale scores were presented only for those for whom K-WISC-III data were available.
Statistical analyses
Descriptive statistics were provided for demographic data in the two study populations. ANOVA tests were performed to compare the mean of K-BASC-2 PRS-C subscales between children grouped by age 6–11 and age 12. Means and standard deviations (SD) of subscale raw scores were computed in each study population grouped by age 6–7, age 8–12 and sex strata. To confirm the validity of the K-BASC-2 PRS-C in differentiating various types of developmental psychopathology, consensual validity of the K-BASC-2 PRS-C was examined against DSM-IV diagnoses made by child and adolescent psychiatrists for the clinical population by examining mean T scores. Convergent validity of the K-BASC-2 PRS-C was examined relative to the K-CBCL, using correlational analyses. Internal consistency was examined with Cronbach α. Factor analysis was conducted to examine construct validity. In addition, we performed correlation analyses between raw scores of K-BASC-2 PRS-C subscales and IQ scores. Finally, we calculated the T score and percentile of K-BASC-2 PRS-C subscales for the general as well as the clinical sample, and compared them with those used for the US population. SPSS 19.0 (SPSS Inc., Chicago, IL, USA) was used for statistical analyses.
RESULTS
Comparison of K-BASC-2 PRS-C subscale raw scores between age 8–11 and age 12 groups
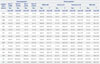
The BASC-2 PRS-C was developed for children age 6–11, corresponding to the typical demarcation between elementary and middle school in the US. In Korea, more typically, this age range is 6–12 years. In order to make our version of the BASC-2 more consistent with the developmental and cultural norms in Korea, we set the age range to 6–12 years, as this is the elementary school age range in Korea. Thus, we examined whether this change in the age range altered the psychometric properties of the BASC-2. Means and SDs of the BASC-2 subscale raw scores were compared for two groups in the general population sample: ages 8–11 (n=1214) and age 12 (n=313). Results indicated that there were no significant differences between the two groups on all but three subscales: withdrawal (df=1, F=6.272, p=0.012), adaptability (df=1, F=4.017, p=0.045) and social skills (df=1, F=3.983, p=0.046). However, the magnitudes of mean differences on these three subscales were minimal: 3 to 14% of a standard deviation (3rd and 4th columns) (Table 2). Thus, the 6–12 age range was used for the Korean elementary school BASC-2.
Mean and SD of raw and T scores of the K-BASC-2 PRS-C for subscales in the general and clinical populations
Table 2 summarizes the mean and SD of raw and T scores for subscales in the study populations. The four most common diagnostic categories, ASD, ADHD, anxiety disorder and depressive disorder were analyzed in the clinical sample. Children with a T score ≥60 in any of the clinical subscales are considered as at-risk groups.3 Compared to the general population, subscale means and SD in the children with corresponding diagnoses in the clinical population were significantly increased. For ADHD, the T score for attention problems was 64.5±9.1 and hyperactivity was 57.5±12.2; the anxiety subscale for anxiety disorder was 63.0±17.0; the depression subscale for depressive disorder was 74.6±16.0; and atypicality and withdrawal subscale scores in ASD were 72.0±18.4 and 67.5±15.6, respectively. These scores were significantly higher than those in the general population.
Internal consistency of the K-BASC-2 PRS-C subscales
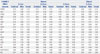
Cronbach's α for the subscales ranged from 0.60 to 0.93 in the general population and 0.52 to 0.93 in the clinical population (Table 3).
Principal-axis factor analysis
To examine construct validity, a principal-axis factor analysis was conducted for the general population with varimax rotations. A 3-factor solution explained up to 70% of total variance. In this 3-factor solution, the externalizing problem factors showed highest loadings for hyperactivity, conduct problems and aggression (0.87, 0.83, and 0.74, respectively), along with moderate loading for atypicality (0.61). The internalizing problem factors had the highest loading for anxiety, depression, withdrawal, and somatization (0.84, 0.72, 0.68, and 0.64, respectively) and moderate loading for atypicality (0.55). The adaptive skills factor showed the highest loading for leadership, adaptability, social skills, functional communication and activities of daily living (0.85, 0.70, 0.79, 0.78, and 0.66, respectively). These findings are compatible with those reported in the US population (data published previously and not shown here).3
Correlation between subscale scores of the K-BASC-2 PRS-C and K-CBCL in a clinical sample
Forty-two children in a clinical sample had both CBCL and BASC-2 measures. For these children, 48.3% had ADHD, 12.1% had tic disorders, 12.1% had anxiety disorders, 6.9% had conduct disorder, and 14.8% had other psychiatric disorders. Correlational analyses between subscales of the K-BASC-2 PRS-C and K-CBCL were completed for these children and showed that the corresponding subscales for the two measurements had statistically significant correlation coefficients, ranging from 0.49 (attention problems) to 0.86 (externalizing behavioral problems). This supports the convergent validity of the K-BASC-2 PRS-C (Supplementary Table 1, only online).
Correlation of the K-BASC-2 PRS-C subscale scores with IQ
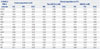
Correlational analyses between raw scores of the K-BASC-2 PRS-C subscales and verbal, performance and full scale IQ scores were conducted among a subset of study subjects who underwent cognitive testing (Table 4). In the general population, functional communication was significantly and positively correlated with all three IQ scales and had correlation coefficients ranging from 0.54 to 0.63. For the ASD subjects, atypicality and withdrawal were significantly negatively correlated with performance and/or full scale IQ (-0.24–-0.32). Adaptive skill scales, including adaptability, leadership and functional communication etc., were significantly positively correlated with IQ scores (0.23–0.63) in ASD.
Comparison of the BASC-2 PRS-C scores between Korean and American children
To examine if there are differences in the patterns of reports from parents in Korea and the US with respect to their children's behaviors at similar symptom severity/functional levels, we selected percentile ranking to compare the raw scores for the BASC-2 PRS-C subscales between the Korean and the US general population samples (US data were drawn from the BASC-2 manual).3 While the upper 97th percentile scores of most of the clinical, composite and adaptive subscales were somewhat lower in Korean children relative to US children, the difference was most prominent for behavioral problems (Table 5). For example, the upper 99th percentile raw scores of hyperactivity for Korean children in the general population (age 8–12 in Korea and 8–11 in US) and those in US children were 15 and 21, respectively. This trend was consistent regardless of age and gender. This was also true in the clinical population; for example, corresponding scores in Korean children with ADHD and US children with ADHD (age 6–12 in Korea and 6–11 in US) were 18 and 29, respectively (data not shown).
DISCUSSION
Our study indicates that the K-BASC-2 PRS-C is an excellent instrument with psychometric properties that are suitable for comprehensive screening and assessment of behavioral problems and adaptive functions in Korean children. The corresponding subscale mean T scores in the Korean clinical population were significantly higher than those in the general population. T scores on the adaptive scales for the clinical population were near or below 40 and significantly lower than those in general population, indicating that the K-BASC-2 PRS-C validly distinguishes the functional levels between clinical and non-clinical populations in Korean children.
In both the general and clinical population, the internal consistency and reliability of clinical and composite scales were comparable to the US population. The Cronbach's α for the clinical scales ranged from 0.69 to 0.83 in the general population which is almost above the conventionally acceptable level.15 Most of the alpha values in the clinical sample for our study are comparable to those reported in US children (0.77 to 0.96), with the exception of a few subscales. This is likely due to the small number of subjects in the clinical subsamples as small sample size has a tendency to deflate alpha values.16
There are some subtle, but interesting, differences noted in the mean scores of the BASC-2 PRS-C between Korean and US populations. Raw scores for most of the subscales in the same percentile ranges were lower for Korean children than for US children. The most prominent of these were behavioral problems with a mean hyperactivity subscale T score of 58, in the ADHD group which was just below the “at risk” range. Previous studies reported similar findings in Korean children with ADHD using the ADHD Rating Scale (ARS):1718 the ARS raw scores in a general Korean population sample were lower than those reported for American children.” Two plausible explanations for these findings seem most likely: 1) different thresholds for reporting the same externalizing behavioral problems between US and Korea parents; or, 2) differences in prevalence of ADHD. Previous studies of developmental psychopathology in Korean children indicated that the prevalence of disruptive behavioral problems, including ADHD, is comparable to those in Western countries,2021 making the second explanation seem unlikely. Therefore, observed discrepancies in the hyperactivity scores between Korean and US children may reflect cultural differences in parental reporting of their children's behaviors.
Cultural differences in reporting children's behavior problems have been also identified in other emotional/behavioral problems. In a multi-cultural comparison study of the CBCL in preschool children, mean Total Problem Scores for Korean children ranked 4th from the bottom among 24 societies and lowest for DSM-IV Oppositional Defiant Disorder.8 Other studies have documented that Korean parents report fewer problems in their offspring on the CBCL internalizing and externalizing behavior scales than do parents from the US22 or Australia.23 It has been hypothesized that Korean parents are reluctant to report behavior problems of their children due to negative societal stigma related to having behavior and emotional problems.22
Additionally, attention problems scores were high in all clinical groups in our study. Our finding is also consistent with previous studies that the attention problems score was elevated not only in children with ADHD but also for children with depression24 and/or ASD.25
It is plausible that patterns of parental underreporting of psychopathological signs and symptoms may be associated with lower rates of service-seeking behaviors for mental health problems in Korean children. Indeed, only 10% of Korean children with ADHD receive treatment,26 which is much lower than the 59% of US children.27 This difference warrants further investigation.
Our study demonstrates that most of the adaptive scales were positively correlated with IQ scores in ASD. In ASD children, previous research indicates that IQ predicts adaptive behavior, particularly in the communication sub-domain.2829 In our study, the positive correlation between IQ scores and adaptive function with the strongest correlation on the functional communication subscale was also driven by ASD. Functional communication and IQ appear to be two strong predictors of outcomes in ASD.30 Therefore, these findings lend further support to the importance of functional communication as part of the therapeutic process in ASD.
On the other hand, the atypicality and withdrawal subscales were negatively correlated with performance and/or full scale IQ in the ASD samples. These findings are somewhat different from a previous study indicating that verbal IQ was correlated with autism spectrum symptomatology.31 Additionally, a negative correlation between attention problems and IQ was observed in our ASD sample which is also not consistent with a previous study that reported no correlations between ADHD symptoms and IQ in children with ASD.32 Such discrepancies may have stemmed from differences in the study populations; the use of community-ascertained, rather than a clinical sample, likely led to a difference in the severity of the ASD cases and/or the presence and severity of comorbidities.
Strengths of our study include the large number of subjects from a general population sample, inclusion of a unique community-ascertained sample of children with ASD, and comparison of psychometric properties with existing, similar measures that are already validated for use with Korean children. The limitations include: 1) The general population sample was drawn from only one area in Korea. However, one quarter of the entire Korean population lives in metropolitan Seoul from where our study population was drawn. While the generalizability of our findings to the children in rural areas of Korea will be tested in a future study, our current findings should be generalizable to those in urban and suburban areas. 2) Individuals with ASD in our study were from an epidemiologically-ascertained, community sample. They have clinical characteristics that are distinct, especially in comparison to ASD samples ascertained mainly from clinics. For the epidemiologically ascertained sample, the mean IQ was 96.0±25.0 and ASD symptom severity, as measured by the Social Responsiveness Scale total T score, was 69.7±16.6. While these are important differences that may limit the comparability of our results to findings from studies conducted solely in clinically-ascertained children with ASD, they may still more accurately reflect a broader ASD phenotype. 3) The diagnoses in the clinical sample were limited mostly to ADHD and ASD, along with a small number of emotional and disruptive behavioral disorders. Inclusion of other diverse diagnoses is required in a future study. 4) Inter-rater and test-retest reliability should be examined in a future study.
Taken together, our findings indicate the importance of standardization and cultural adaptation for instruments that measure developmental psychopathology. This is especially pertinent when the instruments are introduced to and for use in populations outside of those in which the instruments were originally developed. Direct comparisons of the results or integration of research findings across different populations using instruments for which there is not a complete, rigorous standardization and cultural adaptation may lead to potentially misleading or erroneous results. On the other hand, standardization and cultural adaptation may create remarkable opportunities to not only increase sample sizes but also provide insights into cultural variations in development and psychopathology. In addition, cross national and cross cultural use of instruments increases the opportunity to establish large samples necessary for genetic, gene-environment and other studies.
Our study indicates that the K-BASC-2 PRS-C is an effective and useful instrument with psychometric properties that allow to measure general developmental psychopathology. Further study in independent, general population samples from various areas and large clinical samples with diverse diagnostic groups from different cultural and ethnic backgrounds is needed to corroborate our findings.
 XML Download