

 PDF
PDF ePub
ePub Citation
 Print
Print


INTRODUCTION
The incidence of colorectal cancer (CRC) and mortality associated with it are effectively reduced by removing precursor lesions through colonoscopy and polypectomy.12 The likelihood of developing a metachronous colorectal neoplasm (CRN) during surveillance differs according to the baseline adenoma characteristics, and thus the surveillance colonoscopy intervals depend on the baseline adenoma characteristics.3 In addition to determining baseline adenoma characteristics, identifying other risk factors for metachronous CRN may help to establish guidelines for more individualized and optimal surveillance intervals.
Diabetes and dyslipidemia have been linked to an increased risk of CRC precursor lesions, adenomas, as well as CRC.4567 Moreover, some studies have reported that high levels of parameters of glucose metabolism such as fasting glucose, hemoglobin A1c (HbA1c), insulin, and homeostasis model assessment of insulin resistance (HOMA-IR) were significantly associated with the risk of CRN.891011 In addition, several studies have demonstrated that high levels of triglyceride, total cholesterol, and low-density lipoprotein-cholesterol (LDL-C), and low levels of high-density lipoprotein-cholesterol (HDL-C) were associated with an increased risk of CRN.561213141516 Our previous study also found that the prevalence of CRN increased with increasing levels of glucose, HbA1c, insulin, HOMA-IR, triglycerides, total cholesterol, LDL-C, and apolipoprotein B (ApoB), and with decreasing levels of HDL-C and apolipoprotein A-1 (ApoA-1).17 However, all of these previous studies, including our own, were cross-sectional investigations that evaluated the associations between the prevalence of CRN and the levels of parameters of glucose and lipid metabolism.
Recently, a few studies have reported that metabolic factors such as obesity, impaired glucose tolerance, hypertension, and high waist circumference are risk factors for developing metachronous adenomas detected by surveillance colonoscopy.18192021222324 Based on these results, the parameters of glucose and lipid metabolism may also affect adenoma occurrence detected by surveillance colonoscopy. To date, there have been no studies conducted on the associations between the parameters of glucose and lipid metabolism and the occurrence of metachronous adenomas. Therefore, we conducted a longitudinal study to determine whether the parameters of glucose and lipid metabolism (including lipoproteins as well as lipids) influence the occurrence of adenomas detected by surveillance colonoscopy.
MATERIALS AND METHODS
Study population
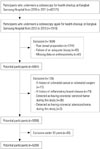
The study population consisted of asymptomatic subjects who had undergone a colonoscopy as part of a comprehensive health screening program at Kangbuk Samsung Hospital, Seoul and Suwon, Korea, between 2010 and 2011 (defined as “initial colonoscopy”) (n=62171). Of these participants, 7318 subjects underwent repeat colonoscopy as part of a health checkup between 2012 and 2013 (defined as “follow-up colonoscopy”). The exclusion criteria were as follows: poor bowel preparation (n=1744), lack of an adequate biopsy (n=43), missing anthropometric data (n=47), a history of CRC or colorectal surgery (n=17), a history of inflammatory bowel disease (n=70), detection of a colorectal carcinoid tumor during this study (n=36), detection of a colorectal adenocarcinoma during this study (n=3), and age <30 years old (n=69). The total number of eligible subjects for the study was 5289 (Fig. 1). No subject had undergone a colonoscopy in which the cecum was not reached.
In Korea, the Industrial Safety and Health Law requires employees to participate in annual or biennial health examinations. About 60% of the participants were employees of various companies and local governmental organizations and their spouses, and the remaining participants registered individually for the program. In most Korean companies, the mandatory retirement age is approximately 55 years old. As part of the welfare policy, companies often subsidize annual or biennial comprehensive health examinations including colonoscopies, regardless of the current guidelines. Such programs are popular in Korea.25 Therefore, our database had a relatively large group of subjects aged <50 years who underwent screening colonoscopy. In addition, although clinicians recommend surveillance colonoscopy intervals according to the current guideline,3 some subjects opt to undergo a colonoscopy biennially regardless of the recommendation.
Before the patients underwent the colonoscopies, general practitioners conducted interviews to ensure that the subjects had no gastrointestinal symptoms, such as visible rectal bleeding or abdominal pain. Persons with these symptoms were urged to seek medical care, and only asymptomatic participants participated in this screening program.
This study was approved by the Institutional Review Board of Kangbuk Samsung Hospital, which exempted the requirement for informed consent because we retrospectively accessed only de-identified data.
Measurements and definitions
The patient data on medical history and smoking were collected through a self-administered questionnaire, whereas the physical and serum biochemical parameters were measured by trained staff. Self-reported use of nonsteroidal anti-inflammatory drugs (NSAIDs) (regular use over the previous month) was also assessed. A family history of CRC was defined as CRC that occurred in one or more first-degree relatives at any age. A history of diabetes was defined as a self-reported diagnosis of diabetes or the use of an antidiabetic medication. A history of dyslipidemia was defined as a self-reported diagnosis of dyslipidemia or the use of a medication for dyslipidemia. Body mass index (BMI) was calculated by dividing measured weight (kg) by height squared (m2). Obesity was defined as BMI ≥30 kg/m2, based on the proposed cutoff for obesity of the World Health Organization.26
Blood samples were collected from the antecubital vein after at least a 10-hour fast. The fasting glucose level was measured using the hexokinase method (Hitachi Modulator D2400; Roche, Tokyo, Japan). HbA1c was measured using an immunoturbidimetric assay with a Cobra Integra 800 automatic analyzer (Roche Diagnostics, Basel, Switzerland) at a reference value of 4.4–6.4%. The fasting serum insulin was measured by electrochemiluminescence immunoassay (Hitachi Modular E 170; Roche). Insulin resistance was assessed with HOMA-IR according to the following equation: fasting blood insulin (mU/mL)×fasting blood glucose (mmol/L)/22.5. The serum levels of total cholesterol and triglycerides were determined using an enzymatic colorimetric assay; LDL-C and HDL-C levels were determined using a homogeneous enzymatic colorimetric assay; and serum ApoA-1 and ApoB levels were determined using an immunoturbidimetric assay.
Colonoscopy and histologic examination
The colonoscopies were performed by 1 of 13 experienced gastroenterologists (>1000 cases) by using an EVIS LUCERA CV-260 colonoscope (Olympus Medical Systems, Tokyo, Japan). All the participants took 4 L of polyethylene glycol solution for bowel preparation.
All of the detected polypoid lesions were biopsied or removed and histologically assessed by experienced pathologists. The polyps were classified by number, size, and histologic characteristics (tubular, tubulovillous, or villous adenoma; hyperplastic polyp; inflammatory polyp; sessile serrated adenoma or traditional serrated adenoma). Pathologic results that indicated hyperplastic polyps, inflammatory polyps, or lipomas were considered normal findings. The grade of dysplasia was classified as low or high. An advanced adenoma was defined as the presence of one of the following features: >10 mm diameter, tubulovillous or villous structure, and high-grade dysplasia (HGD).3 The study subjects were categorized into normal, low-risk, and high-risk groups according to their initial colonoscopy findings. The normal group was defined as subjects with no adenoma; the low-risk group, as subjects with 1–2 tubular adenomas <10 mm; and the high-risk group, as subjects who had adenomas with villous histology, HGD, size ≥10 mm, or 3 or more adenomas detected during the initial colonoscopy.3
Statistical analysis
The data were expressed as mean±SD, median (interquartile range), or number (%). Baseline characteristics were compared between subjects with and without adenomas detected on follow-up colonoscopy by using the chi-square test for categorical variables and t-test, or the Mann-Whitney U-test for continuous variables.
The associations of the individual glucose and lipid markers with the risks of occurrence of any adenoma and advanced adenoma were assessed using Cox proportional hazards modeling, adjusted for potential confounding variables such as age, gender, smoking status, family history of CRC, use of NSAIDs, obesity, and initial colonoscopy findings (normal, low-risk, and high-risk groups).We estimated the hazard ratios (HRs) of adenoma occurrence with 95% confidence intervals (CIs) by comparing quartiles 2 to 4 of markers of glucose and lipid metabolism with the first quartile. Person-years were calculated as the sum of the follow-up duration from visit 1 to visit 2. All of the reported p values are two-tailed, and statistical significance was set at p<0.05. SPSS Version 18 (IBM Corp., Armonk, NY, USA) was used for statistical analyses.
RESULTS
Baseline characteristics of study population
A total of 5289 participants were eligible for the analysis (Fig. 1). At baseline, the mean age of the 5289 subjects was 42.0±6.8 years, and 86.9% of the subjects were men. The mean interval between the initial and follow-up colonoscopy was 2.18±0.61 years, with a total of 11532 person-years. According to the initial colonoscopy findings (baseline adenoma characteristics), 3108 (58.8%) subjects were assigned to the normal group, 1724 (32.6%) to the low-risk group, and 457 (8.6%) to the high-risk group.
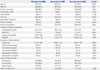
The baseline characteristics at initial colonoscopy of the subjects who had an adenoma detected during the follow-up surveillance colonoscopy and the subjects who did not are compared in Table 1. Subjects who had an adenoma detected had a higher mean age compared to subjects without an adenoma (44.6±7.4 vs. 41.4±6.6, p<0.001). The occurrence of an adenoma was seen more frequently in males (91.2% vs. 85.8%, p<0.001), current or ex-smokers (69.7% vs. 63.9%, p<0.001), and patients with fatty livers, (47.4% vs. 41.1%, p<0.001), history of diabetes (6.6 % vs. 3.8%, p<0.001), and history of dyslipidemia (19.7% vs. 15.0%, p<0.001). There were no significant differences in the proportion of subjects with a family history of CRC or the use of NSAIDs between subjects with and without adenoma occurrence.
The levels of all the parameters of glucose metabolism at initial colonoscopy were significantly higher in subjects with a detected adenoma than in subjects without an adenoma. The levels of triglycerides, total cholesterol, and ApoB were significantly higher in subjects with a detected adenoma than in subjects without adenomas, while the HDL-C levels were significantly lower in subjects with a detected adenoma than in subjects without adenomas. The LDL-C levels tended to be higher in subjects with detected adenoma; however, the difference was not statistically significant. There was no significant difference in ApoA-1 levels between the two groups. The mean interval between the initial and follow-up colonoscopy was higher in subjects with a detected adenoma than in subjects without an adenoma (2.23±0.64 years vs. 2.17±0.61 years, p=0.009).
Associations between parameters of glucose metabolism and adenoma occurrence
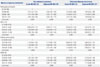
Table 2 shows the risk for occurrence of any adenoma and advanced adenoma at the time of follow-up colonoscopy among the 5289 subjects, according to the quartiles of parameters of glucose metabolism at the time of the initial colonoscopy. The occurrence of any adenoma increased linearly with increasing quartiles of fasting glucose, HbA1c, insulin, and HOMA-IR. In the multivariable-adjusted model, the associations between markers of glucose metabolism and the occurrence of any adenoma remained significant for all markers. The adjusted HRs for any adenoma occurrence when we compared the fourth with the first quartiles of fasting glucose, HbA1c, insulin, and HOMA-IR were 1.50 (95% CI, 1.26–1.77; ptrend<0.001), 1.22 (95% CI, 1.04–1.43; ptrend=0.024), 1.22 (95% CI, 1.02–1.46; ptrend=0.046), and 1.36 (95% CI, 1.14–1.63; ptrend=0.004), respectively.
The occurrence of an advanced adenoma increased linearly with increasing quartiles of fasting glucose in the univariate analysis (Q2, Q3, and Q4 vs. Q1; HRs=1.07, 1.14, and 1.97; ptrend=0.036), but the association was not statistically significant in the multivariable-adjusted model (Q2, Q3, and Q4 vs. Q1; adjusted HRs=1.01, 1.14, and 1.28; ptrend=0.398). The levels of HbA1c, insulin, and HOMA-IR did not show a significant relationship with the risk of the occurrence of an advanced adenoma (ptrend=0.963, 0.822, and 0.822, respectively).
Associations between parameters of lipid metabolism and adenoma occurrence
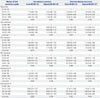
Table 3 shows the risk for occurrence of any adenoma and advanced adenoma at the time of follow-up colonoscopy, according to quartiles of the parameters of lipid metabolism. The occurrence of any adenoma increased linearly with increasing quartiles of triglycerides, LDL-C, and ApoB. In the univariate analysis, the HRs for any adenoma occurrence when we compared the fourth with the first quartiles of triglycerides, LDL-C, and ApoB were 1.48 (95% CI, 1.25–1.76; ptrend<0.001), 1.26 (95% CI, 1.06–1.50; ptrend=0.013), and 1.35 (95% CI, 1.12–1.63; ptrend=0.004), respectively. However, in the multivariable-adjusted model, the associations between the markers of lipid metabolism and the occurrence of any adenoma remained significant only for triglycerides (Q2, Q3, and Q4 vs. Q1; adjusted HRs=1.02, 1.13, and 1.19; ptrend=0.041).
In contrast, the risk of the occurrence of an advanced adenoma did not show a significant relationship with any of the markers of lipid metabolism.
DISCUSSION
This large-scale, longitudinal study evaluated the associations between the parameters of glucose and lipid metabolism and adenoma occurrence detected during surveillance colonoscopy. We found that the levels of parameters of glucose and lipid metabolism at the time of the initial colonoscopy were significantly associated with adenoma occurrence detected during the surveillance colonoscopy. The occurrence of adenomas increased with increasing levels of all the parameters of glucose metabolism (including fasting glucose, HbA1c, insulin, and HOMA-IR) and triglycerides. These associations persisted after adjusting for confounding risk factors for adenomas. In addition, increasing levels of LDL-C and ApoB were significantly associated with an increasing occurrence of adenomas, although the associations were not statistically significant in the multivariate analysis.
The incidence of CRC is rapidly increasing because of the spread of a Westernized diet and lifestyle, especially in Asian countries.27 Interest in identifying potentially modifiable risk factors has kept pace with the increase in the incidence of CRC. As part of these efforts, many recent studies have reported that diabetes, metabolic syndrome, dyslipidemia, and obesity are associated with an increased risk of CRN.456 Furthermore, several studies have evaluated the associations between the parameters of glucose and lipid metabolism and CRN risk in more detail, and researchers have reported that a high fasting glucose level,89 HbA1c,92829 insulin level,81030 HOMA-IR,91130 triglyceride level,56143132 total cholesterol level,12 and LDL-C level,15 and a low HDL-C level615 are associated with an increased risk of colorectal adenomas. Our previous study showed similar results.17 However, all of these studies were cross-sectional investigations that evaluated the association between the prevalence of CRN and the parameters of glucose and lipid metabolism. To date, there have been no studies evaluating the associations between these parameters and the occurrence of metachronous adenomas, which led us to investigate whether these parameters influence the occurrence of adenomas detected during surveillance colonoscopy.
We speculated that the parameters of glucose and lipid metabolism may affect the occurrence of adenomas detected during surveillance colonoscopy based on the results of recent studies carried out on the associations between metabolic factors and the occurrence of metachronous adenomas. Some studies demonstrated that the metabolic syndrome was a risk factor for developing metachronous adenomas at surveillance colonoscopy,212224 while other studies showed that obesity,18192024 increased fasting glucose,18 and hypertension23 were associated with an increased risk of adenoma recurrence. As expected, our study showed that all of the parameters of glucose metabolism and some parameters of lipid metabolism influenced the occurrence of metachronous adenomas.
The pathophysiological mechanisms linking altered glucose metabolism, dyslipidemia, and CRN risk have several possible explanations: hyperinsulinemia can promote carcinogenesis through the effect of insulin-like growth factor-1, and dyslipidemia can increase the production of inflammatory cytokines such as interleukin-6 and tumor necrosis factor-α, creating a protumorigenic environment.3334 Hyperglycemia and dyslipidemia can also promote the formation of reactive oxygen species, which can damage DNA and trigger cancer progression.35 Based on these biologic mechanisms, it is reasonable to conclude that altered glucose and lipid metabolism affects the occurrence of adenomas detected during surveillance colonoscopy, as well as adenoma prevalence.
Recently, meta-analyses have demonstrated that the use of metformin and statins is associated with a reduced risk of CRC3637 and several studies also revealed that metformin and statins reduced the risk of adenoma.383940 Furthermore, a previous study reported a potential benefit of metformin use for lowering the risk of subsequent adenomas after polypectomy.41 These results suggest that improving glucose and lipid levels through the administration of metformin and statins might be helpful in reducing the risk of CRN. In this study, we tried to analyze the risks of adenoma occurrence according to the changes in the levels of the parameters of glucose and lipid metabolism to identify whether worsening levels increased the occurrence of metachronous adenomas or improving levels reduced the occurrence of metachronous adenoma. However, we found no association between changes in the levels of all these parameters and the occurrence of adenoma. One of the reasons may be that the follow-up interval (mean 2.2 years) was too short to evaluate the impact of changes in the parameters on the occurrence of adenomas. Future longitudinal studies are warranted to clarify whether interventions to improve the parameters of glucose and lipid metabolism (such as diet control, exercise, weight reduction, or medication use) can reduce the development of metachronous adenomas.
Our study has a few limitations. First, the great majority of the study subjects were male and younger than 50 years old. Moreover, this was a retrospective study that included participants who underwent a colonoscopy at two centers in Korea. As a result, there was likely some degree of selection bias. Therefore, interpretation of our findings requires careful consideration when applied to other setting or populations. Second, the follow-up interval is too short to evaluate the risk for occurrence of adenomas, especially advanced adenomas. The reason why the parameters of glucose and lipid metabolism did not have a significant impact on the occurrence of advanced adenomas might be the short follow-up interval. In addition, some percentage of the adenomas found at the time of surveillance colonoscopy might have been missed during the initial colonoscopy. Third, we did not investigate withdrawal time that is important in complete colonoscopy although our medical examination center makes it a rule to withdrawal 6 minutes or more. Finally, dietary factors, physical activity, and medications such as metformin, which could all affect the occurrence of adenomas, were not considered.
In conclusion, higher levels of fasting glucose, HbA1c, insulin, HOMA-IR, and triglycerides at initial colonoscopy were associated with an increased occurrence of adenomas detected by surveillance colonoscopy. Improving the parameters of glucose and lipid metabolism through lifestyle changes or medications may be helpful in decreasing the development of metachronous adenomas.
 XML Download