

 PDF
PDF ePub
ePub Citation
 Print
Print


INTRODUCTION
Adipose tissue biology plays an important role in defining the mechanisms related to the pathophysiology of metabolic diseases, such as obesity, hypertension, metabolic syndrome, and type 2 diabetes.12 White adipose tissue synthesizes and releases various anti-inflammatory and pro-inflammatory cytokines known as adipokines.34 Adiponectin and leptin are two important adipokines in the regulation of energy homeostasis. Adiponectin is the most abundant adipokine and is recognized as a key regulator of insulin sensitivity, tissue inflammation, and endothelial function.56 Previous studies have reported that low serum levels of adiponectin are associated with risk of obesity, type 2 diabetes, and metabolic syndrome.78 Leptin is another key regulator of food intake and energy expenditure.9 High levels of circulatory leptin are known to be associated with insulin resistance, obesity, and metabolic syndrome.1011
Since adiponectin and leptin have opposite effects on glucose and fat metabolism, the ratio of serum leptin to adiponectin (L/A ratio) has been proposed as a better marker for insulin resistance than leptin or adiponectin alone.1213 The L/A ratio has also been evaluated as a potential atherogenic index in obese diabetic patients.14 However, little information is available about the ability of L/A ratio to predict improvement of metabolic components in high-risk individuals with metabolic syndrome.
Accordingly, we investigated the prospective association between L/A ratio and the regression of metabolic syndrome and its components in individuals with metabolic syndrome. Furthermore, we analyzed the predictive ability of L/A ratio for the regression of metabolic syndrome, beyond that of adiponectin alone.
MATERIALS AND METHODS
Study population
We analyzed study data from the Korean Genome and Epidemiology Study on Atherosclerosis Risk of Rural Areas in the Korean General Population (KoGES-ARIRANG), a community-based prospective cohort study that was primarily designed to estimate the prevalence, incidence, and risk factors for cardiovascular and metabolic diseases, such as hypertension, diabetes, dyslipidemia, and metabolic syndrome.8 The study design and protocol were approved by the Institutional Review Board of Wonju Severance Christian Hospital. All study participants provided written informed consent prior to the commencement of the study.
Baseline data were collected for 5178 adults (2127 men and 3051 women) aged 40 to 70 years from November 2005 to January 2008. The first follow-up survey conducted from April 2008 to January 2011 involved 3862 subjects. We excluded 2317 subjects without metabolic syndrome at baseline, 190 without baseline adiponectin measurement, 334 without baseline leptin measurement, and four with incomplete data. Finally, 1017 individuals (431 men and 586 women) with metabolic syndrome at baseline were included in the analysis (Supplementary Fig. 1, only online).
Measurement of anthropometric and biochemical characteristics
Standardized questionnaires related to medical history and life-style factors were collected at baseline and on follow-up examination. Body weights and heights were measured with subjects wearing light indoor clothing without shoes. Waist circumference was measured in a horizontal plane midway between the inferior margin of the ribs and the superior border of the iliac crest using a tape measure (SECA 200; SECA, Hamburg, Germany). Systolic and diastolic blood pressures were measured twice in the right arm at a 5-minute interval at least using a mercury sphygmomanometer (Baumanometer, Copiague, NY, USA). The mean of two blood pressure readings was used for analysis. Smoking, alcohol drinking, and regular exercise habits were determined by self-reported questionnaires according to a procedure described elsewhere.8
A venous blood sample was collected from study subjects after fasting for ≥12 hours. Serum levels of adiponectin and leptin were analyzed by radioimmunoassay (LINCO Research Inc., St. Charles, MO, USA). The intra-assay and inter-assay coefficients of variation for serum adiponectin and leptin levels ranged from 2.9% to 6.6% and 3.0% to 6.2%, respectively. The fasting serum glucose and insulin levels were determined by a glucose oxidase-based assay and double-antibody radioimmunoassay. The intra-assay and inter-assay coefficients of variation for serum insulin ranged from 2.1% to 8.3%. High-sensitivity C-reactive protein (hs-CRP) was measured using the Denka Seiken (Tokyo, Japan) assay. Serum levels of high-density lipoprotein (HDL) cholesterol and triglycerides were determined by enzymatic methods (Advia 1650, Siemens, Tarrytown, NY, USA). Insulin resistance was calculated using the homeostasis model assessment of insulin resistance (HOMA-IR) method with the following formula: fasting insulin (µIU/mL)×fasting blood glucose (mg/dL)/405.15
Definition of metabolic syndrome
We diagnosed metabolic syndrome according to a harmonized definition16 as the presence of at least three of the following risk factors: 1) waist circumference ≥90 cm for men or ≥85 cm for women (using cut-offs established by the Korean Society of Obesity);17 2) serum HDL cholesterol level <40 mg/dL for men or <50 mg/dL for women; 3) serum triglyceride level ≥150 mg/dL; 4) systolic blood pressure ≥130 mm Hg, or diastolic blood pressure ≥85 mm Hg, or treatment with antihypertensives; and 5) fasting serum glucose level ≥100 mg/dL or previously diagnosed type 2 diabetes.
Statistical analysis
The data are expressed as frequencies with percentage, means with standard deviation or median with interquartile range. All statistical analyses were performed separately for men and women because women have higher levels of adiponectin and leptin, compared to men. We stratified the study population into sex-specific tertiles of L/A ratio, with cut-off points of 0.391 and 0.748 mg/g for men and 0.813 and 1.501 mg/g for women. The independent effects of L/A ratio on regression of metabolic syndrome were analyzed through multivariable logistic regression models. The study used four models with a gradual degree of adjustment. First, we conducted an age-adjusted analysis. Second, we adjusted for age, smoking, alcohol intake, and regular exercise. Third, we additionally adjusted model 2 with baseline body mass index, hs-CRP and HOMA-IR. Fourth, we additionally adjusted model 3 with changes in body weight between baseline and follow-up. The odd ratios with 95% confidence interval (CI) were calculated according to increasing tertiles of L/A ratio. We also calculated the individual contributions of L/A ratio and serum adiponectin for predicting regression of metabolic syndrome. Area under the receiver operating characteristics curve (AUROC) analyses were used to compare the predictive powers of serum levels of leptin, adiponectin, and L/A ratio for regression of metabolic syndrome. Statistical significance was considered at p<0.05 for all comparisons. All statistical analyses were performed using SAS, version 9.3 (SAS Institute, Cary, NC, USA).
RESULTS
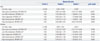
During a mean (range) follow-up of 2.8 (1.5–4.9) years, metabolic syndrome disappeared in 142 men (32.9%) and 196 women (33.4%). The baseline characteristics of the study subjects are shown in Table 1 according to the presence and absence of metabolic syndrome on follow-up. In both men and women, waist circumference, body mass index, levels of fasting serum glucose and serum leptin, HOMA-IR, and L/A ratio were significantly lower in subjects with regression of metabolic syndrome than in those with persistent metabolic syndrome. In women, systolic blood pressure, serum triglyceride, and hs-CRP levels were significantly lower and adiponectin level was significantly higher in subjects with regression of metabolic syndrome, compared to those with persistent metabolic syndrome. Men who regressed from metabolic syndrome exhibited higher levels of serum HDL cholesterol than those with persistent metabolic syndrome. Prevalence of diabetes was higher in subjects with persistent metabolic syndrome than in those with regression of metabolic syndrome. Prevalence of hypertension, smoking, alcohol drinking, and regular exercise were not significantly different between subjects with persistent metabolic syndrome and those with regression of metabolic syndrome. The majority of subjects with regression metabolic syndrome at follow-up had three components of metabolic syndrome at baseline (73.9% of men and 79.1% of women), whereas more than a half of subjects with persistent metabolic syndrome had four or five components of metabolic syndrome at baseline (51.6% of men and 54.9% of women). The baseline characteristics of study subjects according to tertiles of L/A ratio are shown in Supplementary Table 1 (only online).
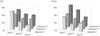
Fig. 1 shows the proportion of individuals who experienced regression of metabolic syndrome according to baseline leptin and adiponectin tertiles. The proportions of regression of metabolic syndrome in the highest tertile of leptin and the lowest tertile of adiponectin were 17.6 % in men and 22.2% in women, respectively. Proportions of regression of metabolic syndrome in the lowest tertile of leptin and the highest tertile of adiponectin were 46.8 % in men and 62.8% in women, respectively.
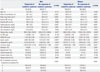
Table 2 shows the odds ratios for regression of metabolic syndrome according to tertiles of baseline L/A ratio. In men, after adjustment for several confounding factors, such as age, smoking, alcohol consumption, regular exercise, baseline body mass index, hs-CRP level, HOMA-IR, and changes in body weight, the odds ratio for the regression of metabolic syndrome in the lowest tertile of L/A ratio was 1.84 (95% CI 1.02–3.31), compared to the highest tertile of L/A ratio (p for trend=0.036). In women, after multivariable adjustment, the odds ratio for the regression of metabolic syndrome in the lowest tertile of L/A ratio was 2.32 (95% CI 1.37–3.91), compared to the highest tertile of L/A ratio (p for trend=0.002).
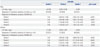
Table 3 shows the odds ratios for regression of each metabolic syndrome component according to baseline L/A ratios. In men, the corresponding odds ratios (95% CI) for disappearance of high waist circumference, low HDL cholesterol, high triglyceride, high blood pressure, and high blood glucose level were 4.23 (1.81–9.88), 1.28 (0.67–2.42), 1.72 (0.96–3.06), 1.15 (0.67–1.98), and 3.63 (1.50–8.76), respectively, in the lowest compared to the highest tertile of L/A ratio. Low L/A ratios were significantly associated with improvement of waist circumference and blood glucose level in men. In women, the corresponding odds ratios (95% CI) for disappearance of high waist circumference, low HDL cholesterol and high triglyceride levels, high blood pressure, and high blood glucose level were 2.31 (1.01–5.28), 1.50 (0.80–2.82), 1.41 (0.76–2.59), 1.49 (0.86–2.59), and 1.33 (0.52–3.41), respectively, in the lowest compared to the highest tertile of L/A ratio. Low L/A ratios were significantly associated with improvement of waist circumference in women.
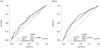
Fig. 2 shows the comparison of the predictive powers of serum levels of leptin, adiponectin, and L/A ratio for regression of metabolic syndrome. In both sexes, L/A ratio had a higher predictive power than serum adiponectin for regression of metabolic syndrome (AUROC of L/A ratio vs. adiponectin, 0.613 vs. 0.558, p=0.024 for men; 0.662 vs. 0.616, p=0.019 for women). L/A ratio also showed a higher predictive power than serum leptin for regression of metabolic syndrome in women (AUROC of L/A ratio vs. leptin, 0.662 vs. 0.630, p=0.047 for women).
Further, we assessed the prospective association between baseline L/A ratio and development of metabolic syndrome in 1610 subjects without metabolic syndrome at baseline (Supplementary Table 2, only online). A higher L/A ratio was associated with an increased risk of developing metabolic syndrome in both men and women (p for trend=0.029 in men; p for trend <0.036 in women).
DISCUSSION
This is the first study to report the impact of L/A ratio on the regression of metabolic syndrome in high-risk individuals. The L/A ratio showed an inverse association with the regression of metabolic syndrome and had a higher predictive power than serum adiponectin for regression of metabolic syndrome in both men and women.
Metabolic syndrome is a constellation of several cardiovascular risk factors, which is a growing public health concern.18 Several biomarkers have been proposed for early detection of metabolic syndrome. The two adipokines, leptin and adiponectin, were suggested as being associated with risk of metabolic syndrome in different ethnic populations.101920 Several studies have proposed L/A ratio to be a better marker for the prevalence of metabolic syndrome than leptin or adiponectin alone.1321 A cross-sectional study conducted in a Chinese population reported that L/A ratio exhibits higher AUROC than adiponectin levels for predicting the prevalence of metabolic syndrome.22 Furthermore, our prospective findings additionally suggest that L/A ratio is a useful predictor for the regression of metabolic syndrome in high-risk individuals.
In the current study, low L/A ratio was associated with the regression of metabolic syndrome. Low leptin and high adiponectin levels could provide protection against the development of metabolic disorders.810 These findings have been explained by the pro-inflammatory effects of leptin and anti-inflammatory effects of adiponectin.3 Both leptin and adiponectin regulate nitric oxide production in endothelial cells and affect the renin-angiotensin-aldosterone system.23242526 In addition, leptin activates the sympathetic nervous system and causes chronic elevations in blood pressure.27 Leptin, serving as a cofactor of TGF-beta activation, also promotes vascular endothelial cell proliferation.28
Leptin and adiponectin levels are closely associated with amounts of body fat. Excess adiposity is associated with up-regulation of leptin production and down-regulation of adiponectin production, contributing to insulin resistance and metabolic disorders, such as type 2 diabetes, hypertension, and dyslipidemia.10293031 Leptin levels have been reported to be proportional to body adiposity and to be high in obese individuals.32 Adiponectin levels are known to be negatively associated with intra-abdominal fat mass and to be positively associated with insulin sensitivity.33 These are in accordance with our findings, showing low L/A ratio as a predictor for improvement of waist circumference.
Another important finding of the present study was that low L/A ratio was associated with improvement of fasting blood glucose in men. This finding is in line with previous studies reporting sex-based differences, in which higher leptin levels predict development of diabetes mellitus in men but not in women.3435 In women, the leptin levels are higher than those in men because of the higher proportion of adipose tissue and elevated production rate of leptin per unit mass of adipose tissue in women.36 Sex-based differences in adiponectin levels have also been reported, and it has been hypothesized that androgens inhibit secretion of adiponectin, resulting in lower levels of adiponectin in men.37 Furthermore, sex-based differences in fat distribution may play a role in pathophysiology of leptin and adiponectin secreted from adipocytes, as women have more subcutaneous fat than men.38 Further studies are needed to understand sex-based differences in the association of L/A ratio with regression of metabolic syndrome components.
Several limitations of this study should be considered. First, we measured total adiponectin levels to calculate the L/A ratio, but not high molecular weight adiponectin. Several reports have suggested that high molecular weight adiponectin is the active form of adiponectin.39 Further work is required to investigate the role of leptin and the high molecular weight adiponectin ratio in metabolic syndrome. Second, our analyses were based on a single measurement of serum leptin and adiponectin, which may be a source of random error. Third, the present study was limited to middle-aged and older individuals living in rural areas of Korea. Thus, our findings may not be generalizable to other populations. Fourth, we have not considered treatment with antihypercholesterolemic drug in metabolic syndrome criteria of HDL and triglyceride, because medication history on hypercholesterolemia was not scrutinized in detail.
In conclusion, low L/A ratio was found to be independently associated with regression of metabolic syndrome. Furthermore, L/A ratio provided significant adjunctive information of use in predicting the regression of metabolic syndrome beyond adiponectin alone. These findings suggest that the L/A ratio could be a useful clinical marker for management of high-risk individuals with metabolic syndrome.
 XML Download