

 PDF
PDF ePub
ePub Citation
 Print
Print


INTRODUCTION
South Korea is presently experiencing rapid economic, social, and cultural changes, including an accelerated pace of nutrition transition that may result in a greatly increased burden of chronic diseases, such as obesity.1 Obesity causes many serious medical illnesses that impair the quality of life and often leads to increased morbidity and mortality.2 Many prospective studies have shown that visceral fat leads to insulin resistance and is associated closely with hypertension and dyslipidemia, which enhance atherosclerosis.345 Subjects with type 2 diabetes mellitus (T2DM) are especially at high risk for cardiovascular diseases (CVD) and visceral obesity. Therefore, early and proper estimates of visceral adiposity and atherosclerotic disease risks are very important in T2DM subjects.
Chemerin, a recently discovered adipocytokine, is hypothesized to be associated with glucose and lipid metabolism, obesity-induced insulin resistance and metabolic complications.678 In addition, serum chemerin levels reportedly correlate with body mass index (BMI), waist circumference (WC) and amount of visceral fat in the general population.6910 Currently, a positive correlation has been shown between abdominal visceral fat and serum chemerin levels in type 2 diabetic subjects with the average six years of duration.11 However, the relationship between serum chemerin levels and visceral fat amount in subjects with newly diagnosed type 2 diabetes has not yet been well studied, and this relationship may be different from those under medication. Therefore, we determined whether serum chemerin levels are associated with visceral adiposity in newly diagnosed T2DM subjects in South Korea.
MATERIALS AND METHODS
Study subjects
Among the patients who visited the outpatient department of Endocrinology and Metabolism at Hallym University Sacred Heart Hospital from March 2009 to May 2010, 102 newly diagnosed, consecutive T2DM subjects were enrolled in this study. The exclusion criteria were type 1 diabetes, history of clinical coronary artery disease or cerebral or peripheral vascular disease, renal dysfunction (defined as a creatinine level ≥2 mg/dL), hepatic dysfunction (defined as alanine aminotransferase and/or aspartate aminotransferase blood levels ≥3-fold the upper normal limit), use of glucocorticoids, pregnancy, severe diseases such as cancer, infection, Cushing's syndrome, acromegaly or any other disorder likely to alter glycemia, primary hypercholesterolemia, hypothyroidism or hyperthyroidism, use of any hormonal medications, alcoholism or drug abuse. Hypertension was defined as a systolic blood pressure of at least 140 mm Hg and/or a diastolic blood pressure of at least 90 mm Hg, use of antihypertensive drugs, or a combination of these parameters. Dyslipidemia was defined as a low-density lipoprotein cholesterol (LDL-C) level ≥100 mg/dL or a high-density lipoprotein cholesterol (HDL-C) level <40 mg/dL for males or <50 mg/dL for females or the use of lipid-lowering drugs. The protocol was approved by the Ethics Committee of the Hallym University Sacred Heart Hospital, and informed written consent was obtained from each subject.
Anthropometric, blood pressure and biochemical measurements
Height and weight were measured in each subject wearing light clothing and without shoes. WC was determined at the midpoint between the lower ribs and the iliac crest. BMI was calculated by dividing weight by height squared (kg/m2). Blood samples were collected from subjects after more than 10 h of fasting. HbA1c was determined using high-performance liquid chromatography (Variant II; Bio-Rad, Hercules, CA, USA). Plasma glucose levels were measured immediately after sampling using an auto-analyzer and the hexokinase method (Hitachi 747; Roche, Montclair, NJ, USA). Serum insulin levels were determined using the INS-IRMA Kit (BioSource Europe S.A., Nevelles, Belgium), and serum total cholesterol and HDL-C were measured using a direct enzymatic method (Hitachi 747; Daiichi, Tokyo, Japan). Serum triglyceride levels were measured using an enzymatic colorimetric method (Hitachi 747; Roche, Tokyo, Japan/Mannheim, Germany), and LDL-C was calculated using the Friedewald formula. Insulin resistance was estimated after fasting using the homeostasis model assessment of insulin resistance (HOMA-IR): HOMA-IR=fasting insulin (µU/mL)×fasting plasma glucose (mmol/L)/22.5. High-sensitivity C-reactive protein (hs-CRP) was measured using a latex-enhanced immunoturbidimetric method (TBA-120FR, Toshiba, Tokyo, Japan). Chemerin levels were measured using an enzyme immunoassay kit (Mesdia, Seoul, Korea) with intra-assay and inter-assay coefficients of 8.5% and 7.4% variance, respectively.
Visceral fat thickness (VFT)
To assess visceral adiposity, ultrasonography (US) was performed using a 3.5-MHz convex probe (LOGIQ 7, GE, Milwaukee, WI, USA) with the subjects in the supine position. The procedures were conducted after subjects fasted at least 4 h. To measure visceral fat thickness (VFT), transverse scanning was performed 1 cm above the umbilicus. The probe was placed as lightly as possible to the skin to avoid disfiguring the abdominal cavity. Images were collected immediately after expiration to reduce the influence of the respiration. VFT was defined as the distance between the anterior aortic wall and the internal face of the rectus abdominis muscle vertical to the aorta. Intra-observational coefficient of variation was 1.5–2.0%.
Statistics
Continuous variables were reported as means±standard deviation. Independent t-tests and chi-square tests were used for comparisons between males and females where appropriate. The relationships between serum chemerin levels and clinical and biochemical parameters were examined using the Pearson correlation and partial correlation analyses. Three models examining the association between serum chemerin levels and clinical and biochemical parameters were used under different adjustment schemes. Inclusion of adjustments in the partial correlation analyses removed their possible contribution to serum chemerin levels. The first model was adjusted for age and gender. The second model was adjusted for BMI in addition to age and gender, and the third model was adjusted for WC in addition to age, gender, and BMI. To determine the predictable factors of the serum chemerin levels, a multiple linear regression analysis was performed. We selected all of the variables which showed a potential association (p<0.20) with serum chemerin levels in the Pearson's correlation analysis. According to previous studies, we additionally entered blood pressure values related to serum chemerin levels.6,8,10 Variables that were not normally distributed, such as triglycerides and hs-CRP, were log transformed to better approximate normal distributions. We calculated the sample size for α=0.05 and a global power 1-β=0.8. The minimal sample size required was 56 for the Pearson's correlation coefficient (r)=0.37, which derived from previous research.10 The PASW version 18.0 software (IBM Co., Armonk, NY, USA) was used for the statistical analyses. A p-value <0.05 was considered to indicate statistical significance.
RESULTS
Clinical and biochemical characteristics of the subjects
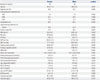
Table 1 shows the clinical characteristics of the 102 study subjects [49 females (48.0%) and 53 males (52.0%)], with an average age of approximately 50 years for both genders. BMI (25.4 kg/m2 in females; 25.8 kg/m2 in males) and WC (87.8 cm in females; 92.9 cm in males) were slightly over the reported obesity diagnostic criteria for South Koreans.1213 The proportions of active smokers were 12.2% in females and 28.3% in males. WC, VFT and creatinine levels were significantly higher in males than females. However, no significant differences were observed in age, BMI, blood pressures, insulin, C-peptide, HOMA-IR, HbA1c, fasting and postprandial glucose, cholesterol profiles, hs-CRP (log-transformed), blood urea nitrogen and chemerin levels between females and males.
Relationships between serum chemerin levels and clinical and biochemical parameters
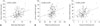
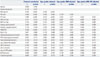
Serum chemerin levels showed significant positive correlations with BMI, WC, VFT, fasting insulin levels, HOMA-IR, and levels of triglycerides (log-transformed) and hs-CRP, while showing significant negative correlations with HDL-C (Fig. 1). After adjusting for age and gender, serum chemerin levels showed significant positive correlations with BMI, WC, VFT, levels of triglyceride (log-transformed) and hs-CRP, while showing significant negative correlations with HDL-C. After adjusting for age, gender and BMI, only VFT showed a significant relationship to serum chemerin levels. Although weakened after additionally adjusting for WC, this relationship remained statistically significant (Table 2).
Multiple linear regression analysis for predictors of serum chemerin levels
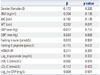
Multiple linear regression analysis was performed to evaluate factors that influence serum chemerin levels. Only VFT was an independent predictive factor for serum chemerin levels (β=0.242, p= 0.041) (Table 3), while BMI, WC, and metabolic syndrome components were not.
DISCUSSION
In the present study, we demonstrated that serum chemerin levels were significantly associated with obesity, especially visceral adipose tissue, in newly diagnosed T2DM subjects. Moreover, after adjusting for BMI and WC, VFT had a significant relationship with serum chemerin levels and was the only determinant.
Our results are consistent with previous studies reporting that chemerin is significantly associated with BMI, WC, and various metabolic syndrome components.6910 Moreover, in a study conducted in the group without diabetes, chemerin levels were correlated positively with the amount of abdominal visceral fat.10 In the study by Weigert, et al.,14 chemerin was elevated in T2DM subjects with higher CRP levels (>5 ng/mL) and positively correlated with CRP in normal weight, overweight and T2DM subjects after adjusting for BMI and WC. The authors proposed that systemic chemerin levels are related to inflammation rather than obesity in T2DM subjects. However, there are some differences between Weigert's study and our study. Firstly, only about 40% (n=44) were T2DM subjects in their study. In addition, the subjects in their study exhibited several clinical characteristics different from our study subjects including the following: T2DM for an average of 5 years versus our newly diagnosed subjects; a mean age approximately 10 years greater than that of our subjects; and very high CRP level (4.0 mg/L) in their T2DM subjects versus a mean level of 1.59 mg/L and a moderate state in our study.15 Chemerin was associated with the amount of visceral fat after adjusting for age, gender and BMI in the general population, suggesting visceral fat as the major site for chemerin secretion.10 Specifically, in our study, visceral fat had a significant positive correlation with serum chemerin levels after adjusting for WC, indicating that chemerin levels are dependent on visceral fat rather than subcutaneous fat in T2DM subjects, similar to the subjects without diabetes.10
Recently, Han, et al.11 suggested that serum chemerin levels are significantly associated with the amount of abdominal visceral fat in Korean subjects with T2DM. However, our study exclusively included newly diagnosed T2DM subjects. Even though latent period before the diagnosis varied, we could rule out the possibility of medication effect because newly diagnosed T2DM patients were not taking anti-diabetic medications. Chemerin is one of the target gene for PPAR gamma and use of pioglitazone or metformin can decrease serum chemerin concentration1617 Moreover, diabetes patients with nephropathy show decreased ability of chemerin degradation, so that it might affect serum chemerin level, as well.18 In Han, et al.11 study, the study population had 6 years of average duration of diabetes, the stage 2 chronic kidney disease state and higher albumin-creatinine ratio (45.1 µg/mg). In this regard, therefore, our study which was designed for newly diagnosed T2DM patients has enough novelty. Chemerin promotes chemotaxis of dendritic cells and macrophages to the site of inflammation, and its receptor is expressed by tissue macrophages.19 Moreover, serum chemerin levels correlate with the levels of proinflammatory cytokines such as tumor necrosis factor-α, interleukin-6 and CRP.20 These observations suggest that chemerin may play a role in the development of inflammatory diseases. In our study, serum chemerin levels correlated positively with hs-CRP, a circulating marker of inflammation.
Many human data support a relationship between chemerin, obesity and metabolic syndrome.21 In the present study, we found that serum chemerin levels were significantly associated with several key components of metabolic syndrome. These findings suggest that chemerin plays a role in metabolic syndrome and is an independent adipokine marker of metabolic syndrome.22
Although not statistically significant, many researchers have reported a positive relationship between chemerin and blood pressure.10232425 However, several studies have been carried out on the relationship between blood pressure and chemerin in T2DM subjects: weak positive correlations between blood pressure and chemerin in T2DM subjects with hypertension, renal dysfunction and coronary artery disease.81826 The effect of chemerin on blood pressure may be related to its high expression levels in the kidneys and kininogen, a proteolytic product of the vasoactive peptide bradykinin; however, the exact mechanism is unclear.15 In our study, there was no significant relationship between blood pressure and serum chemerin levels. This discrepancy may be due to the differences in study populations; for example, the subjects who participated in our study had lower cardiovascular risks than those in other studies.
It should be mentioned that VFT measurement using US may not necessarily be accurate for measuring visceral fat in some selected groups.2728 Usually, abdominal computed tomography (CT) or magnetic resonance imaging (MRI) are considered the gold standard methods for the assessment of visceral fat.29 However, radiation exposure for CT and cost-effectiveness for MRI are limitations of those methods. Instead, US is an accurate, cost-effective, noninvasive and reproducible method to measure the accumulation of visceral fat.30 The amount measured of visceral fat by US is closely related to an increased risk of CVD.31 Moreover, the amount measured by using US has been reported to have a similar accuracy compared to CT.32
There was no association between the amount of subcutaneous fat and chemerin concentrations in a previous study.10 In our study, we did not check subcutaneous fat amount. Our small sample size is an another limitation of our study. The cross-sectional nature of our study limited the determination of cause-effect relationships, and therefore, additional longitudinal studies with larger sample sizes are necessary to confirm our findings. Despite several limitations, our study provides important novel data regarding the relationship between chemerin and visceral adiposity in subjects newly diagnosed with T2DM.
In conclusion, abdominal visceral fat was identified as an independent predictor of serum chemerin levels in subjects newly diagnosed with T2DM. Our findings suggest that chemerin may be a mediator linking visceral obesity and T2DM.
 XML Download