

 PDF
PDF ePub
ePub Citation
 Print
Print


INTRODUCTION
Metabolic syndrome (MS) refers to a cluster of interrelated risk factors that include hypertension, obesity, hyperglycemia, and dyslipidemia.1 Evidence suggests that MS can increase the risks for cardiovascular disease, type 2 diabetes, and all-cause mortality.23 At present, there are approximately 1/3 adults in the United States4 and 1/5 adults in China5 with MS. with the increasing prevalence of sedentary behavior6 and obesity,7 the prevalence of MS will continue to increase. The prevention and treatment of MS had become urgent.
Serum alanine aminotransferase (ALT) is a marker of liver injury and is commonly used to identify non-alcoholic fatty liver disease, which is considered as a hepatic component of MS.8 The relationship between ALT and MS was studied by a number of researchers.910 Some epidemiological studies suggested that elevated ALT levels can increase the risk of MS and its related diseases, such as cardiovascular disease and diabetes.89 On the other hand, Janičko, et al.10 showed that people with elevated ALT are not at an increased risk of MS and its components, compared with people with normal ALT. The upper normal limit of serum ALT level is set on 40 U/L on average, ranging from 30–50 U/L, which is used to discriminate people with diseased liver from general people.11 However, there are some people with nonalcoholic fatty liver disease or/and MS, whose ALT levels are still within the reference interval.10 Several studies have reported that elevation of ALT level within the reference interval is associated with a higher prevalence of MS;1213 however the association between ALT and MS might differ by ethnicity and gender.1415 Little is known, meanwhile, of the detailed dose-response relationship of ALT levels within the reference interval and MS in different genders. Studies to test whether a linear dose-response relationship or a threshold effect is present are warranted.
Accordingly, we conducted logistic regression analyses and restricted cubic spline models to evaluate the association of ALT levels within the reference interval with MS and dose-response relationships in different genders to provide some evidence for prevention and control of MS.
MATERIALS AND METHODS
Study population
Subjects for this study were selected from who attended routine health check-ups at the Health Management Center of Shengli Oilfield Central Hospital in Dongying City, located in eastern China, from January 2006 to March 2012. A total of 16621 subjects who met all the following conditions were included in our study: 1) aged 18 years or more; 2) serum ALT levels in the reference interval (≤40 U/L); and 3) clinical data on measurements of ALT level and related indicators to diagnose MS. If a person attended two or more health check-ups during the 6 years, we used the latest health examination data in this cross-sectional study.
Subjects were excluded from analysis if they had a positive test for hepatitis B virus surface antigen or hepatitis C virus antibody. Those with a history of virus hepatitis, liver cirrhosis, liver carcinoma, or autoimmune liver disease were also excluded from this study. Additionally, we further excluded people with serious disease, such as renal failure, heart failure, and malignancy. Finally, 16028 people (6372 women and 9656 men) were included in our study. This study was approved by the Ethics Committee of School of Public Health, Shandong University, and informed oral consent was obtained from each participant.
Measurements
All subjects underwent a standardized interview, anthropometric measurements, and blood biochemical analysis. The standardized interview obtained information on age, medical history, and lifestyle behaviors (including smoking and drinking). The medical history included diseases of hypertension, diabetes, liver disease, and cancer. Smoking was defined as smoking any tobacco product continuously or cumulatively for more than 6 months during their lifetime and at least once within the past 30 days.16 Drinking was defined as consumption of any kind of alcohol beverage averagely once a week, but excluding occasionally drinking during festivals.17
The anthropometric measurements evaluated weight, height, body mass index (BMI), and blood pressure. Height and weight were measured on subjects with light clothing and no shoes. BMI was calculated by dividing weight (kg) by the height (m) squared. Blood pressure was measured twice from the right arm by a calibrated mercury sphygmomanometer after at least 5 minutes of rest in a comfortable sitting position.
Blood samples were collected under at least 12 hours fasting conditions. Blood biochemical tests to determined serum levels of ALT, fasting blood-glucose (FPG), triglyceride (TG), total cholesterol (T-CH), high density lipoprotein cholesterol (HDL-C), serum creatinine (Cr), uric acid (UA), and total bilirubin (TBIL) were performed using an automatic analyzer (Hitachi 7170; Hitachi, Tokyo, Japan). White blood cell counts (WBC) were measured by a CELL-DYN 3700 SL analyzer (Abbott Diagnostics, Chicago, IL, USA). In addition, hepatitis B virus surface antigen and hepatitis C virus antibody were tested by the enzyme-linked immunosorbent assay (ELISA).
Definition of metabolic syndrome
In this study, MS was defined according to the criteria proposed by China Diabetes Society (CDS).18 The criteria for MS were three or more of the following risk factors: 1) overweight or obesity, BMI ≥25.0 kg/m2; 2) hypertension, systolic blood pressure (SBP) ≥140 mm Hg, or diastolic blood pressure (DBP) ≥90 mm Hg, or previous diagnosis of hypertension; 3) dyslipidemia, TG ≥1.7 mmol/L, or low HDL-C (<0.9 mmol/L in men, <1.0 mmol/L in women); 4) hyperglycemia, FPG ≥6.1 mmol/L (110 mg/dL), or 2 h post-meal glucose (PG) ≥7.8 mmol/L (140 mg/dL), or previous diagnosis with hyperglycemia.
Statistical analysis
Data are presented as means±standard deviation (SD) for normally distributed continuous variables and as proportions for categorical variables. According to variable distributions using histograms, skewed variables are expressed as medians (interquartile range). To compare differences in general characteristics between the quartiles of ALT, One-Way Analysis of Variance or Kruskal-Wills H test was used for continuous variables, and Pearson χ2 test was used for categorical variables. Linear regression analysis was used to test for trend across the four groups of ALT levels. Logistic regression analyses were used to compute the odds ratios (OR) for MS and its components in higher quartiles, compared with the lowest quartile of ALT levels. Considering biological mechanisms and the habits of statistical analysis, regular analysis variables and variables with p less than 0.10 in univariate analysis were entered into the multiple analysis. The dose-response relationship between ALT and MS was explored by restricted cubic spline analyses with 5 knots at percentiles 5%, 25%, 50%, 75%, and 95% of the distribution, and percentile 25% was the reference ALT level.19 Restricted cubic spline analyses were performed by SAS 9.3 (SAS Institute, Cary, NC, USA)19 and all other statistical analyses were conducted using SPSS 18.0 (SPSS Inc., Chicago, IL, USA). Two-sided p<0.05 was considered statically significant.
RESULTS
General characteristics
This study included 16028 subjects, with 6372 females and 9656 males, aged 18–85 years old. The prevalence of MS in the total population was 13.7% (6.4% for females and 18.4% for males).
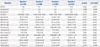
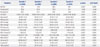
Compared with females, males had higher levels of ALT and a higher prevalence of MS (p<0.001). The general characteristics of participants stratified by ALT quartiles in different genders are presented in Table 1 and Table 2. Subjects in the higher ALT quartile groups tended to have higher levels of diagnostic indexes of MS in both genders, except for HDL-C which decreased with increasing ALT level.
Risk of MS and its components by ALT
Table 3 and Table 4 list results of logistic regression analyses for the presence of MS and its components in relation to the quartiles of ALT level in different genders. Higher ALT level was associated with higher prevalence of MS and its three components (hypertension overweight/obesity and dyslipidemia) in both sexes. The OR of MS increased to 4.830 for women and 3.168 for men in the highest quartile, compared with the ALT levels in the lowest quartile, after adjustment for multiple confounders. However, the risk of hyperglycemia was positively associated with ALT level in women, but not in men.
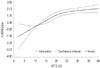
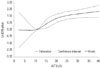
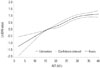
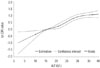
Dose-response association between ALT and MS
Restricted cubic spline analyses, with/without adjustment for the same variables in multiple logistic regression analyses, indicated a positive dose-response relationship between the risk of MS and ALT level in women and men, and all tests for overall association were significant. The estimated shapes of the associations are shown (Figs. 1, 2, 3, 4). In univariate analyses, a non-linear relationship of the risk of MS with ALT level was found in both genders (p for nonlinearity was less than 0.0001 in women and 0.0072 in men). In multivariable analyses, the relationship between the risk of MS and ALT level was nonlinear in women (p for nonlinearity=0.0327), but linear in men (p for nonlinearity=0.0659).
DISCUSSION
In this study, we conducted a cross-sectional study to explore the relationship between ALT levels within the reference interval (<40U/L) and MS in a large-scale adult Chinese population. We found a positive relationship between ALT levels within the reference interval and the prevalence of MS and most of its components in both sexes, after adjustment for potentially confounders. The OR of MS monotonously increased with increasing levels of ALT in both genders, although the relationship had several differences in women and men.
ALT is a specific liver enzyme and a marker of liver damage, restricted to the cytoplasm of hepatocytes.9 A few studies of Korean12 and Israeli populations13 found that increased ALT levels within the reference interval are associated with an increased risk of MS. The present study in Chinese adults is in accordance with these articles. Compared with ALT levels in the lowest quartile, the OR of MS in the highest ALT groups increased to 4.830 and 3.168 in women and men, respectively. Our study supports that elevated ALT level even within the reference interval can increase the risk of MS.
Different from previous studies, this paper analyzed the dose-response relationship between ALT levels within the reference interval and MS in different genders. This study found that elevated ALT levels among the reference interval are positively and monotonously associated with an increased risk of MS in both genders. The detail dose-response curve was positive and linear in men, but positive and non-linear in women. The reason for the difference is not clear. Menopause status may be an explanation. Polotsky reported that the incidence of MS increases markedly during perimenopause and early menopause. Metabolic changes are associated with menopausal transition.20 Lacking information on menopausal status in our study, we stress that this speculation needs confirmation in future research.
Additionally, our results revealed that the relationship of ALT with MS, hypertension, and hyperglycemia was stronger in women than in men. Liu, et al.15 also reported that women are more susceptive to the occurrence of MS to the same degree with elevation of ALT. Murphy, et al.21 have shown that, compared with boys, girls are 33% more insulin resistant, which is closely related to ALT and MS. These findings suggest that women are inherently more prone to insulin resistance, because impaired glucose homeostasis has been related to X-chromosomal loci.2122
The mechanism underlying the association between MS and ALT has not been fully clarified. Kim, et al.11 indicated that non-alcoholic fatty liver disease may be the most probable explanation for the relationship. Unexplained ALT elevation commonly is caused by non-alcoholic fatty liver disease.23 Meanwhile, non-alcoholic fatty liver disease, which is associated with insulin resistance and obesity, is commonly considered as the hepatic component of MS.2425 However, Sookoian and Pirola26 argued that glutamine-cycling pathway may be involved in the development of MS. ALT is an important enzyme in this cycling. Researchers have speculated that abnormal ALT levels might reflect the risk of MS before the liver becomes fatty. Insulin resistance may be another mechanism. Recent studies have indicated that insulin resistance, a major risk factor of MS, was associated with ALT.27 In addition, by inflammation and oxidative stress, elevated ALT levels also contribute to the development of MS.2829
Assay for ALT is simple, cheap, sensitive, and specific for liver injury. The current upper normal limit of ALT level is 40U/L.30 However, several studies have shown that there are many people with MS and non-alcoholic fatty liver disease in current reference interval of ALT level, and proposed reducing of the upper limit of normal.1031 Prati and colleagues recommended that the revised upper normal limits of ALT levels should be 19 U/L for women and 30 U/L for men.32 Updating the upper limit could help improve the identification of subjects with subclinical liver disease and at high risk of developing some metabolic diseases, such as MS. However, several researchers suggested that reducing the upper limit of ALT levels may increase the healthcare expenditures and even cause undue stress.33 Our results indicate that the risk of MS increases with increasing ALT levels within the reference interval. Thus, elevated ALT level, even in the reference interval, may reflect early dysmetabolic changes and greater risk of MS.
We used CDS criteria to diagnose MS instead of international criteria in our study. Compared to Americans and Europeans, Chinese people have their own body shape characteristics. Th-erefore, Chinese diabetes society developed CDS criteria that has been widely applied in other research.534 A previous study has reported that CDS criteria and IDF criteria are in good accordance.35 Meanwhile, considering the fact that our database lacks waist circumference information, CDS criteria might make our estimation more precise. Although there may be a slight difference by using different criteria to diagnose MS, the difference would hardly change the noted dose-response trends in the relationship between ALT and MS.
There are some limitations in this study. First, the participants of our study were enrolled from a hospital for routine health check-ups who mainly work in enterprises, institutions, factories, and for government. Therefore, there is a question as to whether the present findings could be applicable to other groups of people, such as farmers. Second, we had no detailed data on alcohol consumption, and thus, we could not exclude alcohol abusers. However, ALT levels among alcohol abusers are usually higher than 40 U/L, and our subjects only included ALT levels in the reference interval. Therefore, the influence of alcohol abusers would be limited. Finally, this study was a cross-sectional study, and could not delineate the temporal association of ALT with MS or identify a causal relationship. Prospective research and clinical trials are needed to validate the present results in the future.
In conclusion, we found a positive dose-response relationship between ALT levels within the reference interval and the risk of MS in both genders. Elevated ALT levels, even within the reference interval, may reflect early dysmetabolic changes and a greater risk for MS.


 XML Download