

 PDF
PDF ePub
ePub Citation
 Print
Print


INTRODUCTION
Pleural fluid can accumulate in the pleural cavity surrounding the lungs. This can be caused by pneumonia, tuberculosis, and many types of malignancies, including lung cancer, when the rate of fluid formation exceeds the rate of fluid removal.1 In countries where tuberculosis is endemic, distinguishing between malignant and tuberculous pleural effusion can be challenging. Tuberculosis remains a major health problem worldwide, leading to 1.8 million deaths annually.2 Tuberculous pleural effusions are the second most common form of extra-pulmonary tuberculosis, with tuberculous lymphadenitis ranking the most common form. Diagnosis of a tuberculous pleural effusion can be made by a positive culture study or the presence of tuberculous-specific pathologic findings. Lung cancer is the most common fatal cancer. Its prevalence is increasing in Korea. It is the leading cause of cancer mortality in many co-untries.345 Therefore, differentiating malignant and tuberculous pleural effusions and developing novel diagnostic tests suitable for use in resource-poor countries are urgently needed. Moreover, diagnosis using existing adenosine deaminase (ADA) levels, cell differentiation, and tumor markers is limited. Therefore, a method that can distinguish these two diseases easily by only collecting pleural fluid without histological examination is needed.
Exudative pleural effusion contains high protein concentrations. These proteins can be analyzed using proteomic methods. Two-dimensional (2D) gel electrophoresis is a well established technique to simultaneously separate hundreds of thousands of proteins.6 Fluorescent 2D differential in-gel electrophoresis (DIGE) allows for multiplex analysis of proteomes on the same gel. Protein extracts under comparison are covalently labeled with different fluorescent CyDyes™ (N-hydroxy succinimidyl ester derivatives of Cy2, Cy3, and Cy5). Fluorescent image of the gel at wavelength specific for each CyDye™ can be directly overlaid using DeCyder Differential In-gel Analysis (DIA) software (Amersham, Uppsala, Sweden) to identify any differentially expressed proteins between samples.
The objective of the present study was to identify differentially expressed proteins between tuberculous and malignant pleural effusions. Two-sample t-test was used to identify significant changes in protein expression between the two different pleural effusions. Proteins found to be differentially expressed were identified by matrix assisted laser desorption/ionization-time of flight-mass spectrometry (MALDI-TOF-MS) mass fingerprinting.
MATERIALS AND METHODS
Patient samples
Detailed patient information is shown in Table 1. Informed consent was obtained from all patients. The diagnosis of lung cancer and tuberculosis was established by two different pathologists. From these patients, pleural fluid samples were obtained. Enrollment criteria for mailignant and tuberculous pleurisy groups were defined as patients with confirmed pathologic diagnosis based on pleural biopsy. Transudative pleural effusion group was defined as a patient with a transudative pleural effusion without any specific finding on histologic examination after meeting the criteria for trasudate based on Light's criteria. Patients with any disease that might affect the diagnosis and outcome of each group were excluded. None of the non-cancer subjects showed any signs of lung cancer in 18 months following sample acquisition. Thereby, these subjects were not subjects with asymptomatic lung cancer. To improve reproducibility, all malignant pleural effusions were caused by advanced lung adenocarcinoma. The effusion sample was centrifuged at 800 g for 10 min at 4℃ and the supernatant was stored in aliquots. Pleural fluid samples were kept at -80℃ and transported on dry ice. This study was approved by Clinical Research Ethics Committee of Hallym University Chuncheon Sacred Hospital (IRB No. 2012-27).
Protein preparation
Total protein was precipitated from each sample using a Clean-UP Kit (Amersham Biosciences, Uppsala, Sweden). Briefly, 100 µL of pleural fluid was mixed with 300 µL of precipitant and incubated on ice for 15 min. After adding 300 µL of co-precipitant to the mixture, the sample was centrifuged at 8000 g for 10 min. The pellet was re-suspended in 500 µL of co-precipitant and centrifuged again at 8000 g for 5 min. The remaining pellet was centrifuged again at 8000 g for another 10 min to obtain the final protein pellet.
Precipitated proteins were prepared for fluorescence (CyDye; Amersham Bioscience) labeling before proceeding to two-dimensional gel electrophoresis (2-DE). For CyDye labeling, 1 mM stock of each dye was diluted 1:5 with anhydrous dimethyl formamide right before labeling reaction. Approximately 50 µg of each protein extract (in 4 µL) was mixed with 1 µL of Cy2, Cy3, or Cy5. Precipitated proteins were re-suspended in a solution containing 4% CHAPS {3-[(3-cholamidopropyl) diethylammo-nio]-1-propane sulphonate}, 30 mM Tris-HCL (pH 8.0), and 7 M urea. They were then labeled with fluorescent cyanine dyes for fluorescent gel electrophoresis (Amersham Biosciences) according to the manufacturer's protocol. Briefly, protein (50 µg) was labeled with 1 µL of amine-reactive cyanine dye (400 pmoL · µL-1) freshly dissolved in anhydrous dimethyl formamide. The labeling reaction was incubated at 4℃ for 15 min in the dark. The reaction was then terminated by adding 10 nmoL lysine. Immobiline DryStrip rehydration buffer (7 M urea, 2 M thiourea, 2 mg · mL-1 dithiothreitol and 1% pharmalytes) was added to the reaction to reach final volume of 350 µL prior to isoelectric focusing (IEF).
CyDye labeling
Equal protein loading was performed for transudative, tuberculous, and malignant pleural effusions (300 µg total protein, 100 µg from each sample). They were resolved between pH 4 and pH 7. For simplicity, the following procedures were performed. Aliquot of 100 µg of protein from each sample (transudative, tuberculous, and malignant pleural effusions) was individually precipitated at room temperature with methanol and chloroform.7 Precipitates were solubilized in lysis buffer (7 M urea, 2 M thiourea, 4% CHAPS, 30 mM Tris, 5 mM magnesium acetate) prior to labeling with 200 pmoL of either Cy3 for tuberculous effusion, Cy5 for malignant effusion, or Cy2 for standard transudative effusion. Labeling was performed on ice for 30 min in the dark, after which the reaction was quenched by adding 400 µL of 10 mM lysine, followed by incubation on ice for 10 min in the dark. Quenched Cy3- and Cy5- labeled samples from each patient (100 µg each) were then mixed with 100 µg of quenched Cy2-labeled sample (standard control), after which an equal volume of 2X rehydration buffer (7 M urea, 2 M thiourea, 4% CHAPS, 4 mg/mL DTT) supplemented with 0.5% IPG buffer (pH 4–7) was added. Stoichiometry of Cy-dye labeling was purposefully low to ensure equal labeling of the same protein from each extract.8
Analytical 2-D gel electrophoresis
The mixed CyDye™-labeled protein extract was used to identify proteins expressed differently in transudative, tuberculous, and malignant pleural effusions. Protein components of each sample were subjected to 2-DE. This was performed by IEF in the first direction using 18-cm pH 3–10 and pH 4–7 Immobiline DryStrip (IPGphor; Amersham Biosciences) and sodium dodecylsulphage (SDS)-polyacrylamide gel electrophoresis (SDS-PAGE) in the second direction (Ettan DALTsix Large Vertical System; Amersham Biosciences). IEF was performed at 200 V for 200 Vh, 500 V for 500 Vh, 1000 V for 1000 Vh, and 8000 V for 60000 Vh at 20℃. After IEF, strips were subjected to two-step equilibration in buffers containing 6 M urea, 2% weight (w)/volume (v) SDS, 30% w/v glycerol, and 50 mM Tris-HCL (pH 8.8) with 1% w/v dithiothreitol for the first step and 2.5% w/v iodoacetamide for the second step. These strips were then subjected to SDS-PAGE [1.0 mm thick, 12% T, where T was the combined percentage (w/v) of acrylamide and bisacrylamide] at 17 W · gel-1 for 4 h at 15℃. Samples used for differential gel electrophoresis were labeled with CyDyes first before proceeding to 2-DE. IPG strips were then sealed with 0.5% agarose in SDS running buffer at the top of slab gels (280×210×1 mm) polymerized with 12% w/v acrylamide and 0.1% N,N'-methylenebisacrylamide. Gels were poured between low fluorescent Pyrex glass plates to minimize background fluorescence during scanning. The 2D electrophoresis was performed at 20℃ in Ettan Dalt II tanks (Amersham Biosciences) at 13 W for 20 h.
Image acquisition and analysis of two-dimensional electrophoresis gels
Cy2-, Cy3-, and Cy5- labeled protein images were produced by scanning gels directly between glass plates using filters specific for each dye's excitation and emission wavelength with 2920 2D Master Imager (Amersham Biosciences). Excitation wavelengths for Cy2, Cy3, and Cy5 were 480±35 nm, 540±25 nm, and 620±30 nm, respectively. Emission wavelengths for Cy2, Cy3, and Cy5 were 530±30 nm, 590±35 nm, and 680±30 nm, respectively. Images were exported in the form of 16-bit tagged image file format (.tiff) files for analysis. The density of each protein spot on the scanned image represented the level of protein expression. Quantification of spot density was performed using a specific image analyzer.
After acquisition, images were merged and analyzed using DeCyder Batch Processor and DIA software modules (Amersham Biosciences). Batch Processor was used to analyze up to 50 pairs of gel images. On individual gels, Cy2-labeled images (from pooled standard) were compared to either Cy3 (Cy2:Cy3) or Cy5 (Cy2:Cy5) images. Images from separate gels were compared using BVA module of the DeCyder software to match gels using Cy2-labeled standard on each gel to normalize images. Fluorescent intensity of each spot was digitalized and converted into a three-dimensional image, allowing both quantitative and visual comparison of different spots. To identify these spots, separate preparative gels containing 300 mg of each extract were run. They were then stained with Sypro Ruby. All 10 protein spots matched CyDye™ labeled images using Melanie III software (SIB, Geneva, Swiss) (data not shown).
In-gel digestion
In order to identify proteins of interest, protein spots showing differential expression were removed and digested into peptides by proteases. Briefly, protein spots on 2-DE were excised from the gel manually and cut into pieces. Each gel piece was dehydrated independently in acetonitrile for 10 min, vacuum dried, rehydrated in 55 mM dithioerythreitol in 25 mM ammonium bicarbonate (pH 8.5) for 1 h at 37℃, and then alkylated with 100 mM iodoacetamide in 25 mM ammonium bicarbonate (pH 8.5) for 1 h at room temperature. These pieces were then washed twice (15 min each time) in 50% acetonitrile in 25 mM ammonium bicarbonate (pH 8.5), dehydrated in acetonitrile for 5 min, dried, and rehydrated in a total of 100 ng sequencing-grade modified typsin (Promega, Madision, WI, USA) in 25 mM ammonium bicarbonate (pH 8.5) at 37℃ for 16 h. Following digestion, each sample of tryptic peptides was extracted with 50% acetonitrile containing 5% formic acid for 15 min with moderate sonication. For optimal extraction, the procedure was repeated once more and the extracted solution was pooled and evaporated to dry under vacuum. For MALDI-TOF-MS analysis, dry peptide samples were redissolved in 0.1% trifluoroacetic acid and purified on a C18 Zip-Tip (Milipore, Bedford, MA, USA) according to the manufacture's instruction.
Protein mass fingerprinting analysis of protein spots and sequence database search
Final protein recognition and confirmation were performed by matching peptides identified by MALDI-TOF-MS. Sequences of eluted peptides were first identified by subjecting samples to MALDI-TOF-MS analysis. Briefly, tryptic peptides from 2-DE protein spots were subjected to protein mass fingerprinting using a MALDI-TOF-MS operated in the positive ion reflectron mode. Samples were spotted into a 96-well MALDI target plate using a saturated matrix solution of α-cyano-4-hydroxycinnamic acid in 50% acetonitrile/1% trifluoroacetic acid. Mass spectra were acquired at mass range of 800 to 3000 Da and automatically processed with Mascot search engine for protein mass fingerprinting against the Swiss-Prot database. Ion masses were submitted to NCBI nr database using Mascot ions search for mass matching and verification of protein identity. Identification of a protein based on MS/MS analysis of one peptide was considered sufficient if the Mascot score was above the significance level. Positive identification of proteins required at least five matching peptide masses with ≥50 parts per million mass accuracy.
Direct high-precision analysis for protein identification and sequence database search
If any protein identified by MALDI-TOF-MS appeared to show potential for further study, it was subjected to reconfirmation using a higher-precision method employing nano-liquid chromatography (LC) combined with nano-electrospray ionization tandem MS (LC-MS/MS), as described in a previous study.9 Briefly, LC-MS/MS analyses were performed using an integrated LC-MS/MS system (Micromass, Manchester, UK). After data acquisition, individual MS/MS spectra acquired for each precursor within a single LC run were output as a single Mascot-searchable peak list (.pkl) file. These peak list files were used to query the Swiss-Prot database using the Mascot program (http://www.matrixscience.co.uk) in the NCBI database. Only significant hits defined by Mascot probability analysis were initially considered.
Statistical analysis
Using Cy2 labeled samples as internal standards, the same dataset was analyzed to determine Cy2:Cy3, Cy2:Cy5 abundance changes for each sample. To determine whether differentially expressed proteins could be markers, 95th percentile confidence levels were used to determine significant protein abundance changes. Two-sample t-test was used to determine statistical significance (p<0.05). SPSS software version 23.0 (IBM Corp, Armonk, NY, USA) was used for all statistical analyses.
RESULTS
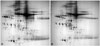
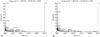
Laboratory characteristics of the three types of pleural effusions are shown in Table 1. Protein expression was compared between tuberculous and malignant effusions utilizing DIGE technology using transudative effusion samples as internal controls.1011 After 2-DE, Cy2, Cy3, and Cy5 channels were individually imaged using mutually exclusive excitation and emission wavelengths, and these images were analyzed. Protein profiles of effusion samples were analyzed by 2-DE with a pH range of 3 to 10 for greater protein separation. Cy2 (transudative effusion), Cy3 (tuberculous effusions), and Cy5 (malignant effusions) spot maps shown here are representative of spot maps for patients. Using DIGE techniques with transudative effusion samples as internal controls, 28 protein spot-features were identified from over 1000 features to have abundance changes across samples. Sixteen of these spots were up regulated, while 12 were down regulated in malignant pleural effusion samples, compared to those in tuberculous pleural effusion samples. Representative 2-DE image of proteins from tuberculous and malignant samples are shown in Fig. 1. In gels stained with Sypro Ruby, 28 spots were identified by MS. All 28 protein spots matched CyDye™ labeled images. Of these 28 spots targeted for further analysis, 10 were found to have consistent changes in other samples with statistical difference in spot volume ratio within the 95th percentile (two-sample t-test, p<0.05). By comparing 2-DE gel protein profiles of tuberculous and malignant effusions, 10 protein spots were to have significant changes in expression (Table 2). These 10 protein spots were excised and subjected to in-gel digestion with trypsin followed by MALDI-TOF-MS analysis. Examples of MALDI-TOF-MS acquired for target proteins identified by DIGE analysis are shown in Fig. 2. Target proteins were excised from the gel and subjected to in-gel digestion with trypsin protease as described earlier. Peptide mass mapping using MALDI-TOF-MS is an extremely powerful approach to provide accurate mass determination of peptide molecular irons from individual trypsin digests. Such protein identification method often leads to sta-tistically significant and unambiguous matches. In addition, this technique does not require additional amino acid sequence information from tandem MS.
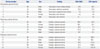
These 10 proteins were identified as trasthyretin, haptoglobin, metastasis-associated protein (MTA)1, t-complex protein 1, fibroblast growth factor-binding protein 1, human ceruloplasmin, lysozyme precursor, gelsolin, Clusterin (complement lysis inhibitor), and peroxirexdoxin 3 (Table 2). Locations of these 10 differentially expressed protein spots were marked with numbers in one representative gel. Examples of MALDI-TOF-MS acquired for proteins targeted in the analysis are shown in Fig. 2.
In this study, 2D DIGE was used to simultaneously screen paired tuberculous pleurisy and malignant pleural effusion in 10 patients to analyze protein abundance changes. As an internal control, transudate pleural effusion from five patients was used. Protein identification for these differentially expressed proteins was then performed by MS and database interrogation.
Trasthyretin, haptoglobin, MTA1, t-complex protein 1, and fibroblast growth factor-binding protein 1 were identified among 10 differentially expressed proteins identified in this study. They were upregulated in malignant pleural effusions. Human ceruloplasmin, lysozyme precursor, gelsolin, Clusterin (complement lysis inhibitor), and peroxirexdoxin 3 were the other five differentially expressed proteins identified in this study. They were upregulated several times or more higher in tuberculous pleural effusions. These results suggest that highly expressed proteins in malignant pleural effusion are associated with carcinogenesis and cell growth, while proteins highly expressed in tuberculous pleural effusion are associated with response to inflammation and fibrosis.
These findings will aid in the development of novel diagnostic tools for tuberculous pleurisy and malignant pleural effusion of lung cancer. They also provide new insight into diverse functions of proteins in tuberculosis and cancer pathogenesis.
DISCUSSION
In the diagnosis of pleural effusion, sometimes it is difficult to distinguish between tuberculous pleural effusion and malignant pleural effusion. For most cases, differential diagnosis is easy. However, for some cases, it is impossible to distinguish the two using pleural fluid cell differentiation, levels of ADA, or tumor markers. When histological examination cannot make a definitive diagnosis, it is very challenging for physicians.
The high mortality rate of lung cancer is related to difficulties in early detection and inadequate treatment strategies. The dismal prognosis of lung cancer is partly attributable to late diagnoses and limitations of currently-available therapies. Despite recent improvements in bronchoscopic and surgical techniques, as well as advances in chemotherapy, radiation, and targeted therapies, attempts to improve patient outcomes are facing immense challenges. Only low-dose chest computed tomography has been shown to be able to reduce lung cancer-specific mortality.12 For advanced stage non-small-cell lung cancer, the development of targeted therapies such as tyrosine kinase inhibitors, has led to improved outcomes for patients whose cancers bear EGFR mutations1314 or ALK rearrangements.15 Despite recent advances in lung cancer treatment, patients with lung cancer are often misdiagnosed with pulmonary tuberculosis, leading to a delay in correct treatment and exposure to inappropriate medication.16 The present study showed that 2D DIGE is a robust method to identify statistically significant differences in protein abundance between patient samples. It has the benefit of being able to run multiple samples simultaneously, including a simultaneous run for internal control. Although one might expect that global proteomic analysis would demonstrate many novel or distinct proteins in malignant pleural effusions, compared to those in tuberculous pleural effusion, the present study only found increased expression in malignant effusions for five major spots. They were identified as transthyretin (TTR), ha-ptoglobin, MTA1, t-complex protein 1, and fibroblast growth factor-binding protein 1 (FGFBP1). In a previous proteomic analysis using LC-MS, 44 proteins were identified from 242 spots as up regulated in pleural effusions secondary to lung cancer.17
Pooling equal aliquots of all benign transudative pleural fluid samples in this study produced the internal standard. This pooled standard was covalently labeled with Cy2 and run together with individual experimental samples (tuberculous and malignant pleural effusions) labeled with Cy3 and Cy5, respectively. Direct Cy3/Cy5 comparison of samples identified 10 spots within the 95th-percent confidence level with two standard deviations for mean Cy3:Cy5 ratio in samples. With redundancy due to post-translational modification and proteolysis, these 10 spots accounted for all individual proteins identified in the cross-patient experiment. Given that this preliminary study was performed on a homogeneous patient group with adenocarcinoma, our findings might not be completely generalizable to general patient populations.
This study has limitations, including a small number of patients and characteristics of malignant pleural effusion. However, proteomic study requires a lot of research funding. This was one reason for such a small sample size. Another limitation of this study was all malignant pleural effusions were composed of adenocarcinoma to increase reproducibility. Therefore, our study might not present all kinds of malignant pleural effusions.
Regarding proteins upregulated in malignant pleural effusions, TTR is synthesized mainly in the liver. Its low levels have been reported in cases of severe liver disease, malnutrition, and acute inflammation. It has been shown that TTR in lung cancer sera is correlated with clinical stage.18 It is higher in late stages, compared to that in localized stages, of lung cancer.18 Haptoglobin is an acute phase plasma glycoprotein that can bind to free hemoglobin and prevent oxidative stress.19 Increased am-ounts of haptoglobin in blood plasma have been observed in infection, inflammation, and various malignant diseases, including lung cancer.20 Upregulation of MTA1 is closely associated with carcinogenesis and progression of a wide range of cancers, including advanced lung cancer.21222324 T-complex protein 1 is a 16 subunit complex composed of two back-to-back stacked rings, each enclosing a substrate binding site. Each ring contains eight different subunits. It is known to be involved in cell growth.2526 FGFBP1 plays a critical role in cell proliferation, differentiation, and migration by binding to fibroblast growth factor. Recently it has been shown that FGFBP1 is associated with tuberculosis.27
Regarding proteins upregulated in tuberculous pleural effusion,human ceruloplasmin has been reported to be upregulated in patients with active pulmonary tuberculosis.28 Lysozyme is responsible for breaking down polysaccharide walls of many kinds of bacteria. It provides some protection against infection. Therefore, these bacteriostatic proteins might be up regulated in response to tuberculous pleurisy. Gelsolin is necessary for the development of modeled pulmonary inflammation and fibrosis.29 Clusterin is a molecular chaperone responsible for aiding protein folding of secreted proteins. It has been implicated in pro- and/or anti-apoptotic processes. Peroxiredoxin 3 is a mitochondrial member of antioxidant family of thioredoxin peroxidases.30
2D DIGE is the method of choice for widespread protein profiling studies because of its multiplexing capability. Its ability to incorporate an internal standard for linking protein spot information contained on separate gels within and across studies is also an advantage. However, this study has certain limitations. Further research should incorporate methods such as western blot and ELISA to determine the amount of differently expressed proteins. In addition, the relativitly low sensitivity for protein detection by gel limits the detection of low-content proteins that occupy a large proportions in a particular proteome. In addition, proteins with high molecular weight and extremely acidic or alkaline proteins can be lost in electrophoresis. Therefore, proteins separated by 2-DE are not all inclusive. Moreover, the 2-D DIGE method itself is a labor-intensive technique with high technical requirements, making it difficult to automate. Thus, comprehensive proteome research faces challenges in obtaining enough information for all proteins for analysis.

 XML Download