

 PDF
PDF ePub
ePub Citation
 Print
Print


INTRODUCTION
Lung cancer is the leading cause of cancer related death worldwide. In Korea, it accounted for 22.8% of all cancer deaths in 2014.1 Although the smoking rate in Korea has lowered, the prevalence of lung cancer is increasing and is anticipated to increase over the next decade.2 Lung cancers have recently displayed major shifts in the frequencies of histological types, with steady increases in adenocarcinomas and decreases in squamous cell carcinomas.1 Studies have suggested that changes in tobacco blends and air pollution might be related to these shifts.345 However, few studies have examined air pollution exposure and risk of lung cancer according to histological subtypes.67
Previous studies have proved that tobacco use is the major cause of lung cancer.8 However, relatively high rates of lung cancer have also been observed among non-smokers and never smokers.910 Therefore, studies have suggested that other factors, such as occupational exposures to carcinogens (radon, arsenic, asbestos, and heavy metals), environmental tobacco smoke, and lower socioeconomic status, could also contribute to the development of lung cancer.11 In addition, traffic- and heating-related emissions in urban areas have been described as risk factors for lung cancer.12
Several studies have linked ambient air pollutants, including particulate matter with an aerodynamic diameter of less than 10 micrometers (PM10) and nitrogen dioxide (NO2), to lung cancer incidence.7131415161718 A cohort study conducted in nonsmoking California adults (USA) reported that an interquartile range (IQR) increase in mean concentration of PM10 was positively associated with incident lung cancer in males [relative risk (RR)=5.21; 95% confidence interval (CI): 1.94−13.99].14 Findings from individual data from 17 European cohorts showed a positive association between PM10 and risk for lung cancer (hazard ratio=1.22; 95% CI: 1.03−1.45, per 10 µg/m3), suggesting an effect even below 40 µg/m3 for PM10.15 In a case-control study of 2390 lung cancer cases and 3507 population controls in Canada, an odds ratio (OR) of 1.11 (95% CI: 1.00−1.24) was observed for a 10 ppb increase in exposure to NO2.7
Adenocarcinoma is the most common histological subtype of lung cancer; however, studies have reported inconsistencies in the association between air pollution and adenocarcinoma or other histological subtypes. Air pollution has been reported to be more strongly associated with adenocarcinoma in some studies,619 whereas other studies have shown the st-rongest association with other histological subtypes.1020 The inconsistency may be due to differences in exposure assessment or inadequate power for sub-analysis of each histological subtype.21 Also, a high frequency of some subtypes of lung cancer due to a bias in the pathological material may be an issue.22
Although some studies in Asia have reported associations between air pollutants and lung cancer risk,2324 local data on the long-term effects of air pollution on lung cancer to support policy is scare. Further, studies on ambient air pollution and lung cancer risk, particularly risk according to histological subtypes, have not been performed in Korea. We therefore aimed to investigate lung cancer incidence in relation to long-term exposure to PM10 and NO2 via a population-based case-control study.
MATERIALS AND METHODS
Study subjects
This study was conducted as a population-based case-control study, a matched case-control study with a 1:1 ratio, at three university hospitals in Seoul and Incheon, Korea. These hospitals are reference centers for the surrounding catchment health area. From 2014 to 2015, a standard protocol was used to recruit a total of 959 incident cases of histologically confirmed lung cancer. Population controls were selected from a random sample of people who were individually matched to the cases by sex, smoking status, and age (±5 years). Controls were recruited from healthy individuals (no radiotherapy and chemotherapeutic treatment) in the same community as the cases, and 908 controls were individually matched to the cases. Under the assumptions of an effect size of 1.5 and a two-sided alpha level of 0.05 and given a 1:1 comparison, the study had 80% power at a total sample size of 905 cases and 905 controls. Informed consent was obtained from all participants, and the study was approved by the Institutional Review Board of Inha University Hospital (IUHIRB 13-2878).
Exposure assessment
Assessment of air pollution exposure was done based on residential histories, which were geo-coded. We retrieved all addresses of the study participants from 1995 onward. Our database included PM10 and NO2 monitoring data, population count data, road network data, and land use data. The variables were grouped into five categories: 1) land use; 2) physical geography (X and Y coordinates); 3) elevation; 4) roads and traffic (lengths of different road types and traffic flow density within buffers of different radii); and 5) population. We calculated variables at regulatory monitoring sites using one of two metrics: the distance of a feature or a buffer summary statistics (e.g., sum or proportion) of a feature. A buffer indicates that the concentration of air pollution measured at the central point of the buffer is influenced by probable sources at a given distance. The buffer radii for traffic variables were 25, 50, 100, 200, 300, 500, and 1000 m, whereas larger radii of 100, 200, 300, 500, 1000, and 2000 m were applied to non-traffic variables for demographic characteristics and land use categories. For each road, we defined the traffic intensity as the average traffic volume per day, and traffic intensity was estimated from traffic demand models. In addition, traffic load was defined as a function of road length and traffic intensity. Long-term exposure to air pollution were estimated from the residential histories from 1995 to 2014. Various exposure periods were also examined (2010−2014; 1995−2009; and 1995−2004) to check whether more recent exposure to air pollution is important in the development of lung cancer.
Concentrations of PM10 and NO2 at residential addresses of the study participants were estimated by land-use regression (LUR) models following a standardized method that has been described elsewhere.25 In brief, we modeled traffic-related pollutants by LUR using regulatory monitoring networks and used annual means for PM10 and NO2 in 2010. LUR models for PM10 and NO2 were conducted in nine areas (Seoul, Incheon, Busan, Ulsan, Gyeonggi, Chungcheong, Jeolla-Jeju, Daegu-Gyeongbook-Gangwon, and Gyeongnam) and were optimized locally. Measurements of both PM10 and NO2 were conducted at 14−72 urban background monitoring sites per area. For Seoul, the air pollutants were measured at 37 regulatory monitoring sites and used centrally and locally available geographic variables as potential predictors. Supplementary Fig. 1 (only online) shows statistics and scatter plots of observation and cross-validated prediction from the LUR models in Seoul. Five predictor variables were left in the final LUR model for NO2: the length of all roads within 300 m, traffic intensity on the nearest road, total heavy-duty traffic load of all roads within 100 m, urban green area within 300 m, and a variable representing spatial trend. The model adjusted R2 and the leave-one-out-cross-validation (LOOCV) R2 of the NO2 models were 0.79 and 0.73, respectively. For PM10 models, the adjusted R2 and LOOCV R2 were 0.69 and 0.60, respectively.
Outcomes
The primary outcome variable of this study was histologically confirmed lung cancer incidence. We also examined specific histological subtypes of lung cancer, such as adenocarcinoma, squamous cell carcinoma, small cell carcinoma, and large cell carcinoma.
Data collection
Information on potential risk factors for lung cancer was collected personally through questionnaires by trained interviewers. Structured questionnaires collected data on sociodemographic characteristics, residential history, current and past tobacco use, exposure to secondhand smoke (SHS), personal and family history of cancer, occupational history, and frequency of fruit consumption.
Participants were categorized by tobacco consumption into three groups: never smokers, defined as persons who were sm-oking at the time of the interview and had not smoked 100 or more cigarettes in their lifetimes; former smokers, defined as subjects who did not smoke at the time of interview and had smoked at least 100 cigarettes in their lifetime; and current smokers, defined as subjects who met none of these criteria. Exposure to SHS was assessed by the question: “How many days in the past 7 days did someone smoke near you at home or work?” Response options of 0 to 7 days/week were classified into three levels: no exposure (none/week), occasional exposure (1−4 days/week), and regular exposure (5−7 days/week).26
We obtained information on frequency of fruits consumption. Subjects were asked to indicate their usual frequency of consumption of fruits for the last week using the following scale: more than once per day; daily; one to two times per week; three to four times per week; five to six times per week; two or three times per month; once per month; or never. Responses were categorized into three levels: 1−3 times/month, 1−6 times/week, and at least once/day.
We collected information about occupational carcinogens (kind of carcinogen, occupation, industry classification of wo-rking factory, exposure periods, and latent periods) for the measurement of occupational exposure to lung carcinogens. We defined exposure to confirmed or suspected occupational carcinogens as ever regularly exposed (i.e., at least once a week for at least 6 months) to any of these agents: asbestos, polycyclic aromatic hydrocarbons, diesel engine exhaust, crystalline silica, radon, hexavalent chromium, nickel, pesticide, dioxin, welding fume, cadmium, formaldehyde, and arsenic.27 Family history of cancer was classified into three levels; none, first-degree relatives with other types of cancer, and first-degree relatives with lung cancer.
Statistical analyses
Multiple unconditional logistic regression models (backward stepwise method) were used to estimate ORs and 95% CIs in order to assess the possible relationship between lung cancer and air pollution. In our models, we adjusted for matching variables of age (yrs), sex (male vs. female), and smoking status (never, former, and current smoker), as well as for other potential confounding risk factors, such as education (more than high school, high school, and less than high school), exposure to SHS at work and home (never, occasional, and regular), family history of cancer (none, other cancers, and lung cancer), frequency of fruit consumption (1−3 times/month; 1−6 times/week; and at least once/day), and occupational exposure to lung carcinogens (exposed vs. unexposed).
The percentages of missing values within the population for analysis were <10% for the frequency of fruit consumption (9.5%) and <5% for exposure to SHS (1.5%) and education (3.9%). We used multiple imputation to impute missing values for these covariates.28 This method has been suggested as an efficient alternative to analyze missing data in matched case-control studies.29 The results without imputation are presented in the Supplementary Table 1 and 2 (only online) to show the sensitivity of results to imputation.
We further assessed effect modification by a priori variables (smoking status, education, sex, family history of cancer, occupational carcinogens, and fruit consumption) that may modify the relationship between air pollution and lung cancer7913 in stratified analyses and by entering products terms into our logistic regression models. The interaction p values were based on a log likelihood ratio test. In addition, we examined a potential lung cancer risks in populations living within 2 km of hazardous sites using logistic regression.
RESULTS
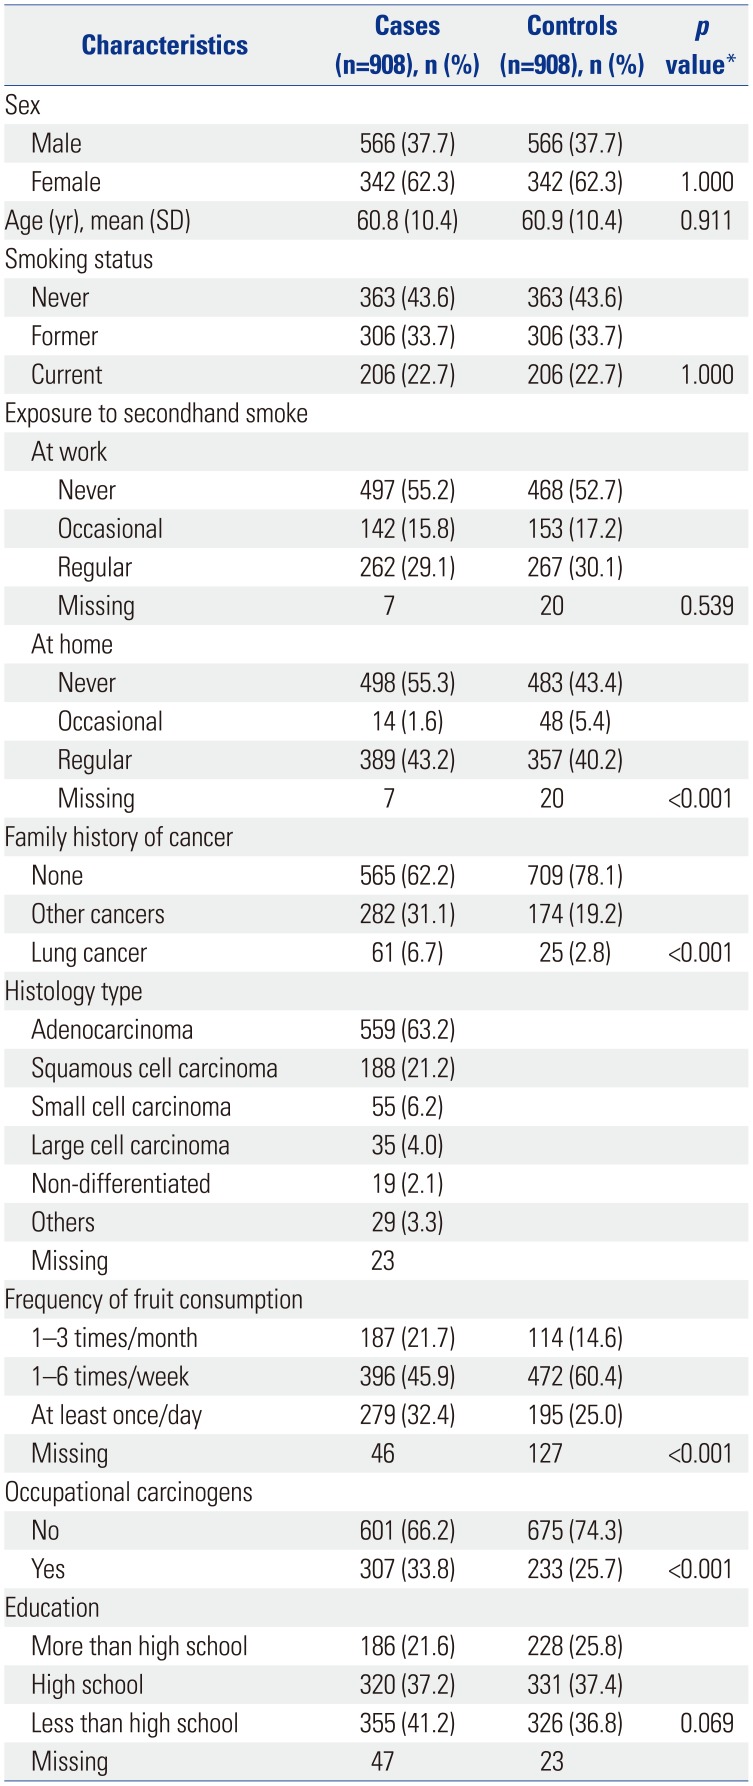
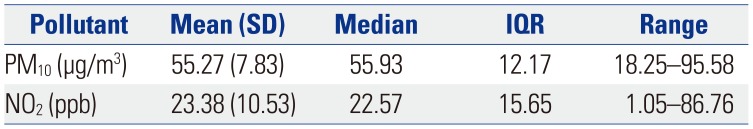
The lung cancer patients included in this study were on average 61 years of age at first symptoms or diagnosis, more were male than female (62−38%), and more than one-fifth were current smokers (23%) (Table 1). About a quarter had a higher level of education and more than half had never been exposed to SHS at work; all of these characteristics were similar between controls and cases. Histologically, adenocarcinoma (63.2%) and squamous cell carcinoma (21.2%) were the main types of lung cancer. Table 2 summarizes study participant air pollution exposures and correlations between pollutants. The estimates of NO2 were moderately correlated with PM10 (r=0.70).
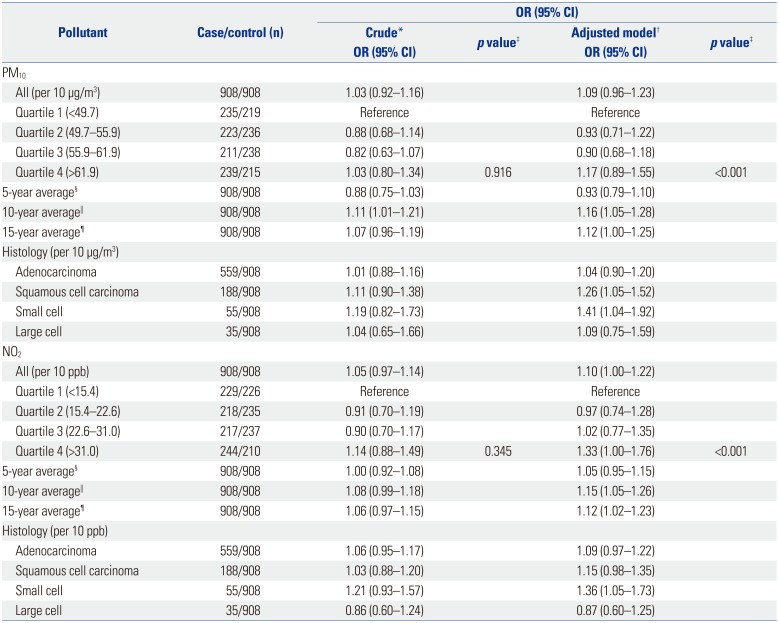
Table 3 shows lung cancer ORs with exposure to PM10 and NO2, based on results obtained from imputed data set. Adjusted for age, sex, smoking, exposure to SHS at home and work, education, exposure to occupational carcinogens, and frequency of fruit intake, the OR for a 10 ppb increase in NO2 was 1.10 (95% CI: 1.00−1.21) and that for a 10 µg/m3 increase in PM10 was 1.09 (95% CI: 0.96−1.23). For NO2, exposure quartiles were elevated relative to the lowest quartile (<15.4 ppb) and showed a dose-response relationship. With a 10-year average, the effects of pollutants appeared stronger than for average exposure over the whole 20-year period. Likewise, compared with the results from imputed data, the associations of NO2 and PM10 exposure with lung cancer were slightly stronger with the results obtained from complete case analyses (OR=1.14, 95% CI: 1.03−1.27 per 10 ppb NO2; OR=1.12, 95% CI: 0.98−1.29 per 10 µg/m3 PM10 ) (Supplementary Table 1, only online).
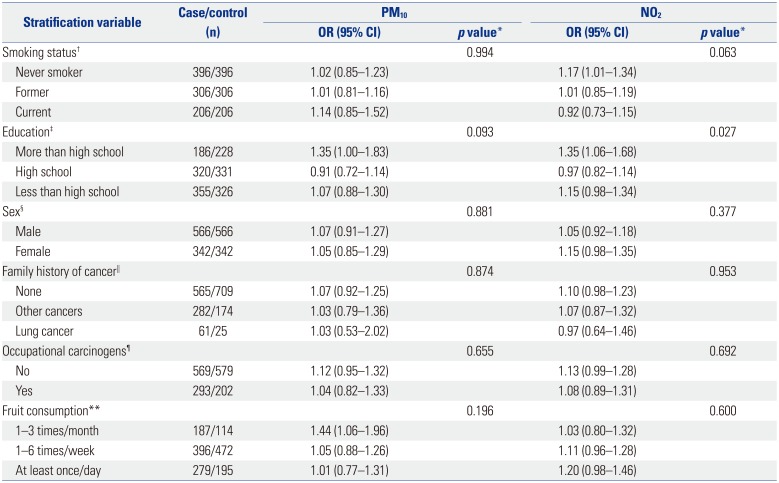
Table 4 presents stratified models for smoking status, education attainment, sex, family history of cancer, exposure to occupational carcinogens, and frequency of fruit consumption, based on results obtained from imputed data set. No consistent patterns of smoking status and either PM10 or NO2 exposure were observed. For PM10, compared with never smokers, larger ORs for lung cancer were observed for current smokers (OR=1.14, 95% CI: 0.85−1.52). However, the NO2 model exhibited a higher and significant OR for never smokers (OR=1.17, 95% CI: 1.01−1.34). For NO2, associations were stronger in subjects with more than high school education than in those with high school education, and the interaction with educational status was significant (p-interaction=0.027). For NO2, point estimates appeared somewhat larger for subjects reporting exposure to carcinogens, compared with those unexposed to any carcinogens, although CIs largely overlapped (p-interaction >0.1). Although the NO2 model indicated higher OR for women (OR=1.15, 95% CI: 0.98−1.35; p=0.084), the level of significance was borderline. The results obtained from data without imputation demonstrated a slightly stronger association of exposure with the outcomes considered in this study (Supplementary Table 2, only online).
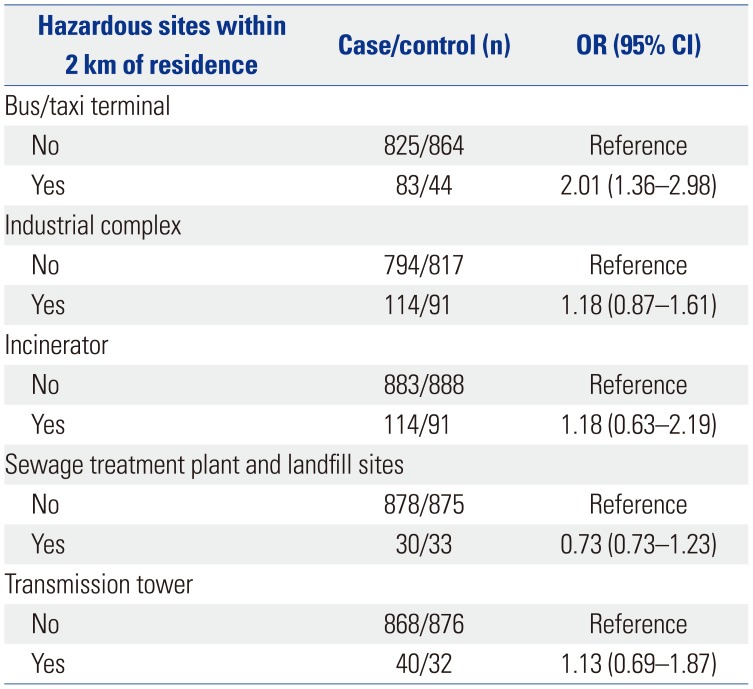
Table 5 summarizes ORs for subjects with residences within 2 km of a hazardous facility. A higher risk was observed among subjects with residences within 2 km of bus/taxi terminals. The ORs were positive for those residing within 2 km of an industrial complex, incinerator, and transmission tower, although the ORs could not exclude the null values.
DISCUSSION
This study highlighted associations between residential exposure to air pollution and risk for lung cancer in a case-control study. The results indicated stronger associations among never-smokers, among participants with higher education, and among those with relatively low consumption of fruits. In addition, the associations were stronger for squamous cell and small cell carcinomas than for adenocarcinoma of the lung.
Our findings are consistent with previous studies showing that ambient air pollution is associated with increased lung cancer risk.715 The present study estimated an OR of 1.10 (95% CI: 1.00−1.22) per 10 ppb of NO2, which is similar to a Canadian study (OR=1.11; 95% CI: 1.00−1.24 per 10 ppb),7 but higher than the estimate from a recent meta-study (OR=1.04; 95% CI: 1.01−1.07).18 Our estimated OR for PM10 (OR=1.16, 95% CI: 1.05−1.28 per 10 µg/m3) is in line with that of a recent study in the European cohorts (HR=1.22, 95% CI: 1.03−1.45 per 10 µg/m3),15 but lower than those in studies in the USA (HR=5.21, 95% CI: 1.94−13.99 per 24 µg/m3 PM10)14 and Germany (HR=1.84, 95% CI: 1.23−2.74 per 7 µg/m3 PM10).30 Some differences in the magnitude of associations across studies may arise from study settings, such as the demographic characteristics of the study population, exposure periods, timing of measurements, magnitude of exposure misclassification, and covariates included in models.
Stronger associations between air pollution and lung cancer in never-smokers have been observed in previous studies.3132 In a cohort study from Norway, the RR per 10 µg/m3 increase in the concentration of nitrogen oxide was 1.20 for never-smokers.32 We found no significant associations for former and current smokers. This might be due to the strong relationship between cigarette smoking and lung cancer incidence, as was also suggested in a previous study.9
In our study, education seemed to modify the association of ambient air pollution with lung cancer incidence, showing lar-ger ORs for lung cancer among participants with more than high school education, compared with those having less than high school education. However, the differences in ORs according to levels of educational were not consistent and were too large to provide significant effect modification. Each case was assigned to one of the three educational strata based on the area of residence. This ecological approach did not take into account the fact that areas are large and socially quite heterogeneous. Therefore, educational status may not have discriminated appropriately the status of each area. This might have reported lower ORs for the less education group. Nevertheless, previous research on effect modification of education has reported inconsistent findings: the Harvard Six-Cities American Cancer Society cohort studies reported an increased risk of cancer from long-term exposure to particulate matter among those with lower educational attainment;13 no compelling evidence of effect modification was found in a study of mortality risk estimates from PM10 and NO2 in Hong Kong33 or in a time-series study from 20 of the largest US cities.34 A study reported a monotonically increasing effect of air pollution with increasing socioeconomic status, which is positively correlated with the level of education.35 This inconsistency among studies is likely due to differences in study design and procedures.
Of the four major histological subtypes of lung cancer, associations with pollutants were stronger for squamous cell and small cell carcinomas than for adenocarcinoma and large cell carcinomas of the lung. This is in line with previous studies.1020 In contrast, other studies have found air pollution to be more strongly associated with adenocarcinoma.619 We also reported a significant, but less stronger than squamous cell carcinoma and small cell carcinoma, association of NO2 with adenocarcinoma, which is the most common type of lung cancer and has been steadily increasing in Korea since 2003.1 This association may be due to variation in incidence rates of adenocarcinoma during different time periods.4 We observed some variations in strengths of associations by histological subtype, which is believed to be associated with tumor location. Adenocarcinoma arises from more peripheral sites of bronchi, whereas small cell lung cancer and squamous cell carcinoma mainly occur in the large central bronchi.21
We found that effect estimates for particulate air pollutants tended to be higher for subjects with low fruit consumption (1−3 times/month), compared with subjects who had high fruit consumption (at least once/day). Previous studies have demonstrated that fruit consumption is inversely associated with lung cancer incidence.93637 Diet is considered as a source of antioxidants that may protect against oxidative stress.37 Oxidative stress has been suggested as one of the potential mechanisms of effect of air pollution. Therefore, low fruit consumption may be related to a protection against oxidative stress effects of air pollution.37
Strengths of this study include exposure assessment that was derived from 20 years of residential histories to reduce exposure misclassification. We used a relatively large sample size that allowed us to examine the associations between air pollution and lung cancer histology. Further, we were able to adjust important confounding variables. Our study has some limitations, however. Although we used LUR models to estimate exposure at each participant's home address, some degree of exposure misclassification may still be present. We had no in-formation about work address and each individual's time based activity patterns. However, the resulting misclassification is expected to be nondifferential. Our models were sensitive to the period of estimated exposure. Our results show stronger associations between air pollution and risk for lung cancer when exposure was assessed over a 10-year period (1995−2004). When the estimated exposure was limited to 5-year periods, associations between air pollution and lung cancer risk became weaker. A previous study indicated that the spatial distribution of air pollution is stable over 10-year period.38 Our findings showed that period of exposure assessment is also important in the development of lung cancer.
In conclusion, we found increased risks of lung cancer incidence with residential exposures to ambient PM10 and NO2, in particular squamous cell carcinoma and small cell carcinoma, in Korea, adding substantially to the existing literature on air pollution and lung cancer.
 XML Download