

 PDF
PDF ePub
ePub Citation
 Print
Print


INTRODUCTION
Lung size mismatch between donor and recipient is a major cause of poor lung function and worse survival after lung transplantation (LTx). However, controversy remains regarding the definition of proper size and the optimal method for predicting lung size.1234
Although thoracic diameter, chest radiography, anthropometry, weight, and other factors have been used to predict lung volume in the past,567 lung volume is now commonly calculated by formulas that utilize height, age, and sex.18 These formulas are modified and differ among nations and institutes.910 Moreover, the predictive total lung capacity (pTLC) calculated by these formulas differs among races11 and has disadvantages when applied to single LTx candidates. Also, since LTx candidates have variable thoracic cavity volumes according to their lung diseases, it is difficult to estimate their lung volumes using formulas that target the healthy population.12
This study aimed to determine the degree of differences in actual TLC (TLCCT) using chest computed tomography (CT) and the pTLC using the commonly used formula in LTx candidates. Through this comparison, this study also intended to clarify the range of difference needed for donor lung selection when using formulas to perform lung size matching.
MATERIALS AND METHODS
Patients
From January 1996 to December 2012, medical records and chest CT scans of 140 patients registered as lung transplant candidates at Gangnam Severance Hospital were retrospectively analyzed. This study received approval from the Institutional Review Board at Gangnam Severance Hospital. We excluded patients with incomplete medical records, lacking results of a pulmonary function test (PFT) or CT image, and with a history of any thoracic surgery except lung biopsy.
pTLC calculation
In this study, pTLC was calculated using European Respiratory Society (ERS) formulas, which are as follows:13
Males: pTLC (mL)=(7.99 H–7.08)×1000; and
Females: pTLC (mL)=(6.60 H–5.79)×1000, where H represents height in meters.
These equations apply to patients aged 18–70 years with a height of 1.55–1.95 m (males) or 1.45–1.80 m (females).
Pulmonary function test
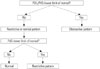
Using spirometry, the forced expiratory volume in 1 second (FEV1) and forced vital capacity (FVC) were measured. Next, FEV1/FVC ratio was calculated. Knudson prediction equations derived from a patient's age, height, and sex, were applied to the predicted values and the lower limits of normal.14 The patients' lung disease patterns were classified as obstructive disease pattern (OD group) or restrictive disease pattern (RD group) according to measured FEV1, FVC, and FEV1/FVC ratio (Fig. 1).15
CT protocol and volumetry analysis
Using a 64-slice CT system (SOMATOM Sensation 64; Siemens AG, Forchheim, Germany), routine non-enhanced CT with parameters of 130 mA and 100 kVp scanned lungs from the posterior costophrenic angles to the lung apices (3-mm beam collimation; 1.0 pitch). Raw data were processed using a medium soft-tissue kernel without edge enhancement. The scans were acquired during a single respiratory pause at the end of a maximum inspiratory effort. Patients were placed in a supine position.
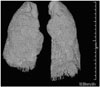
The lung volume in each CT dataset was measured using semiautomated segmentation software (Aquarius Intuition; Tera Recon Inc., Foster City, CA, USA). Threshold limits of -400 to -1024 Hounsfield units were applied to exclude the surrounding soft tissues and large vessels within the lungs.16 In most instances, this would be sufficient for isolating the lungs and central airways from undesired structures. TLCCT (L) was obtained by the number of included voxels in both lungs on the CT images (Fig. 2).
Comparison of pTLC and TLCCT
Through a comparison of pTLC calculated using the ERS equation and TLCCT measured using chest CT, differences between OD and RD groups were investigated by PFT.
Statistical analysis
All data were presented as mean±standard deviation. The difference in the sex ratio between the two groups was calculated using the Fisher's exact test, whereas the Mann-Whitney U test was used to measure the other variables. All p-values<0.050 were considered statistically significant. All statistical analyses were performed using SPSS software, version 20.0 (IBM, Somers, NY, USA).
RESULTS
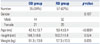
Among the 140 candidate patients, only 104 satisfied the study criteria. There were 35 patients (38%) in the OD group and 57 patients (62%) in the RD group. Twelve patients with mixed pattern of OD and RD were excluded in analysis. There was no significant difference in sex ratios (p=0.197). Age was significantly lower in the OD group than in the RD group (p<0.0001). While height did not differ between the groups (p=0.524), body weight was lower in the OD group than in the RD group (p=0.035) (Table 1).
Regarding diseases in each group, bronchiectasis was the most common, followed by lymphangioleiomyomatosis and chronic obstructive pulmonary disease (COPD), in the OD group, whereas idiopathic pulmonary fibrosis (IPF) was most common in the RD group (Fig. 3).
The values of pTLC were 5.50±1.07 L and 5.57±1.03 L in the OD and RD groups respectively, which were not significantly different (p=0.749). However, the TLCCT of the OD group (4.27±1.38 L) was significantly larger than that for the RD group (3.17±1.15 L) (p<0.0001).
In comparison of pTLC and TLCCT, the values of pTLC were significantly larger than TLCCT regardless of groups (p<0001). Also, the difference values (ΔTLC) between pTLC and TLCCT were 2.02±1.07 L in the RD group and 1.13±1.19 L in the OD group, respectively, a statistically significant difference (p=0.001). The ratios of TLCCT to pTLC were 77.0% in the OD group and 57.1% in the RD group (Table 2).
DISCUSSION
Size mismatch between a donor lung allograft and a recipient thoracic cavity in LTx can cause many complications, including poor lung function and decreased long-term survival.31718 Therefore, proper lung size matching has clinical significance in LTx.1920 When a donor lung is far smaller than the recipient's thoracic cavity, the risks of prolonged tube drainage or empyema increase. Also, lung compliance decreases when a graft hyper-expands to fill the thoracic cavity. Conversely, when a donor lung is much larger than a recipient's thoracic cavity, atelectasis or distortion of the airway anatomy prohibits sputum expectoration and causes recurrent infection. Even in severe cases, hemodynamic compromise can occur.21
Calculations of pTLC for donors and recipients with formulas are widely used in current lung size matching procedures for LTx, and such formulas are derived from sex, height, and age data of healthy individuals.11322 However, because thoracic cavity volume can vary according to a patient's lung disease pattern,23 the use of these formulas in lung size matching for LTx has several problems: for example, in patients with obstructive lung diseases, such as COPD or emphysema, the thoracic cavity size increases, compared with the normal thoracic cavity size, by diaphragmatic flattening and widening of the rib spaces,24 whereas in patients with restrictive lung disease, such as IPF, thoracic cavity size decreases due to chest wall shrinkage and contraction of the intercostal spaces.12 However, studies on degrees of size mismatch by lung diseases patterns are rare. Moreover, there is no clear evidence to demonstrate that lung disease pattern should be considered in lung size matching prior to LTx.
In evaluation of LTx candidates, most patients undergo a chest CT, by which the thoracic cavity volume can be measured,24 and recently three-dimensional CT volumetry has been utilized for size matching in living donor LTx.2526 In this study, lung diseases of LTx candidates were classified as either an obstructive or restrictive disease pattern according to the results of PFT. By comparing TLCCT measured using chest CT and pTLC calculated using the ERS equation, we intended to investigate differences between TLCCT and pTLC in LTx candidates and to determine whether we should consider lung disease patterns in size matching. Our results revealed no difference between the two groups in pTLC, whereas TLCCT was significantly larger in the OD group than in the RD group. These results suggest that actual lung volume may differ according to lung disease pattern and it is inappropriate to perform lung size matching with equations derived from data for healthy populations. Accordingly, we should consider the effect of lung disease when matching donor and recipient lung sizes.
The difference value between pTLC and TLCCT was statistically greater in the RD group than the OD group, and the ratio of TLCCT to pTLC was 77% in the OD group and 57% in the RD group. That is, irrespective of lung disease patterns, pTLC was larger than TLCCT. This finding might be attributed to differences among races, because we used the ERS equation for European in this study. Hence, when equations are applied to lung size matching, racial differences should be considered.
This study has several limitations. First, it is questionable whether the TLCCT could be substituted for the patient's actual TLC. As TLC measured by PFT represents the functional aspect and TLCCT provides the anatomical lung volume, a difference could exist between the two values. However, Cooper, et al.27 demonstrated that TLC values measured using the helium dilution technique and those measured by chest CT were quite similar (r=0.973).28 Secondly, TLCCT can change during respiration. In LTx candidates with end-stage lung disease, breath-holding is difficult; hence, error in measuring TLCCT could be exaggerated, compared with that in healthy people. However, since current CT equipment involves a single scan that is completed in a few seconds, patients with lung disease do not experience great difficulty.
In conclusion, regardless of lung disease pattern, TLCCT was smaller than pTLC calculated using a formula, and the difference was more remarkable in patients with the restrictive lung disease. Therefore, when an equation is used for donor-recipient lung size matching, the difference between TLCCT and pTLC and lung disease pattern of LTx candidates should be considered. Additionally, chest CT might be a more accurate tool for measuring TLC than an equation in lung size matching for LTx.


 XML Download